


 |
市場調查報告書
商品編碼
2116052
電源管理系統:市場佔有率分析、產業趨勢與統計、成長預測(2026-2031)Power Management System - Market Share Analysis, Industry Trends & Statistics, Growth Forecasts (2026 - 2031) |
||||||

※ 本網頁內容可能與最新版本有所差異。詳細情況請與我們聯繫。
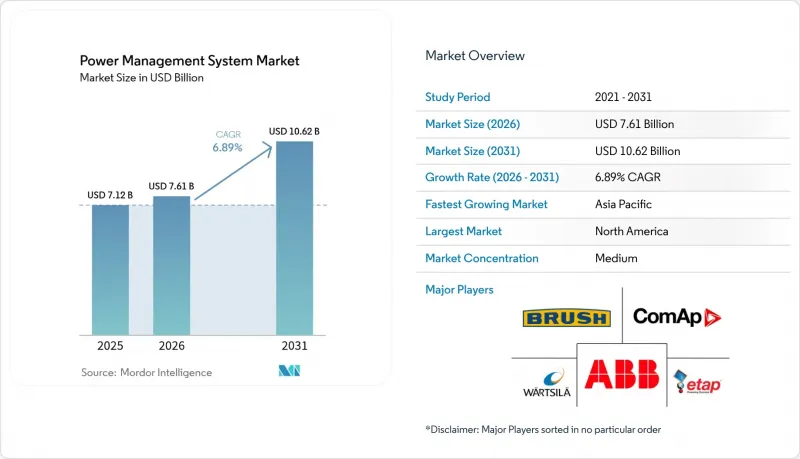
根據 Mordor Intelligence 預測,電源管理系統 (PMS) 市場規模將從 2025 年的 71.2 億美元成長到 2026 年的 76.1 億美元,然後在 2031 年達到 106.2 億美元,2026 年至 2031 年的複合年成長率為 6.89%。
本報告按組件(電力監控與控制、負載削減與管理、數據歷史/高級分析等)、電力架構(集中式 PMS、分散式 PMS、模組化/混合式 PMS)、終端用戶行業(公共產業、資料中心、石油和天然氣、航運和海上作業等)以及地區(北美、歐洲、亞太地區、南美等)進行分類。
全球電源管理系統市場趨勢與洞察
工業規模能源效率計劃面臨監管壓力
目前,美國對商用動力反應器設有最低性能標準,要求瓦斯爐的熱效率達80%,燃油爐的熱效率達81%。在日本,《能源效率法》規定,指定工廠必須任命經認證的能源管理人員並提交年度績效報告,從而促進系統性的節能,並在初期實施階段實現了26%的節能效果。歐盟各地推出的類似法規加速了數位化維修,並促進了電力管理系統市場的發展,因為各工廠競相記錄即時能源績效。
可再生能源快速併入電網,正在推動電網穩定解決方案的發展。
預計到2050年,間歇性太陽能和風能將滿足全球57%的電力負載需求,對傳統的頻率控制模式構成了挑戰。與傳統設計相比,靈活的交流輸電系統與混合儲能系統結合,穩定性提高了30%,總諧波失真降低至2%以下。這些技術進步正在推動電力管理系統市場的發展,加速了先進編配軟體的採購,這些軟體能夠平衡微電網中波動的供需。
高昂的初始安裝成本和維修成本
在對價格敏感的經濟體中,由於投資回收期超出董事會預期,預算限制正在減緩數位轉型技術的普及速度。對於中型發電廠而言,設備和整合成本可能超過100萬美元,迫使財務長推遲數位化維修。儘管政府獎勵減輕了部分負擔,但資金籌措缺口依然存在,暫時減緩了電力管理系統市場的擴張。
細分市場分析
預計2025年,電力監控與控制領域的市場規模將達到23.6億美元,佔整個電力管理系統市場的33.10%。雖然傳統的SCADA平台對於斷路器狀態監控和饋線測量仍然至關重要,但營運商擴大採用歷史資料庫,從而實現了跨站點基準測試。 「數據歷史/進階分析」細分市場預計到2031年將達到26.6億美元,以10.62%的複合年成長率呈現最快成長軌跡,這主要得益於人工智慧驅動的預測模型,這些模型可以減少計劃外停機時間並最大限度地減少能源浪費。負載削減和管理工具透過利用最佳化演算法來提高工業韌性,與基於規則的邏輯相比,這些演算法可將過載削減減少30%。在微電網部署中,發電機控制變得越來越重要,GE 的「PowerNode」可在 15 毫秒內啟動保護性負載切除,同時透過 IEC 61850 GOOSE通訊保護網路安全邊界。
此整合套件現已將監控、歷史數據和最佳化模組整合到一個雲端控制面板中,推動電力管理系統市場轉型為平台經濟。供應商正在整合安全的API,允許第三方開發人員基於核心資訊服務建立應用程式。 ABB的SACE Emax 3斷路器正是這一轉變的體現,它能夠直接將電能品質指標導入歷史資料管道。隨著脫碳法規的日益嚴格,分析模組透過量化減排量並將需量反應積分轉化為貨幣價值,在新建設規範中的應用也日益廣泛。
區域分析
預計到2025年,北美地區的銷售額將佔施耐德電氣總銷售額的32.40%,主要得益於《通膨控制法案》以及超過30吉瓦的新增資料中心電力合約。聯邦政府的獎勵使Schneider Electric得以投資7億美元,擴大其在美國的製造地,從而增強了國內供應的韌性。加拿大的能源保護產業夥伴關係正在支持ISO 50001實施補助津貼,而對墨西哥變壓器的投資則有助於緩解區域供應瓶頸。
在歐洲,嚴格的法規環境依然存在,強制企業提交永續發展報告並收緊生態設計法規,從而在德國、法國和英國實現了持續穩定的需求。在德國,工業自動化升級正在引入基於歷史數據的OEE儀錶板;而在英國,由Ofgem創新計劃資助的智慧電網試點計畫正在進行中。 《企業永續發展報告指令》(CSRD)要求企業將詳細的能源數據整合到其ESG工作流程中,加速了整個電力管理系統市場對分析技術的應用。
亞太地區預計將以8.98%的複合年成長率成長。在中國全國電力市場,綠色電力交易量將在2025年初超過220太瓦時,這將加速電力公司採用人工智慧驅動的發電計畫。印度正透過其「績效、成就與交易(PAT)」計畫推動工業能源效率的提升,並計畫透過與日本簽署的「領先者」協議,到2027年將變壓器效率提高11.4%。在日本的化學工業叢集中,工業物聯網(IIoT)正在全廠範圍內推廣應用;而在澳大利亞,正在試點建設整合微電網,以支援偏遠地區的採礦作業。
其他好處:
- Excel格式的市場預測(ME)表
- 3個月的分析師支持
目錄
第1章:引言
- 研究假設和市場定義
- 調查範圍
第2章:調查方法
第3章執行摘要
第4章 市場狀況
- 市場概覽
- 市場促進因素
- 工業規模能源效率計畫面臨的監管壓力
- 可再生能源快速併入電網,正在推動電網穩定解決方案的發展。
- 超大規模和人工智慧資料中心電力需求的快速成長
- 透過數位化/工業物聯網進行即時最佳化和分析
- 寬能隙(SiC/GaN)半導體可顯著降低開關損耗。
- 公司間的購電協議會造成微電網的複雜性,需要電力管理系統進行調整。
- 市場限制因素
- 系統實施和維修的初始成本很高。
- 與網路安全和資料主權相關的風險日益增加
- 變壓器和開關設備供應鏈中的瓶頸
- 傳統OT和IT之間互通性的障礙
- 供應鏈分析
- 監理情勢
- 技術展望
- 波特五力模型
第5章 市場規模與成長預測
- 按組件
- 電力監控與控制
- 負載停用和管理
- 能源成本會計與最佳化
- 開關和安全管理
- 發電機控制設備
- 數據歷史學家/高級分析
- 依權力架構
- 集中式PMS
- 去中心化 PMS
- 模組化/混合型PMS
- 按最終用戶行業分類
- 公用事業
- 資料中心
- 石油和天然氣
- 海洋/近海
- 金屬和採礦
- 化學品和製藥
- 其他(製造業、醫療、電信)
- 按地區
- 北美洲
- 美國
- 加拿大
- 墨西哥
- 歐洲
- 德國
- 英國
- 法國
- 義大利
- 西班牙
- 北歐國家
- 俄羅斯
- 其他歐洲國家
- 亞太地區
- 中國
- 印度
- 日本
- 韓國
- 東南亞國協
- 其他亞太國家
- 南美洲
- 巴西
- 阿根廷
- 智利
- 其他南美國家
- 中東和非洲
- 沙烏地阿拉伯
- 阿拉伯聯合大公國
- 南非
- 奈及利亞
- 埃及
- 其他中東和非洲國家
- 北美洲
第6章 競爭情勢
- 市場集中度
- 策略趨勢(併購、聯盟、購電協議)
- 市場佔有率分析(主要公司的市場排名和佔有率)
- 公司簡介
- ABB Ltd
- Siemens Energy
- Schneider Electric SE
- General Electric Vernova
- Mitsubishi Electric Corporation
- Eaton Corporation plc
- Emerson Electric Co.
- Wartsila Oyj Abp
- ComAp AS
- ETAP/Operation Technology Inc.
- Rockwell Automation
- Honeywell International Inc.
- Yokogawa Electric Corporation
- SEL Schweitzer Engineering Labs
- Kongsberg Gruppen ASA
- RH Marine Netherlands BV
- INTECH Process Automation Inc.
- Marine Control Services
- Delta Electronics Inc.
- Texas Instruments(PMIC business)
第7章 市場機會與未來展望
According to Mordor Intelligence, the power management system market size is expected to grow from USD 7.12 billion in 2025 to USD 7.61 billion in 2026 and is forecast to reach USD 10.62 billion by 2031 at 6.89% CAGR over 2026-2031.
This report is Segmented by Component (Power Monitoring and Control, Load Shedding and Management, Data Historian/Advanced Analytics, and More), Power-Architecture (Centralised PMS, Distributed PMS, and Modular/Hybrid PMS), End-User Industry (Utilities, Data Centres, Oil and Gas, Marine and Offshore, and More), and Geography (North America, Europe, Asia Pacific, South America, and More).
Global Power Management System Market Trends and Insights
Regulatory Pressure for Industrial-Scale Energy Efficiency Programs
Minimum performance standards now apply to commercial furnaces in the United States, requiring 80% thermal efficiency for gas-fired units and 81% for oil-fired systems. Japan's Energy Efficiency Act obliges designated factories to appoint certified energy managers and submit annual performance reports, fostering systematic energy savings that have reached 26% in early deployments.Similar mandates across the EU accelerate digital retrofits and strengthen the power management system market as plants race to document real-time energy performance.
Rapid Renewable-Grid Integration Driving Grid-Stability Solutions
Intermittent solar and wind are forecast to supply 57% of global service-load electricity by 2050, challenging conventional frequency-control paradigms. Flexible AC transmission systems paired with hybrid storage deliver 30% stability improvements and cut total harmonic distortion below 2% compared with legacy designs. These technical gains stimulate procurement of advanced orchestration software that balances variable supply and demand across microgrids, bolstering the power management system market.
High Upfront System & Retrofit Costs
Budget constraints slow adoption in price-sensitive economies where capital recovery timelines exceed typical board expectations. Equipment plus integration outlays can exceed USD 1 million for a mid-sized plant, pressuring CFOs to delay digital retrofits. Government incentives mitigate some burden, yet financing gaps persist, temporarily tempering the expansion of the power management system market.
Other drivers and restraints analyzed in the detailed report include:
- Exponential Rise of Hyperscale & AI Data-Center Power Demand
- Wide-Bandgap (SiC/GaN) Semiconductors Slash Switching Losses
- Escalating Cyber-Security & Data-Sovereignty Risks
For complete list of drivers and restraints, kindly check the Table Of Contents.
Segment Analysis
Power Monitoring & Control booked USD 2.36 billion in 2025, equivalent to 33.10% of the power management system market size. Legacy SCADA platforms remain indispensable for breaker status and feeder metering; however, operators are increasingly overlaying historian databases that unlock cross-site benchmarking. Data Historian/Advanced Analytics is projected to have the quickest trajectory, with a 10.62% CAGR, reaching USD 2.66 billion by 2031, as AI-driven predictive models reduce unplanned downtime and cut energy waste. Load Shedding and Management tools leverage optimisation algorithms that trim load overcut by 30% compared to rule-based logic, sharpening industrial resiliency. Generator Controls gain relevance in microgrid deployments, with GE's PowerNode initiating protective load-sheds within 15 milliseconds while safeguarding cyber-perimeters through IEC 61850 GOOSE messaging.
Integrated suites now converge monitoring, historian, and optimisation modules into cloud-ready dashboards, steering the power management system market toward platform economics. Vendors embed secure APIs, allowing third-party developers to build applications on top of core data services. ABB's SACE Emax 3 breaker showcases this shift by exposing energy-quality metrics directly into historian pipelines. As decarbonisation mandates tighten, analytics modules quantify avoided emissions and monetise demand-response credits, elevating their share of new-build specifications.
Complete Report Scope:
- By Component
- Power Monitoring and Control
- Load Shedding and Management
- Energy Cost Accounting and Optimisation
- Switching and Safety Management
- Generator Controls
- Data Historian/Advanced Analytics
- By Power-Architecture
- Centralised PMS
- Distributed PMS
- Modular / Hybrid PMS
- By End-User Industry
- Utilities
- Data Centres
- Oil and Gas
- Marine and Offshore
- Metals and Mining
- Chemicals and Pharmaceuticals
- Others (Manufacturing, Healthcare, Telecom)
- By Geography
- North America
- United States
- Canada
- Mexico
- Europe
- Germany
- United Kingdom
- France
- Italy
- Spain
- NORDIC Countries
- Russia
- Rest of Europe
- Asia Pacific
- China
- India
- Japan
- South Korea
- ASEAN Countries
- Rest of Asia Pacific
- South America
- Brazil
- Argentina
- Chile
- Rest of South America
- Middle East and Africa
- Saudi Arabia
- United Arab Emirates
- South Africa
- Nigeria
- Egypt
- Rest of Middle East and Africa
- North America
Geography Analysis
North America contributed 32.40% of 2025 revenue, underpinned by the Inflation Reduction Act and a pipeline of more than 30 GW in new data-center power agreements. Federal incentives have encouraged Schneider Electric to commit USD 700 million toward U.S. manufacturing expansion, enhancing domestic supply resilience. Canada's Industry Partnership for Energy Conservation sponsors ISO 50001 adoption grants, while Mexican transformer investments mitigate regional bottlenecks.
Europe maintains a stringent regulatory environment that mandates corporate sustainability reporting and tightens eco-design rules, sustaining steady demand across Germany, France, and the United Kingdom. Industrial automation upgrades in Germany deploy historian-driven OEE dashboards, whereas the U.K. pushes smart-grid pilots funded by Ofgem innovation programs. The Corporate Sustainability Reporting Directive drives enterprises to integrate granular energy data into ESG workflows, thereby strengthening the uptake of analytics throughout the power management system market.
Asia-Pacific region is poised for a 8.98% CAGR. China's national power market saw green-electricity trading exceed 220 TWh in early 2025, spurring utilities to adopt AI-enabled dispatch planning. India advances industrial energy efficiency under the Perform, Achieve, and Trade scheme and commits to achieving 11.4% transformer efficiency gains by 2027 through Japan's Top Runner collaboration. Japan's chemical clusters embrace factory-wide IIoT overlays, while Australia pilots integrated microgrids to support remote mining operations.
- ABB Ltd
- Siemens Energy
- Schneider Electric SE
- General Electric Vernova
- Mitsubishi Electric Corporation
- Eaton Corporation plc
- Emerson Electric Co.
- Wartsila Oyj Abp
- ComAp AS
- ETAP / Operation Technology Inc.
- Rockwell Automation
- Honeywell International Inc.
- Yokogawa Electric Corporation
- SEL Schweitzer Engineering Labs
- Kongsberg Gruppen ASA
- RH Marine Netherlands BV
- INTECH Process Automation Inc.
- Marine Control Services
- Delta Electronics Inc.
- Texas Instruments (PMIC business)
Additional Benefits:
- The market estimate (ME) sheet in Excel format
- 3 months of analyst support
TABLE OF CONTENTS
1 Introduction
- 1.1 Study Assumptions & Market Definition
- 1.2 Scope of the Study
2 Research Methodology
3 Executive Summary
4 Market Landscape
- 4.1 Market Overview
- 4.2 Market Drivers
- 4.2.1 Regulatory pressure for industrial?scale energy efficiency programs
- 4.2.2 Rapid renewable?grid integration driving grid-stability solutions
- 4.2.3 Exponential rise of hyperscale & AI data-center power demand
- 4.2.4 Digitalisation/IIoT enabling real-time optimisation & analytics
- 4.2.5 Wide-bandgap (SiC/GaN) semiconductors slash switching losses
- 4.2.6 Corporate PPAs create micro-grid complexity needing PMS orchestration
- 4.3 Market Restraints
- 4.3.1 High upfront system & retrofit costs
- 4.3.2 Escalating cyber-security & data-sovereignty risks
- 4.3.3 Transformer & switchgear supply-chain bottlenecks
- 4.3.4 Legacy OT/IT interoperability barriers
- 4.4 Supply-Chain Analysis
- 4.5 Regulatory Landscape
- 4.6 Technological Outlook
- 4.7 Porter's Five Forces
- 4.7.1 Bargaining Power of Suppliers
- 4.7.2 Bargaining Power of Buyers
- 4.7.3 Threat of New Entrants
- 4.7.4 Threat of Substitutes
- 4.7.5 Intensity of Competitive Rivalry
5 Market Size & Growth Forecasts
- 5.1 By Component
- 5.1.1 Power Monitoring and Control
- 5.1.2 Load Shedding and Management
- 5.1.3 Energy Cost Accounting and Optimisation
- 5.1.4 Switching and Safety Management
- 5.1.5 Generator Controls
- 5.1.6 Data Historian/Advanced Analytics
- 5.2 By Power-Architecture
- 5.2.1 Centralised PMS
- 5.2.2 Distributed PMS
- 5.2.3 Modular / Hybrid PMS
- 5.3 By End-User Industry
- 5.3.1 Utilities
- 5.3.2 Data Centres
- 5.3.3 Oil and Gas
- 5.3.4 Marine and Offshore
- 5.3.5 Metals and Mining
- 5.3.6 Chemicals and Pharmaceuticals
- 5.3.7 Others (Manufacturing, Healthcare, Telecom)
- 5.4 By Geography
- 5.4.1 North America
- 5.4.1.1 United States
- 5.4.1.2 Canada
- 5.4.1.3 Mexico
- 5.4.2 Europe
- 5.4.2.1 Germany
- 5.4.2.2 United Kingdom
- 5.4.2.3 France
- 5.4.2.4 Italy
- 5.4.2.5 Spain
- 5.4.2.6 NORDIC Countries
- 5.4.2.7 Russia
- 5.4.2.8 Rest of Europe
- 5.4.3 Asia Pacific
- 5.4.3.1 China
- 5.4.3.2 India
- 5.4.3.3 Japan
- 5.4.3.4 South Korea
- 5.4.3.5 ASEAN Countries
- 5.4.3.6 Rest of Asia Pacific
- 5.4.4 South America
- 5.4.4.1 Brazil
- 5.4.4.2 Argentina
- 5.4.4.3 Chile
- 5.4.4.4 Rest of South America
- 5.4.5 Middle East and Africa
- 5.4.5.1 Saudi Arabia
- 5.4.5.2 United Arab Emirates
- 5.4.5.3 South Africa
- 5.4.5.4 Nigeria
- 5.4.5.5 Egypt
- 5.4.5.6 Rest of Middle East and Africa
- 5.4.1 North America
6 Competitive Landscape
- 6.1 Market Concentration
- 6.2 Strategic Moves (M&A, Partnerships, PPAs)
- 6.3 Market Share Analysis (Market Rank/Share for key companies)
- 6.4 Company Profiles (includes Global level Overview, Market level overview, Core Segments, Financials as available, Strategic Information, Products & Services, and Recent Developments)
- 6.4.1 ABB Ltd
- 6.4.2 Siemens Energy
- 6.4.3 Schneider Electric SE
- 6.4.4 General Electric Vernova
- 6.4.5 Mitsubishi Electric Corporation
- 6.4.6 Eaton Corporation plc
- 6.4.7 Emerson Electric Co.
- 6.4.8 Wartsila Oyj Abp
- 6.4.9 ComAp AS
- 6.4.10 ETAP / Operation Technology Inc.
- 6.4.11 Rockwell Automation
- 6.4.12 Honeywell International Inc.
- 6.4.13 Yokogawa Electric Corporation
- 6.4.14 SEL Schweitzer Engineering Labs
- 6.4.15 Kongsberg Gruppen ASA
- 6.4.16 RH Marine Netherlands BV
- 6.4.17 INTECH Process Automation Inc.
- 6.4.18 Marine Control Services
- 6.4.19 Delta Electronics Inc.
- 6.4.20 Texas Instruments (PMIC business)
7 Market Opportunities & Future Outlook
- 7.1 White-space & Unmet-Need Assessment

 電錶後端電力解決方案市場預測—按技術、應用、最終用戶和地區分類的全球分析—2034年
 全球電源管理服務市場規模、佔有率、趨勢和成長分析報告(2026-2034年)全球電源管理系統市場規模、佔有率、趨勢和成長分析報告(2026-2034年)
 電源管理系統市場 - 全球產業規模、佔有率、趨勢、機會及預測(按類型、模組、最終用戶、地區和競爭格局分類,2021-2031年)
 電源管理系統市場規模、佔有率和成長分析(按系統類型、應用、最終用戶產業和地區分類)-產業預測,2026-2033年全球電源管理系統市場-2025-2030年預測
 全球電源管理服務市場能源管理儀表市場:2025-2030 年預測全球電源管理解決方案市場2030 年電源管理系統市場預測:按組件、技術、應用、最終用戶和地區進行的全球分析