


 |
市場調查報告書
商品編碼
2116043
數位農業:市場佔有率分析、產業趨勢與統計、成長預測(2026-2031)Digital Agriculture - Market Share Analysis, Industry Trends & Statistics, Growth Forecasts (2026 - 2031) |
||||||

※ 本網頁內容可能與最新版本有所差異。詳細情況請與我們聯繫。
根據 Mordor Intelligence 估計,到 2025 年,數位農業市場價值將達到 243.2 億美元,到 2026 年將達到 268.2 億美元。
此外,預計在預測期內,該行業將以 10.26% 的複合年成長率成長,到 2031 年達到 437.1 億美元。
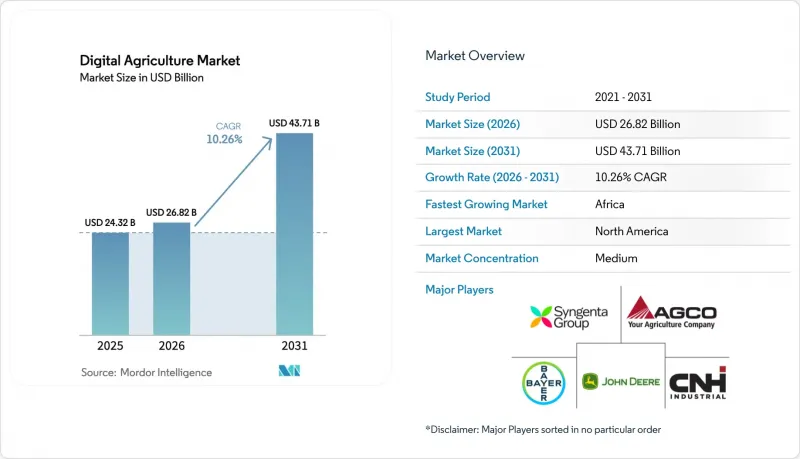
本報告按技術(導航系統、遙感探測和影像處理等)、組件(硬體、軟體和服務)、應用(作物監測、產量測繪和預測等)、農場規模(小規模農場等)和地區(北美、歐洲、亞太地區等)進行細分。市場預測以價值(美元)表示。
全球數位農業市場趨勢與洞察
精確最佳化投入材料並提高產量
數位農業市場的生產者往往最快採用那些能顯著改善田間經濟效益的工具。變數施肥和基於攝影機的噴灑等技術至關重要,因為它們能夠在不迫使生產者接受不確定收益的情況下最大限度地減少浪費。據迪爾公司稱,其「目視噴灑」系統在2024年的田間試驗中減少了高達59%的除草劑用量,這為農民採用數位技術提供了明確的成本獎勵。聯合國糧農組織(FAO)報告稱,2020年至2024年間,化肥和作物保護成本將大幅上漲,利潤率面臨巨大壓力,因此精準投入變得愈發重要。迪爾公司還重點介紹了其「FurrowVision」系統的潛力,該系統利用三個行內攝影機提供即時深度數據並自動最佳化下壓力,可將每英畝產量提高多達20蒲式耳。這清楚地表明,精準投入管理為何仍然是數位農業市場的主要驅動力,因為它將技術投資與成本控制和作物產量提高直接聯繫起來。
降低感測器、無人機和導引系統的成本。
硬體成本的降低使得那些曾經認為精密農業工具是一項重大資本投資的農場更容易進入數位農業市場。根據大疆農業(DJI Agriculture)的報告顯示,到2025年底,全球100多個國家將部署超過60萬架無人機,由超過60萬名訓練有素的操作員操控。 2025年,巴西推出了超視距飛行豁免政策,允許單一操作員每天覆蓋200公頃的土地,並將投資回收期縮短至不到18個月。智慧型手機供應鏈的進步已將熱成像攝影機的成本從5000美元降至800美元,使得在生長季進行作物壓力檢測和乾預變得更加容易。國際民航組織(ICAO)的監管協調使得獲得許可的業者能夠在歐洲範圍內競標,從而促進了跨境服務模式的發展。這些成本降低和監管改進使得無人機成為可行的選擇,即使對於以前依賴人工噴灑的小規模農戶來說也是如此。此外,實施範圍的擴大產生了更豐富的影像資料集,提高了基於機器學習的產量預測的準確性。
小規模農場面臨前期投資高、投資報酬率不確定等問題。
資本密集度仍然是限制數位農業市場成長的主要因素,尤其對於無法將固定成本分攤到廣大土地上的小規模農場而言更是如此。實施整套技術方案通常需要同時投資硬體、訂閱服務、資訊服務和培訓,這使得儘管具有潛在的長期效益,但最初的採用決策卻更加困難。當生產者難以獲得正規資金籌措或年度現金儲備緊張時,這個問題尤其突出。一項針對西非(塞內加爾、象牙海岸共和國和貝南)3,660名生產者的調查發現,60%的受訪者僅擁有基本型行動電話,20%的受訪者根本沒有行動電話。這凸顯了這些地區數位基礎設施的匱乏。這些發現至關重要,因為即使是低成本的諮詢模式也無法假定智慧型手機已廣泛普及。此外,當農民的收入受到農產品價格波動或惡劣天氣的影響時,經常性的軟體訂閱費用往往是他們首先削減的開支。為了加快小規模農戶採用數位農業,供應商需要發展以服務、團體使用、設備共用或基於結果的收費為重點的定價模式。
細分市場分析
導航系統仍然是數位農業市場中最大的技術細分領域,預計到2025年將佔銷售額的29.4%。這一主導地位反映了導航系統在作物輪作、特色作物和大規模糧食種植中的廣泛應用,在這些領域,精準轉向是一項基本功能,而非可選附加功能。此外,導航系統仍然保持著強勁的競爭力,因為改裝套件允許生產者在不更換整套機械設備的情況下升級老舊的車輛。人工智慧(AI)和進階分析是成長最快的技術細分領域,隨著農業平台不斷添加生成式人工智慧、電腦視覺和預測性決策工具,預計到2031年,該領域的數位農業市場將以11.3%的複合年成長率成長。
由於低成本感測器技術與能夠將田間數據轉化為灌溉、施肥和種植作業的平台相結合,「物聯網 (IoT) 和互聯感測器」領域正在蓬勃發展。據 CropX 公司稱,在其 V4 感測器的部署以及嚴格遵循其灌溉建議,使得北部平原地區的作物產量提高了每英畝 20-30 蒲式耳。 「區塊鏈和可追溯性」領域目前規模仍然較小,但由於碳排放監測、報告和檢驗(MRV)、原產地證書和供應鏈報告的需求,其在出口和低碳作物管道中的商業性作用日益凸顯。 「機器人和自動化」領域正朝著更商業性的方向發展,預計在 2026 年,約翰迪爾 (Deere)、愛科 (AGCO) 和久保田 (Kubota) 等公司將自動駕駛技術從示範階段推進到全面部署階段。這標誌著數位農業市場正從獨立的精密農業工具轉向互聯的執行系統。
2025年,硬體佔組件銷售額的43.2%。這反映了整個數位農業市場中部署的導航接收器、天線、感測器、無人機、顯示器和聯網農業機械的數量。硬體仍然是部署的基礎,因為要實現軟體的價值,需要在農場進行多層實體資料收集、定位和控制。同時,軟體是成長最快的領域,預計到2031年將以9.8%的複合年成長率成長,因為供應商正在將其收入來源轉向訂閱、資訊服務和持續農業工作流程。迪爾、AGCO、先正達和BASF分別透過其營運中心高級許可證、PTx FarmEngage、Cropwise開放平台和xarvio FIELD MANAGER引領這一方向,這表明數位農業產業正穩步向持續軟體價值轉型。
服務仍然是第三大支柱,涵蓋農業支持、實施、數據整合和基於結果的諮詢。BASF的「xarvio HEALTHY FIELDS」於2025年在日本推出,該方案表明,在軟體之上整合產量保證和服務層,可以為生產者創造更具差異化的提案。隨著資料品質和API存取如今與硬體所有權一樣影響購買決策,開放式整合的重要性日益凸顯。凱斯紐荷蘭的「FieldOps」生態系統和DTN廣泛的農業智慧部署,都顯示了連網服務的重要性,而這一趨勢將繼續提升軟體和服務在整個數位農業市場中的佔有率。
區域分析
到2025年,北美將佔據數位農業市場佔有率的37.8%。這主要得益於大規模的農地、較高的機械化率以及美國農業部「氣候智慧型商品計畫」的持續資助。美國環保署(EPA)的除草劑法規正在加速精準噴灑技術的應用,而食品藥物管理局(FDA)的牲畜可追溯性法規則推動了對記錄保存軟體的需求。加拿大草原地區的糧食生產系統也取得了類似的進展,而墨西哥正致力於彌合農村寬頻差距,目標是到2026年實現80%的覆蓋率。成熟的經銷商網路和資金籌措管道正在推動下一代自動駕駛曳引機的快速普及。此外,人們對網路安全意識的不斷提高也加速了美國國家標準與技術研究院(NIST)所倡導的最佳實踐的推廣應用。
預計非洲將在數位農業市場實現最高成長率,複合年成長率 (CAGR) 將達到 10.9%。這一成長主要得益於主導服務、數位化農戶註冊、智慧灌溉和可控環境項目,這些技術使各個細分市場能夠擺脫對傳統硬體依賴的部署方式。預計到 2031 年,南美洲的複合年成長率將達到 10.0%,其中巴西憑藉其龐大的商業農業基礎和不斷成長的技術投資,將引領該地區的發展。阿根廷和巴西的大規模農作物生產為導航系統、衛星監測、自主田間作業和無人機農業技術的發展奠定了堅實的基礎。
在歐洲,預計成長率將更高,合規性仍然是數位農業市場的關鍵關注點,因為有關補貼資格和永續性的法規日益將數位記錄與農業實踐聯繫起來。法國和德國正致力於農業機器人的整合,推動該地區轉型為自主農業機械和數位控制系統。相較之下,在俄羅斯,制裁、進口限制和技術取得的不穩定性繼續阻礙農業數位化進程,預計成長速度將相對緩慢。 「從農場到餐桌」策略旨在到2030年將農藥使用量減少50%,這推動了對基於訂閱的分析服務的需求,以最佳化化學品的使用。賦予農民遙測資料所有權的資料管治法律正在推動支持開放交換框架的平台的設計。此外,製造商正在對邊緣人工智慧模組進行在地化,以符合歐盟的《人工智慧法》,從而縮短認證時間。
其他好處:
- Excel格式的市場預測(ME)表
- 3個月的分析師支持
目錄
第1章:引言
- 研究假設和市場定義
- 調查範圍
第2章:調查方法
第3章執行摘要
第4章 市場狀況
- 市場概覽
- 市場促進因素
- 精確最佳化投入量並提高產量
- 降低感測器、無人機和導引系統的成本。
- 農業勞動力短缺正在加速自動化進程。
- 獎勵和促進氣候意識型農業的合規要求
- 將碳排放監測、報告和核查(MRV)以及範圍3數據貨幣化
- 嵌入式金融和數位公共基礎設施
農民
- 市場限制因素
- 小規模農場前期投資大,投資報酬率不確定
- 農村地區通訊基礎設施不完善,且缺乏數位技能。
- 互通性挑戰和供應商鎖定
- 互聯機械和農業數據平台的網路安全風險
- 監理情勢
- 技術展望
- 波特五力分析
第5章 市場規模與成長預測
- 透過技術
- 導航系統
- 遙感探測和影像處理
- 可變利率技術
- 人工智慧和進階分析
- 物聯網 (IoT) 和聯網感測器
- 區塊鏈和可追溯性
- 機器人與自動化
- 按組件
- 硬體
- 軟體
- 服務
- 透過使用
- 作物監測
- 產量測繪與預測
- 土壤監測和土壤健康分析
- 氣象追蹤與預報
- 精準噴灑及最佳化投入量
- 無人機分析
- 追蹤牲畜健康狀況
- 按農場規模
- 小規模農場(少於100公頃)
- 中型農場(100-500公頃)
- 大型農場(超過500公頃)
- 按地區
- 北美洲
- 美國
- 加拿大
- 墨西哥
- 其他北美國家
- 歐洲
- 德國
- 英國
- 法國
- 義大利
- 西班牙
- 俄羅斯
- 其他歐洲國家
- 亞太地區
- 中國
- 印度
- 日本
- 澳洲
- 韓國
- 其他亞太國家
- 南美洲
- 巴西
- 阿根廷
- 其他南美國家
- 中東
- 沙烏地阿拉伯
- 阿拉伯聯合大公國
- 土耳其
- 其他中東國家
- 非洲
- 南非
- 埃及
- 其他非洲國家
- 北美洲
第6章 競爭情勢
- 市場集中度
- 策略趨勢
- 市佔率分析
- 公司簡介
- Deere & Company
- CNH Industrial NV
- Bayer AG
- AGCO Corporation
- Syngenta Group
- International Business Machines Corporation
- Microsoft Corporation
- Hexagon AB
- KUBOTA Corporation
- Topcon Corporation
- SZ DJI Technology Co., Ltd.
- Planet Labs PBC
- Farmers Edge Inc.
- AeroVironment Inc.
- Traction Ag
第7章 市場機會與未來展望
According to Mordor Intelligence, the digital agriculture market size stood at USD 24.32 billion in 2025 and is estimated to reach USD 26.82 billion in 2026, growing at a 10.26% CAGR during the forecast period to reach USD 43.71 billion by 2031.
This report is Segmented by Technology (Guidance Systems, Remote Sensing and Imaging, and More), by Component (Hardware, Software, and Services), by Application (Crop Monitoring, Yield Mapping and Forecasting, and More), by Farm Size (Small-Scale Farms, and More), and by Geography (North America, Europe, Asia-Pacific, and More). The Market Forecasts are Provided in Terms of Value (USD).
Global Digital Agriculture Market Trends and Insights
Precision Input Optimization and Yield Uplift
Growers in the digital agriculture market tend to adopt tools most rapidly when these tools visibly improve field economics. Technologies like variable-rate application and camera-based spraying are significant because they minimize waste without requiring growers to accept uncertain returns. According to Deere, its See and Spray system reduced herbicide use by up to 59% during 2024 field trials, providing farmers with a clear cost-saving incentive to adopt digital technologies. The pressure on margins has been substantial, as the FAO reported a sharp increase in fertilizer and crop protection costs between 2020 and 2024, making precise input usage increasingly critical. Deere also highlighted that its FurrowVision system, which uses three in-furrow cameras to deliver real-time depth data and automated DownForce optimization, has the potential to improve yields by up to 20 bushels per acre. This underscores why precision input control remains a key driver in the digital agriculture market, as it directly connects technology investments to both cost management and crop yield improvements.
Falling Sensor, Drone, and Guidance-System Costs
Lower hardware costs are widening access to the digital agriculture market for farms that once viewed precision tools as a high-capital purchase. DJI Agriculture reported that by the end of 2025, it had more than 600,000 drones deployed globally across more than 100 countries, supported by more than 600,000 trained operators. In 2025, Brazil introduced beyond-visual-line-of-sight waivers, enabling a single operator to cover 200 hectares per day and reduce payback periods to less than 18 months. The cost of thermal cameras, previously USD 5,000, dropped to USD 800 due to advancements in smartphone supply chains, making stress detection more accessible for mid-season interventions. The International Civil Aviation Organization's harmonization efforts now permit licensed operators to bid across the European region, facilitating cross-border service models. These lower costs, combined with regulatory improvements, have made drones a viable option for small-scale farmers who previously relied on manual spraying. Additionally, broader deployment generates richer image datasets, enhancing machine-learning-based yield forecasts.
High Upfront Investment and Uncertain Payback for Smaller Farms
Capital intensity remains a significant constraint on the growth of the digital agriculture market, particularly for smaller farms that cannot distribute fixed costs across extensive acreage. Implementing full technology stacks often involves simultaneous investments in hardware, subscriptions, data services, and training, making the initial adoption decision more challenging despite potential long-term benefits. This issue is more pronounced in cases where growers have limited access to formal financing or operate with tight annual cash reserves. A study in West Africa, involving 3,660 producers across Senegal, Cote d'Ivoire, and Benin, found that 60% of respondents owned only basic phones, while 20% had no phone at all. This highlights the limited digital infrastructure in such regions. These findings are critical, as even low-cost advisory models cannot assume widespread smartphone availability. Additionally, recurring software subscription costs are often among the first to be reduced when farm income is impacted by fluctuating commodity prices or adverse weather conditions. To accelerate the adoption of digital agriculture among smallholders, vendors must develop pricing models that emphasize services, group access, shared equipment, or outcome-based billing structures.
Other drivers and restraints analyzed in the detailed report include:
- Farm Labor Shortages Accelerating Automation
- Climate-Smart Farming Incentives and Compliance Demand
- Cybersecurity Exposure Across Connected Machinery and Farm Data Platforms
For complete list of drivers and restraints, kindly check the Table Of Contents.
Segment Analysis
Guidance Systems remained the largest technology segment in the digital agriculture market, accounting for 29.4% of revenue in 2025. Their lead reflects broad adoption across row crops, specialty crops, and large-grain operations, where steering accuracy has become a baseline capability rather than an optional add-on. Guidance also stays resilient because retrofit kits let growers improve older fleets without replacing whole machinery lines. Artificial Intelligence and Advanced Analytics is the fastest-growing technology segment, and the digital agriculture market for this category is projected to expand at a 11.3% CAGR through 2031 as agronomy platforms add generative AI, computer vision, and predictive decision-making tools.
The Internet of Things and Connected Sensors segment is expanding as lower-cost sensing is paired with platforms that can turn field data into irrigation, nutrient, and crop actions. CropX said deployments of its V4 sensors delivered 20-30 bushel-per-acre yield improvements in the Northern Plains when growers closely followed its irrigation recommendations. Blockchain and Traceability is still smaller, but demand from carbon MRV, provenance, and supply chain reporting is giving it a clearer commercial role in export and low-carbon crop channels. Robotics and Automation is moving into a more commercial phase in 2026 as Deere, AGCO, and Kubota push autonomy from demonstration into active deployment, which means the digital agriculture market is shifting from stand-alone precision tools toward connected execution systems
Hardware accounted for 43.2% of component revenue in 2025, reflecting the installed base of guidance receivers, antennas, sensors, drones, displays, and connected machinery across the digital agriculture market. Hardware still anchors deployments because farms need physical collection, positioning, and control layers before software value can be realized. At the same time, Software is the fastest-growing component and is projected to expand at 9.8% CAGR through 2031 as vendors move revenue toward subscriptions, data services, and recurring agronomy workflows. Deere, AGCO, Syngenta, and BASF are all advancing this direction through Operations Center Advanced License, PTx FarmEngage, Cropwise Open Platform, and xarvio FIELD MANAGER, indicating that the digital agriculture industry is steadily moving toward recurring software value.
Services remain the third component pillar and include agronomic support, deployment, implementation, data integration, and outcome-based advisory. BASF's xarvio HEALTHY FIELDS launch in Japan during 2025 demonstrated how yield guarantees and service layers can sit atop software to create a more differentiated offer for growers. Open integration is becoming more important because data quality and API access now influence buying decisions as much as hardware ownership does. CNH's FieldOps ecosystem and DTN's broad farm intelligence footprint show why connected services matter, and that trend should keep lifting software and service share across the digital agriculture market
Complete Report Scope:
- By Technology
- Guidance Systems
- Remote Sensing and Imaging
- Variable Rate Technology
- Artificial Intelligence and Advanced Analytics
- Internet of Things and Connected Sensors
- Blockchain and Traceability
- Robotics and Automation
- By Component
- Hardware
- Software
- Services
- By Application
- Crop Monitoring
- Yield Mapping and Forecasting
- Soil Monitoring and Soil Health Analytics
- Weather Tracking and Forecasting
- Precision Spraying and Input Optimization
- Drone Analytics
- Livestock Health Tracking
- By Farm Size
- Small-Scale Farms (Less Than 100 ha)
- Medium-Scale Farms (100 - 500 ha)
- Large-Scale Farms (More Than 500 ha)
- By Geography
- North America
- United States
- Canada
- Mexico
- Rest of North America
- Europe
- Germany
- United Kingdom
- France
- Italy
- Spain
- Russia
- Rest of Europe
- Asia-Pacific
- China
- India
- Japan
- Australia
- South Korea
- Rest of Asia-Pacific
- South America
- Brazil
- Argentina
- Rest of South America
- Middle East
- Saudi Arabia
- United Arab Emirates
- Turkey
- Rest of Middle East
- Africa
- South Africa
- Egypt
- Rest of Africa
- North America
Geography Analysis
North America accounted for 37.8% of the digital agriculture market share in 2025, driven by large farm sizes, high mechanization rates, and sustained funding from the United States Department of Agriculture's Climate-Smart Commodity Program. Restrictions on herbicides by the Environmental Protection Agency are accelerating the adoption of precision spraying technologies, while the Food and Drug Administration's livestock traceability rule is boosting demand for record-keeping software. In Canada, similar advancements are observed in prairie grain systems, while Mexico is working to close rural broadband gaps, aiming for 80% coverage by 2026. Established dealer networks and financing channels are facilitating the rapid adoption of next-generation autonomous tractors. Additionally, heightened cybersecurity awareness is promoting faster implementation of the National Institute of Standards and Technology best practices.
Africa is anticipated to achieve the highest growth rate in the digital agriculture market, with a CAGR of 10.9%. This growth is attributed to mobile-led services, digital farmer registration, smart irrigation, and controlled-environment programs, enabling segments of the market to bypass traditional, hardware-intensive adoption methods. South America is projected to grow at a CAGR of 10.0% through 2031, with Brazil serving as the regional anchor due to its extensive commercial farming base and increasing technology investments. Argentina and Brazil together provide a strong foundation for guidance systems, satellite monitoring, autonomous fieldwork, and drone-supported agronomy, driven by their large-scale row-crop production.
Europe is anticipated to experience a higher growth rate and remains the most compliance-driven region in the digital agriculture market, as subsidy eligibility and sustainability regulations increasingly link digital records to farming practices. France and Germany are focusing on agricultural robotics collaboration, supporting a regional shift toward autonomous machinery and digital control systems. In contrast, Russia is anticipated to see more subdued growth due to sanctions, import restrictions, and inconsistent access to technology, which continue to hinder the pace of farm digitalization. The Farm to Fork strategy, targeting a 50% reduction in pesticide use by 2030, is increasing demand for subscription-based analytics to optimize chemical use . Data governance laws granting farmers ownership of telemetry data are shaping platform designs to support open exchange frameworks. Furthermore, manufacturers are localizing edge artificial intelligence modules to align with the European Union Artificial Intelligence Act, thereby shortening certification timelines.
- Deere & Company
- CNH Industrial N.V.
- Bayer AG
- AGCO Corporation
- Syngenta Group
- International Business Machines Corporation
- Microsoft Corporation
- Hexagon AB
- KUBOTA Corporation
- Topcon Corporation
- SZ DJI Technology Co., Ltd.
- Planet Labs PBC
- Farmers Edge Inc.
- AeroVironment Inc.
- Traction Ag
Additional Benefits:
- The market estimate (ME) sheet in Excel format
- 3 months of analyst support
TABLE OF CONTENTS
1 Introduction
- 1.1 Study Assumptions and Market Definition
- 1.2 Scope of the Study
2 Research Methodology
3 Executive Summary
4 Market Landscape
- 4.1 Market Overview
- 4.2 Market Drivers
- 4.2.1 Precision Input Optimization and Yield Uplift
- 4.2.2 Falling Sensor, Drone, and Guidance-System Costs
- 4.2.3 Farm Labor Shortages Accelerating Automation
- 4.2.4 Climate-Smart Farming Incentives and Compliance Demand
- 4.2.5 Carbon MRV and Scope 3 Data Monetization
- 4.2.6 Embedded Finance and Digital Public Infrastructure for
Farmers
- 4.3 Market Restraints
- 4.3.1 High Upfront Investment and Uncertain Payback for Smaller Farms
- 4.3.2 Rural Connectivity Gaps and Limited Digital Skills
- 4.3.3 Interoperability Friction and Vendor Lock-In
- 4.3.4 Cybersecurity Exposure Across Connected Machinery and Farm Data Platforms
- 4.4 Regulatory Landscape
- 4.5 Technological Outlook
- 4.6 Porter's Five Forces Analysis
- 4.6.1 Bargaining Power of Buyers
- 4.6.2 Bargaining Power of Suppliers
- 4.6.3 Threat of Substitutes
- 4.6.4 Threat of New Entrants
- 4.6.5 Intensity of Competitive Rivalry
5 Market Size and Growth Forecasts (Value)
- 5.1 By Technology
- 5.1.1 Guidance Systems
- 5.1.2 Remote Sensing and Imaging
- 5.1.3 Variable Rate Technology
- 5.1.4 Artificial Intelligence and Advanced Analytics
- 5.1.5 Internet of Things and Connected Sensors
- 5.1.6 Blockchain and Traceability
- 5.1.7 Robotics and Automation
- 5.2 By Component
- 5.2.1 Hardware
- 5.2.2 Software
- 5.2.3 Services
- 5.3 By Application
- 5.3.1 Crop Monitoring
- 5.3.2 Yield Mapping and Forecasting
- 5.3.3 Soil Monitoring and Soil Health Analytics
- 5.3.4 Weather Tracking and Forecasting
- 5.3.5 Precision Spraying and Input Optimization
- 5.3.6 Drone Analytics
- 5.3.7 Livestock Health Tracking
- 5.4 By Farm Size
- 5.4.1 Small-Scale Farms (Less Than 100 ha)
- 5.4.2 Medium-Scale Farms (100 - 500 ha)
- 5.4.3 Large-Scale Farms (More Than 500 ha)
- 5.5 By Geography
- 5.5.1 North America
- 5.5.1.1 United States
- 5.5.1.2 Canada
- 5.5.1.3 Mexico
- 5.5.1.4 Rest of North America
- 5.5.2 Europe
- 5.5.2.1 Germany
- 5.5.2.2 United Kingdom
- 5.5.2.3 France
- 5.5.2.4 Italy
- 5.5.2.5 Spain
- 5.5.2.6 Russia
- 5.5.2.7 Rest of Europe
- 5.5.3 Asia-Pacific
- 5.5.3.1 China
- 5.5.3.2 India
- 5.5.3.3 Japan
- 5.5.3.4 Australia
- 5.5.3.5 South Korea
- 5.5.3.6 Rest of Asia-Pacific
- 5.5.4 South America
- 5.5.4.1 Brazil
- 5.5.4.2 Argentina
- 5.5.4.3 Rest of South America
- 5.5.5 Middle East
- 5.5.5.1 Saudi Arabia
- 5.5.5.2 United Arab Emirates
- 5.5.5.3 Turkey
- 5.5.5.4 Rest of Middle East
- 5.5.6 Africa
- 5.5.6.1 South Africa
- 5.5.6.2 Egypt
- 5.5.6.3 Rest of Africa
- 5.5.1 North America
6 Competitive Landscape
- 6.1 Market Concentration
- 6.2 Strategic Moves
- 6.3 Market Share Analysis
- 6.4 Company Profiles (Includes Global-level Overview, Market-level Overview, Core Segments, Financials as Available, Strategic Information, Market Rank/Share for Key Companies, Products and Services, and Recent Developments)
- 6.4.1 Deere & Company
- 6.4.2 CNH Industrial N.V.
- 6.4.3 Bayer AG
- 6.4.4 AGCO Corporation
- 6.4.5 Syngenta Group
- 6.4.6 International Business Machines Corporation
- 6.4.7 Microsoft Corporation
- 6.4.8 Hexagon AB
- 6.4.9 KUBOTA Corporation
- 6.4.10 Topcon Corporation
- 6.4.11 SZ DJI Technology Co., Ltd.
- 6.4.12 Planet Labs PBC
- 6.4.13 Farmers Edge Inc.
- 6.4.14 AeroVironment Inc.
- 6.4.15 Traction Ag
7 Market Opportunities and Future Outlook

 數位畜牧場管理市場預測至2034年-全球分析(按組成部分、畜牧類型、技術、應用、最終用戶和地區分類)
 數位農業市場:全球市場預測,2026-2032年作物巡查技術市場預測至2034年-按解決方案類型、監測類型、技術、應用、最終用戶和地區分類的全球分析數位農業平台市場預測至2034年—按平台類型、組件、技術、應用、最終用戶和地區分類的全球分析數位雙胞胎農業系統市場預測至2034年-按農場類型、資料來源、定價模式、應用、最終用戶和地區分類的全球分析
 農業領域AR市場報告:按解決方案、應用和地區分類(2026-2034年)
 碳農業平台市場:分析與預測(至2035年)-按類型、產品類型、服務、技術、應用、流程、部署和最終用戶分類
 2026年全球數位農業軟體市場報告2026年全球智慧噴霧技術市場報告智慧噴霧器市場:依技術、作物、運作模式和應用分類-2026-2032年全球市場預測