


 |
市場調查報告書
商品編碼
2116035
網路效能:市場佔有率分析、產業趨勢和統計數據、成長預測(2026-2031)Web Performance - Market Share Analysis, Industry Trends & Statistics, Growth Forecasts (2026 - 2031) |
||||||

※ 本網頁內容可能與最新版本有所差異。詳細情況請與我們聯繫。
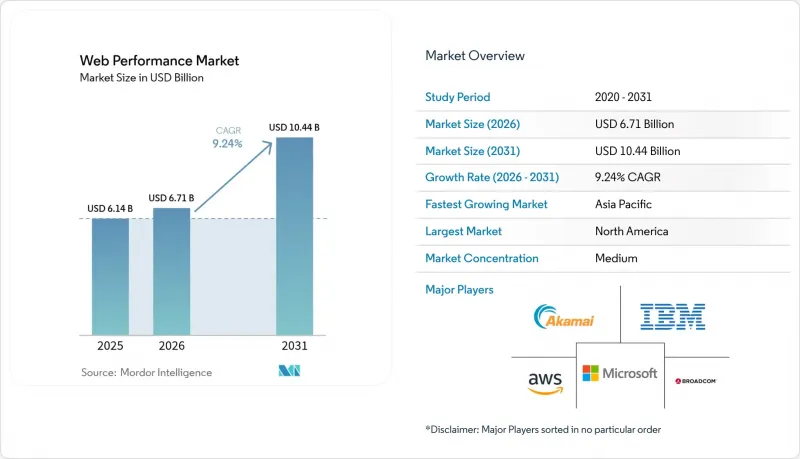
根據 Mordor Intelligence 估計,網路效能市場在 2026 年的價值將達到 67.1 億美元,高於 2025 年的 61.4 億美元,預計到 2031 年將達到 104.4 億美元。
預計 2026 年至 2031 年的複合年成長率為 9.24%。
本報告按元件(軟體和服務)、部署模式(本地部署和雲端部署)、監控類型(合成監控、真實用戶監控 (RUM)、數位體驗/DEM 平台)、組織規模(大型企業和中小企業 (SME))、最終用戶行業(銀行、金融服務和保險 (BFSI)、IT 和電信、零售和電子商務等)以及地區進行分類。
全球網路效能市場趨勢與洞察
電子商務流量激增和富媒體的普及。
在購物高峰期,流量激增會使基礎設施不堪重負,從而暴露潛在的性能缺陷。儘管2024年黑色星期五全球線上銷售額成長了8.5%,但由於頁面載入時間超過了延遲預算,許多零售商的轉換率卻有所下降。受3D產品檢視器和高解析度圖片在產品銷售中普及的推動,2024年平均頁面大小增加了35%。 Farfetch的一項研究發現,最大內容繪製(LCP)延遲每增加100毫秒,轉換率就會下降1.3%,而縮短可互動時間(TTI)則能將轉換率提高2.8%。這種對收入影響的量化,使得績效指標不再只是技術維護任務,而是成為影響損益的關鍵因素。因此,虛擬等候室、流量整形和自動擴展等技術正在被應用,同時還輔以精細化的監控,以評估高負載下的用戶體驗,而不僅僅是簡單的正常運作。
來自核心網路指標演算法的壓力
2024年3月,Google以“交互到下次繪製時間 (INP)”取代了“首次輸入延遲”,要求網站將最壞情況下的互動延遲控制在200毫秒以下,以保持排名競爭力。這項指標的廣泛性要求衡量用戶在不同旅程中的真實互動,迫使企業從基礎的合成測試升級到整合真實用戶監控 (RUM)、追蹤和分析功能的平台。 Safari 和 Firefox 在 2025 年對 INP 和 LCP 的支援將消除 Chrome 的偏差,並揭示先前被跨瀏覽器平均值掩蓋的響應速度差異。銀行和保險公司正在迅速做出反應,因為使用者體驗評分直接影響客戶獲取成本。主動模擬網路緩慢環境的合成測試不再是可選項,而是作為一項合規工具累計。
企業級平台定價
隨著基於資料擷取的定價模式取代基於主機的授權模式,與可觀測性相關的成本可能占到雲端支出的 15% 到 20%。中小企業不願意簽訂捆綁了他們可能不需要的 AI 和安全模組的最低使用量合約。雖然 OpenTelemetry 管道可以緩解供應商鎖定問題,但授權成本的節省將被本地維護的需求所抵消。隨著供應商整合進一步集中了定價權,買家正在協商資料層級上限並實施抽樣,以保持成本的可預測性。隨著企業將遙測粒度與業務價值相匹配,社群託管的資料收集器和分層保留策略正逐漸成為 FinOps 工具包的一部分。
細分市場分析
預計到2025年,網路效能市場中軟體部分將佔64.80%,凸顯了企業傾向於使用整合工具鏈的趨勢,這些工具鏈將合成效能分析、遠端監控管理(RUM)和追蹤功能整合到一個統一的主機中。同時,服務部分正以10.52%的複合年成長率成長,因為面臨人才短缺的企業擴大將配置、告警調整和儀錶板維護等工作外包。這種趨勢的分化表明,買家越來越傾向於將工具和專業知識視為互補而非可替代的。
向雲端遷移暴露了容器編排管理、邊緣分析和資料管道管治的技能缺口,加速了託管服務的需求。將全天候SRE支援與最佳化方案相結合的供應商,正在將諮詢服務打包出售,以最大限度地提高平台投資回報率。因此,軟體供應商正在內部整合諮詢部門,同時引入無程式碼上線嚮導和AI驅動的設定功能,這預示著一種融合趨勢將重新定義整個Web效能市場的價值提案。
到 2025 年,由於受監管行業繼續將遙測數據保存在國內資料中心附近,本地部署環境仍將佔據 67.30% 的網路效能市場佔有率。然而,受功能快速交付和營運成本 (OPEX)柔軟性的推動,雲端採用率正以 10.84% 的複合年成長率 (CAGR) 迅速成長。混合拓撲結構將敏感的本地工作負載與雲端分析相結合,利用機器學習提取洞察,同時遵守資料居住法規。
邊緣運算正在進一步加速這一趨勢。在本地興趣點 (POP) 收集的遙測資料流入雲端人工智慧引擎,可在數秒內對異常情況進行分類。因此,金融服務和遊戲公司正在試行「隨時隨地監控」架構,其中資料採集器可隨工作負載移動。隨著供應商藍圖強調資料平面無縫可移植性,而非本地部署和 SaaS 之間僵化的二元對立,混合監控平台的網路效能市場規模預計將會擴大。
區域分析
北美地區預計在2025年將佔全球收入的38.90%,這得益於其成熟的雲端基礎設施、對人工智慧主導的可觀測性的早期應用,以及要求提供運作和響應能力證明的嚴格合規框架。美國金融機構正在將延遲容忍度納入其客戶體驗OKR,而加拿大醫療保健入口網站正在將RUM整合到患者入口網站中,以監控遠端醫療的品質。墨西哥的製造工廠也開始在其OT和IT融合架構中採用指標,這表明全部區域正在廣泛採用這些指標。 SRE人才的長期短缺構成了一項實際風險,但由創業投資資金推動的持續工具創新正在推動該地區的發展。
亞太地區是成長最快的地區,預計到2031年將實現9.63%的複合年成長率,這主要得益於行動優先的消費行為、資料中心的大規模投資以及政府的數位化項目。中國電商巨頭在「雙十一」購物節期間追蹤每個網路跳轉,以確保超快速支付;印度IT外包公司則為全球客戶部署多租戶儀錶板。日本和韓國正利用5G技術率先實現低延遲可觀測性,而澳洲則透過混合雲端彌合洲際距離。亞太地區的網路效能市場規模受益於本地供應商的存在,他們提供語言和合規性客製化的解決方案,與全球平台相輔相成。
在歐洲,穩定成長的動能得益於GDPR的實施和永續發展指令。德國製造商正在將性能數據整合到工業4.0儀錶板中,以預測生產停機時間;英國銀行則利用INP評分來評估其數位化分店。法國正專注於航太領域的遙測技術,因為毫秒級的延遲會對整個供應鏈產生連鎖反應。歐盟新興的數位主權政策正在推動區域內雲端節點和確保資料處理在區域內進行的平台的採購。中東和非洲地區雖然發展落後,但隨著阿拉伯聯合大公國智慧城市計畫和南非金融科技部署對可靠、低延遲數位服務的需求日益成長,這些地區正在迎頭趕上。
其他好處:
- Excel格式的市場預測(ME)表
- 3個月的分析師支持
目錄
第1章:引言
- 研究假設和市場定義
- 調查範圍
第2章:調查方法
第3章執行摘要
第4章 市場狀況
- 市場概覽
- 市場促進因素
- 電子商務流量激增和富媒體的普及。
- 核心網路指標演算法施加的壓力
- 向雲端原生架構遷移
- 對行動優先用戶體驗的期望
- 邊緣運算和無伺服器部署可實現低於 1 秒的延遲。
- 與永續發展掛鉤的財務營運績效預算
- 市場限制因素
- 企業平台定價
- 整合舊有系統的複雜性
- 由於瀏覽器的隱私保護功能,RUM 資料受到限制。
- 缺乏可觀測性/SRE人員短缺
- 價值鏈分析
- 監理情勢
- 技術展望
- 波特五力分析
- 評估宏觀經濟趨勢對市場的影響
第5章 市場規模與成長預測
- 按組件
- 軟體
- 服務
- 依部署類型
- 現場
- 雲
- 按監測類型
- 合成監測
- 真實使用者監控(RUM)
- 數位體驗/DEM平台
- 按組織規模
- 大公司
- 中小企業
- 按最終用戶行業分類
- BFSI
- 資訊科技/通訊
- 零售與電子商務
- 車
- 政府
- 其他終端用戶產業
- 地區
- 北美洲
- 美國
- 加拿大
- 墨西哥
- 歐洲
- 德國
- 英國
- 法國
- 義大利
- 西班牙
- 俄羅斯
- 其他歐洲國家
- 亞太地區
- 中國
- 日本
- 印度
- 韓國
- 澳洲和紐西蘭
- 其他亞太國家
- 南美洲
- 巴西
- 阿根廷
- 其他南美國家
- 中東和非洲
- 中東
- 沙烏地阿拉伯
- 阿拉伯聯合大公國
- 土耳其
- 其他中東國家
- 非洲
- 南非
- 奈及利亞
- 其他非洲國家
- 中東
- 北美洲
第6章 競爭情勢
- 市場集中度
- 策略趨勢
- 市佔率分析
- 公司簡介
- Akamai Technologies
- Dynatrace
- Cloudflare
- IBM
- F5
- Radware
- SolarWinds(Pingdom)
- New Relic
- Datadog
- Catchpoint
- ThousandEyes(Cisco)
- CDNetworks
- Netmagic(NTT)
- Fastly
- Broadcom(AppNeta)
- Site24x7(Zoho)
- Uptrends
- Splunk
- Amazon CloudWatch
- Microsoft Azure Monitor
第7章 市場機會與未來展望
According to Mordor Intelligence, web performance market size in 2026 is estimated at USD 6.71 billion, growing from 2025 value of USD 6.14 billion with 2031 projections showing USD 10.44 billion, growing at 9.24% CAGR over 2026-2031.
This report is Segmented by Component (Software and Services), Deployment Type (On-Premises and Cloud), Monitoring Type (Synthetic Monitoring, Real-User Monitoring (RUM), and Digital Experience / DEM Platforms), Organization Size (Large Enterprises and Small and Medium Enterprises (SMEs)), End-User Industry (BFSI, IT and Telecom, Retail and E-Commerce, and More), and Geography.
Global Web Performance Market Trends and Insights
E-commerce Traffic Spike and Rich-Media Adoption
Peak shopping days now saturate infrastructure with traffic surges that reveal latent performance defects. During Black Friday 2024, global online revenue increased 8.5% yet many retailers saw conversion dips when page loads exceeded latency budgets. Average page weight climbed 35% in 2024 as 3D product viewers and high-resolution imagery became baseline merchandising tools. Farfetch observed that each 100 ms of Largest Contentful Paint delay suppressed conversion by 1.3%, whereas cutting Time to Interactive lifted conversions 2.8%. Such quantified revenue impact converts performance from a technical hygiene task into a PandL lever. Consequently, virtual waiting rooms, traffic shaping, and auto-scaling are deployed alongside granular monitoring that grades user experience under stress rather than simple uptime.
Core Web Vitals Algorithm Pressure
Google replaced First Input Delay with Interaction to Next Paint (INP) in March 2024, obliging sites to keep worst-case interaction latency below 200 ms to remain competitive in rankings. The metric's breadth forces instrumentation of real user interactions across varied journeys, prompting enterprises to upgrade from basic synthetics to platforms that stitch RUM, traces, and analytics. Safari and Firefox's 2025 support of INP and LCP will end the Chrome bias, exposing responsiveness gaps previously hidden in cross-browser averages. Banks and insurers have reacted swiftly because UX scores link directly to customer acquisition cost. Proactive synthetics that model slow-network scenarios are now budgeted as compliance tools rather than optional optimizations.
Enterprise-Grade Platform Pricing
Observability bills can devour 15-20% of cloud spend once data-ingestion pricing models replace per-host licenses. SMEs hesitate to commit to minimum volumes bundled with AI and security modules they may not need. Although OpenTelemetry pipelines reduce lock-in, DIY maintenance offsets licensing savings. Vendor consolidation further concentrates pricing power, prompting buyers to negotiate data-tier caps and adopt sampling to keep costs predictable. Community-hosted collectors and tiered retention policies are now part of FinOps toolkits as organizations align telemetry granularity with business value.
Other drivers and restraints analyzed in the detailed report include:
- Migration to Cloud-Native Architectures
- Mobile-First User Experience Expectations
- Legacy System Integration Complexity
For complete list of drivers and restraints, kindly check the Table Of Contents.
Segment Analysis
The software segment accounted for 64.80% of the web performance market in 2025, underscoring enterprises' preference for integrated toolchains that unify synthetics, RUM, and tracing into a single console. Services, however, are growing at a 10.52% CAGR as organizations outsource configuration, alert tuning, and dashboard maintenance in the face of talent shortages. This divergence illustrates how buyers increasingly view tooling and expertise as complementary rather than substitutable.
Demand for managed services accelerated when cloud migrations exposed skill gaps in container orchestration, edge analytics, and data pipeline governance. Providers offering 24X7 SRE coverage paired with optimization playbooks now bundle advisory engagements to maximize platform ROI. As a result, software vendors embed no-code onboarding wizards and AI-guided setup while simultaneously in-housing consulting arms, signaling a convergence that redefines value propositions across the web performance market.
On-premises instances retained 67.30% of web performance market share in 2025 because regulated industries keep telemetry close to sovereign data centers. Yet cloud deployments are scaling at an 10.84% CAGR, driven by feature velocity and OPEX flexibility. Hybrid topologies marry sensitive on-prem workloads with cloud analytics to comply with data-residency laws while unlocking machine-learning-powered insights.
Edge computing compounds this trend: telemetry captured at regional POPs flows into cloud AI engines that classify anomalies in seconds. Financial services and gaming companies thus pilot "observe-anywhere" architectures in which collectors migrate alongside workloads. The web performance market size for hybrid monitoring platforms is forecast to widen as vendor roadmaps emphasize seamless data plane portability rather than rigid dichotomies between on-prem and SaaS.
Complete Report Scope:
- By Component
- Software
- Services
- By Deployment Type
- On-premises
- Cloud
- By Monitoring Type
- Synthetic Monitoring
- Real-User Monitoring (RUM)
- Digital Experience / DEM Platforms
- By Organization Size
- Large Enterprises
- Small and Medium Enterprises (SMEs)
- By End-User Industry
- BFSI
- IT and Telecom
- Retail and E-commerce
- Automotive
- Government
- Other End-user Industries
- Geography
- North America
- United States
- Canada
- Mexico
- Europe
- Germany
- United Kingdom
- France
- Italy
- Spain
- Russia
- Rest of Europe
- Asia-Pacific
- China
- Japan
- India
- South Korea
- Australia and New Zealand
- Rest of Asia-Pacific
- South America
- Brazil
- Argentina
- Rest of South America
- Middle East and Africa
- Middle East
- Saudi Arabia
- United Arab Emirates
- Turkey
- Rest of Middle East
- Africa
- South Africa
- Nigeria
- Rest of Africa
- Middle East
- North America
Geography Analysis
North America captured 38.90% of 2025 revenue thanks to mature cloud infrastructure, early AI-driven observability adoption, and stringent compliance frameworks that mandate proof of uptime and responsiveness. United States financial institutions integrate latency budgets into customer-experience OKRs, while Canadian healthcare portals embed RUM in patient portals to monitor telemedicine quality. Mexico's manufacturing plants are beginning to instrument OT and IT convergence stacks, signaling wider regional uptake. Persistent SRE talent shortages pose execution risks, yet venture funding spurs continuous tooling innovation that sustains regional momentum.
Asia-Pacific is the fastest-growing territory with a 9.63% CAGR to 2031, propelled by mobile-first consumer behavior, large-scale data-center investments, and government digitalization programs. Chinese e-commerce giants trace every edge hop to maintain lightning-fast checkouts during Singles' Day, whereas Indian IT outsourcers deploy multi-tenant dashboards for global clients. Japan and South Korea pioneer 5G-enabled low-latency observability, while Australia leverages hybrid cloud to bridge continental distances. The web performance market size in APAC benefits from local vendors offering language and compliance-aligned solutions that complement global platforms.
Europe registers steady expansion anchored in GDPR enforcement and sustainability directives. German manufacturers embed performance data in Industry 4.0 dashboards to predict production downtimes, and UK banks tie INP scores to digital branch ratings. France focuses on aerospace telemetry where millisecond delays ripple through supply chains. Emerging EU digital sovereignty policies foster regional cloud nodes, shaping procurement toward platforms that guarantee in-region data processing. The Middle East and Africa trail but accelerate as UAE smart-city projects and South African fintech rollouts demand reliable, low-latency digital services.
- Akamai Technologies
- Dynatrace
- Cloudflare
- IBM
- F5
- Radware
- SolarWinds (Pingdom)
- New Relic
- Datadog
- Catchpoint
- ThousandEyes (Cisco)
- CDNetworks
- Netmagic (NTT)
- Fastly
- Broadcom (AppNeta)
- Site24x7 (Zoho)
- Uptrends
- Splunk
- Amazon CloudWatch
- Microsoft Azure Monitor
Additional Benefits:
- The market estimate (ME) sheet in Excel format
- 3 months of analyst support
TABLE OF CONTENTS
1 INTRODUCTION
- 1.1 Study Assumptions and Market Definition
- 1.2 Scope of the Study
2 RESEARCH METHODOLOGY
3 EXECUTIVE SUMMARY
4 MARKET LANDSCAPE
- 4.1 Market Overview
- 4.2 Market Drivers
- 4.2.1 E-commerce traffic spike and rich-media adoption
- 4.2.2 Core Web Vitals algorithm pressure
- 4.2.3 Migration to cloud-native architectures
- 4.2.4 Mobile-first user experience expectations
- 4.2.5 Edge and serverless rollout for sub-second latency
- 4.2.6 Sustainability-linked FinOps performance budgets
- 4.3 Market Restraints
- 4.3.1 Enterprise-grade platform pricing
- 4.3.2 Legacy system integration complexity
- 4.3.3 Browser privacy curbs limiting RUM data
- 4.3.4 Shortage of observability / SRE talent
- 4.4 Value Chain Analysis
- 4.5 Regulatory Landscape
- 4.6 Technological Outlook
- 4.7 Porter's Five Forces Analysis
- 4.7.1 Bargaining Power of Suppliers
- 4.7.2 Bargaining Power of Buyers
- 4.7.3 Threat of New Entrants
- 4.7.4 Threat of Substitutes
- 4.7.5 Intensity of Competitive Rivalry
- 4.8 Assessment of the Impact of Macroeconomic Trends on the Market
5 MARKET SIZE AND GROWTH FORECASTS (VALUE)
- 5.1 By Component
- 5.1.1 Software
- 5.1.2 Services
- 5.2 By Deployment Type
- 5.2.1 On-premises
- 5.2.2 Cloud
- 5.3 By Monitoring Type
- 5.3.1 Synthetic Monitoring
- 5.3.2 Real-User Monitoring (RUM)
- 5.3.3 Digital Experience / DEM Platforms
- 5.4 By Organization Size
- 5.4.1 Large Enterprises
- 5.4.2 Small and Medium Enterprises (SMEs)
- 5.5 By End-User Industry
- 5.5.1 BFSI
- 5.5.2 IT and Telecom
- 5.5.3 Retail and E-commerce
- 5.5.4 Automotive
- 5.5.5 Government
- 5.5.6 Other End-user Industries
- 5.6 Geography
- 5.6.1 North America
- 5.6.1.1 United States
- 5.6.1.2 Canada
- 5.6.1.3 Mexico
- 5.6.2 Europe
- 5.6.2.1 Germany
- 5.6.2.2 United Kingdom
- 5.6.2.3 France
- 5.6.2.4 Italy
- 5.6.2.5 Spain
- 5.6.2.6 Russia
- 5.6.2.7 Rest of Europe
- 5.6.3 Asia-Pacific
- 5.6.3.1 China
- 5.6.3.2 Japan
- 5.6.3.3 India
- 5.6.3.4 South Korea
- 5.6.3.5 Australia and New Zealand
- 5.6.3.6 Rest of Asia-Pacific
- 5.6.4 South America
- 5.6.4.1 Brazil
- 5.6.4.2 Argentina
- 5.6.4.3 Rest of South America
- 5.6.5 Middle East and Africa
- 5.6.5.1 Middle East
- 5.6.5.1.1 Saudi Arabia
- 5.6.5.1.2 United Arab Emirates
- 5.6.5.1.3 Turkey
- 5.6.5.1.4 Rest of Middle East
- 5.6.5.2 Africa
- 5.6.5.2.1 South Africa
- 5.6.5.2.2 Nigeria
- 5.6.5.2.3 Rest of Africa
- 5.6.5.1 Middle East
- 5.6.1 North America
6 COMPETITIVE LANDSCAPE
- 6.1 Market Concentration
- 6.2 Strategic Moves
- 6.3 Market Share Analysis
- 6.4 Company Profiles (includes Global level Overview, Market level overview, Core Segments, Financials as available, Strategic Information, Market Rank/Share for key companies, Products and Services, and Recent Developments)
- 6.4.1 Akamai Technologies
- 6.4.2 Dynatrace
- 6.4.3 Cloudflare
- 6.4.4 IBM
- 6.4.5 F5
- 6.4.6 Radware
- 6.4.7 SolarWinds (Pingdom)
- 6.4.8 New Relic
- 6.4.9 Datadog
- 6.4.10 Catchpoint
- 6.4.11 ThousandEyes (Cisco)
- 6.4.12 CDNetworks
- 6.4.13 Netmagic (NTT)
- 6.4.14 Fastly
- 6.4.15 Broadcom (AppNeta)
- 6.4.16 Site24x7 (Zoho)
- 6.4.17 Uptrends
- 6.4.18 Splunk
- 6.4.19 Amazon CloudWatch
- 6.4.20 Microsoft Azure Monitor
7 MARKET OPPORTUNITIES AND FUTURE OUTLOOK
- 7.1 White-space and Unmet-need Assessment


