


 |
市場調查報告書
商品編碼
2115932
智慧網路:市場佔有率分析、產業趨勢與統計、成長預測(2026-2031)Intelligent Network - Market Share Analysis, Industry Trends & Statistics, Growth Forecasts (2026 - 2031) |
||||||

※ 本網頁內容可能與最新版本有所差異。詳細情況請與我們聯繫。
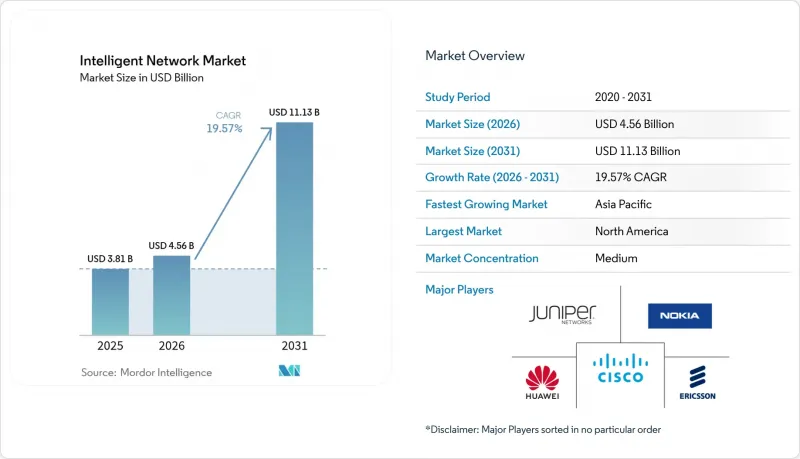
據 Mordor Intelligence 稱,2025 年智慧網路市場價值為 38.1 億美元,預計到 2031 年將達到 111.3 億美元,而 2026 年為 45.6 億美元,預測期(2026-2031 年)的複合年成長率為 19.57%。
本報告按元件(硬體、軟體、服務)、部署類型(本地部署、雲端/SaaS)、企業規模(中小企業、大型企業)、應用程式(網路分析、網路自動化和編配等)、最終用戶和地區進行細分。市場預測以價值(美元)表示。
全球智慧網路市場趨勢與洞察
5G和物聯網流量的激增正在推動基礎設施現代化。
新建成的5G網路正經歷著行動數據流量的爆炸性成長,預計到2025年,沿岸地區每部智慧型手機的平均數據使用量將達到30GB。因此,營運商正在部署智慧網路以即時重新分配容量。愛立信和AT&T的基於意圖的自動化項目清晰地展示了這一轉變,5G獨立組網(SA)核心網現在無需人工干預即可優先處理網路切片。此外,企業正在部署5G以實現智慧工廠和自動駕駛汽車,這為採用人工智慧編配的營運商創造了新的收入來源。
資料中心頻寬需求的激增正迫使網路架構重組。
像 Lumen Technologies 這樣的超大規模資料中心業者已獲得價值 50 億美元的 AI 連接契約,併計劃在未來五年內將城際光纖網路規模擴大一倍。 Arista 的 Etherlink AI 骨幹網路支援 460 Tbps 的傳輸速率,可支援超過 10 萬個節點的 XPU叢集。為了應對訓練負載,營運商正在從 400 G 光模組升級到 800 G 甚至 1.6 T光學模組,並採用可捲繞帶狀光纖來提高管道容量。
缺乏人工智慧網路相關技能限制了部署。
對精通人工智慧框架和路由協議的工程師的需求日益成長,推高了工資水平,並延長了專案週期。託管服務和無程式碼自動化在一定程度上緩解了這種缺口,但並未完全消除。
細分市場分析
基於軟體的自動化仍將是智慧網路市場的基石,預計到2025年將佔銷售額的41.35%。供應商正以模組化服務的形式提供閉合迴路編配、異常檢測和容量預測,以縮短平均修復時間(MTTR)。硬體對於高性能路由仍然至關重要,但隨著白盒產品的興起,價格壓力日益增大。專業服務成長最快,複合年成長率(CAGR)達23.3%,涵蓋設計、多廠商整合和持續最佳化。預計到2031年,專業服務對智慧網路市場規模的貢獻將穩定成長,反映出買家對專業知識的需求。
在本十年後半期,以平台為中心的模式將進一步推動收入結構轉向訂閱模式。思科近期報告稱,收購完成後,其安全軟體銷售額成長了100%,顯示老牌公司可以如何轉型業務。像NextHop AI這樣的新創公司則專注於傳統設備無法應對的超大規模應用場景,為電信業者提供多樣化的採購選擇。
預計到2025年,雲端/SaaS模式將佔據智慧網路市場54.25%的佔有率,年複合成長率達27.1%,這主要得益於企業將編配、分析和策略等功能作為承包服務加以利用。這種靈活的使用模式能夠應對人工智慧流量的不可預測激增,並繞過資本支出障礙。混合模式在具有主權要求的企業中越來越受歡迎,這些企業將關鍵控制平面保留在本地。這種務實的組合使用戶能夠在利用雲端可擴展性的同時,保持合規性。在部署耗時且需要超低延遲的工業環境中,本地部署仍然至關重要。
先進的SaaS服務能夠自主更新,從而緩解技能差距,並加快新功能的採用速度。供應商可以將AIOps整合到其服務層,產生預測性洞察,並將支援工單數量減少高達50%。因此,預計在預測期內,傳統永久授權設備在智慧網路市場的佔有率將逐年下降。
區域分析
預計到2025年,北美將佔全球營收的36.65%,這主要得益於超大規模資料中心業者資料中心營運商的資本支出(CAPEX)以及對人工智慧編配的早期應用。 Lumen價值50億美元的人工智慧網路合約儲備凸顯了這項持續的投資。然而,隨著市場滲透率的提高和競爭的加劇,該地區預計17.1%的複合年成長率低於全球平均水平。
亞太地區預計將成為未來成長的主要驅動力,年複合成長率將達到23.5%。中國的國家人工智慧戰略和大規模5G部署正在支撐這項需求。新加坡和阿拉伯聯合大公國正在建造國家級人工智慧中心,這些中心需要極其安全、低延遲的連接。預計到2030年,該地區的行動網路普及率將達到50%,新增用戶將達到7.51億,因此,人工智慧主導的容量擴展至關重要。中國移動的Terabit特級光纖骨幹網路等重點項目,體現了中國對下一代基礎設施的堅定承諾。
歐洲在維持適度成長的同時,也引領永續性法規的主導。 EE的「單元睡眠」舉措顯著降低了能耗,展現了環境法規如何促進智慧架構的建構。西班牙電信(Telefónica)在其覆蓋歐盟的網路中實現L4級自動駕駛的項目,堪稱卓越營運的典範。然而,嚴格的資料主權法律使得跨境服務交付複雜化,並延緩了某些跨區域服務的部署。
其他好處:
- Excel格式的市場預測(ME)表
- 3個月的分析師支持
目錄
第1章:引言
- 研究假設和市場定義
- 調查範圍
第2章:調查方法
第3章執行摘要
第4章 市場狀況
- 市場概覽
- 市場促進因素
- 5G 和物聯網流量激增
- 資料中心頻寬需求激增
- 透過雲端服務供應商 (CSP) 實現雲端原生核心遷移
- 面向電信業者的AI工廠,用於自主AI工作負載
- 網路能源效率強制措施(範圍 3)
- 透過開放API獲利(網路即程式碼)
- 市場限制因素
- 缺乏人工智慧網路相關技能
- 與舊有系統整合相關的複雜性
- AI加速器的能耗推高了營運成本。
- 關於資料主權和跨境資料流動的法規
- 價值供應鏈分析
- 監理情勢
- 技術展望
- 波特五力分析
第5章:技術概述
第6章 市場規模與成長預測
- 按組件
- 硬體
- 軟體
- 服務
- 部署模式
- 現場
- 雲/SaaS
- 按公司規模
- 小型企業
- 大公司
- 透過使用
- 網路分析
- 網路自動化與編配
- 基於意圖的網路
- 交通管理與政策
- 自最佳化網路(SON)
- 最終用戶
- 電信服務供應商
- 雲端/超大規模供應商
- 託管網路服務供應商
- 按公司和行業
- 按地區
- 北美洲
- 美國
- 加拿大
- 墨西哥
- 南美洲
- 巴西
- 阿根廷
- 其他南美國家
- 歐洲
- 義大利
- 英國
- 德國
- 法國
- 其他歐洲國家
- 亞太地區
- 印度
- 中國
- 日本
- 其他亞太國家
- 中東和非洲
- 中東
- 以色列
- 沙烏地阿拉伯
- 阿拉伯聯合大公國
- 其他中東國家
- 非洲
- 南非
- 奈及利亞
- 肯亞
- 其他非洲國家
- 中東
- 北美洲
第7章 競爭情勢
- 市場集中度
- 策略趨勢
- 市佔率分析
- 公司簡介
- Cisco Systems, Inc.
- Huawei Technologies Co., Ltd.
- Telefonaktiebolaget LM Ericsson
- Nokia Corporation
- Juniper Networks, Inc.
- Hewlett Packard Enterprise Company
- Dell Technologies Inc.
- Ciena Corporation
- IBM Corporation
- Lumen Technologies, Inc.
- Tech Mahindra Limited
- Arista Networks, Inc.
- Ribbon Communications Inc.
- Sandvine Incorporated ULC
- Aria Networks Ltd.
- Colt Technology Services Group Ltd.
第8章 市場機會與未來展望
- 評估未開發的領域和未滿足的需求
According to Mordor Intelligence, the intelligent network market size was valued at USD 3.81 billion in 2025 and estimated to grow from USD 4.56 billion in 2026 to reach USD 11.13 billion by 2031, at a CAGR of 19.57% during the forecast period (2026-2031).
This report is Segmented by Component (Hardware, Software and Services), Deployment Mode (On-Premises, Cloud / SaaS), Enterprise Size (Small and Medium-Sized Enterprises, Large Enterprises), Application (Network Analytics, Network Automation and Orchestration and More), End-User and Geography. The Market Forecasts are Provided in Terms of Value (USD).
Global Intelligent Network Market Trends and Insights
5G and IoT Traffic Surge Drives Infrastructure Modernization
Mobile data traffic is exploding on newly built 5G networks, with average use in the Gulf expected to hit 30 GB per smartphone in 2025. Operators therefore deploy intelligent networking that reallocates capacity in real time. Ericsson's intent-based automation project with ATandT illustrates the shift, as the 5G Standalone core now prioritizes slices without manual intervention. Enterprises are also adopting 5G to power smart factories and autonomous vehicles, creating new revenue paths for carriers that embrace AI orchestration.
Exponential Data-Center Bandwidth Demand Reshapes Network Architecture
Hyperscalers such as Lumen Technologies have secured USD 5 billion in AI connectivity contracts, doubling inter-city fiber over the next five years. Arista's Etherlink AI spine supports 460 Tbps, enabling XPU clusters beyond 100,000 nodes. To meet training loads, operators migrate from 400 G to 800 G and even 1.6 T optics while adopting rollable-ribbon fiber that boosts duct capacity.
Scarcity of AI-Networking Skill Sets Limits Rollouts
High demand for engineers fluent in AI frameworks and routing protocols is pushing wages up and elongating project timelines. Managed services and no-code automation mitigate the gap but only partially.
Other drivers and restraints analyzed in the detailed report include:
- CSP Pivot to Cloud-Native Cores Accelerates Automation
- Telco "AI Factories" Emerge for Sovereign AI Workloads
- Legacy Integration Complexity Slows Transformation
For complete list of drivers and restraints, kindly check the Table Of Contents.
Segment Analysis
Software automation captured 41.35% of revenue in 2025 and remains the anchor of the intelligent network market. Vendors deliver closed-loop orchestration, anomaly detection and capacity prediction as modular services that shorten mean-time-to-repair. Hardware retains relevance for high-performance routing, though price pressures intensify as white-box alternatives rise. Professional services grow fastest at 23.3% CAGR, covering design, multi-vendor integration and continuous optimization. Their contribution to the intelligent network market size is projected to climb steadily through 2031, reflecting buyers' need for specialized expertise.
In the second half of the decade, platform-centric models will shift revenue mix further toward subscriptions. Cisco reported 100% security-software growth after recent acquisitions, signalling how incumbents can pivot. Start-ups such as NextHop AI focus on hyperscale scenarios that traditional appliances cannot address, giving operators diversified sourcing options.
Cloud/SaaS models accounted for 54.25% of the intelligent network market in 2025 and will expand at 27.1% CAGR, as organizations consume orchestration, analytics and policy as turnkey services. Elastic consumption suits unpredictable AI traffic bursts and sidesteps capital budgeting hurdles. Hybrid models are gaining traction among firms with sovereignty mandates, keeping critical control planes on-premises. This pragmatic mix lets buyers leverage cloud scalability while maintaining compliance. On-premises deployments, although slower, still matter for ultra-low-latency industrial sites.
Advanced SaaS offerings also update autonomously, easing skills shortages while bringing new capabilities online faster. Vendors embed AIOps into service layers, generating predictive insights that reduce ticket volume by up to 50%. Consequently, the intelligent network market share for legacy perpetual-license appliances will likely shrink each year of the forecast period.
Complete Report Scope:
- By Component
- Hardware
- Software
- Services
- By Deployment Mode
- On-Premises
- Cloud / SaaS
- By Enterprise Size
- Small and Medium-sized Enterprises
- Large Enterprises
- By Application
- Network Analytics
- Network Automation and Orchestration
- Intent-based Networking
- Traffic Management and Policy
- Self-optimising Networks (SON)
- By End-user
- Telecom Service Providers
- Cloud / Hyperscale Providers
- Managed Network Service Providers
- Enterprises and Verticals
- By Geography
- North America
- United States
- Canada
- Mexico
- South America
- Brazil
- Argentina
- Rest of South America
- Europe
- Italy
- United Kingdom
- Germany
- France
- Rest of Europe
- Asia-Pacific
- India
- China
- Japan
- Rest of Asia-Pacific
- Middle East and Africa
- Middle East
- Israel
- Saudi Arabia
- United Arab Emirates
- Rest of Middle East
- Africa
- South Africa
- Nigeria
- Kenya
- Rest of Africa
- Middle East
- North America
Geography Analysis
North America commands 36.65% of 2025 revenue, fuelled by hyperscaler CAPEX and early adoption of AI orchestration. Lumen's USD 5 billion AI network contract pipeline highlights sustained investment. Yet the region's forecast 17.1% CAGR trails global averages as market penetration rises, and competitive intensity grows.
APAC is the engine of future expansion, posting 23.5% CAGR. China's national AI strategy and large-scale 5G rollouts underpin demand. Singapore and the UAE are creating sovereign AI hubs that require ultra-secure, low-latency connectivity. Regional mobile penetration will reach 50% by 2030, adding 751 million new subscribers and necessitating AI-driven capacity scaling. Major projects such as China Mobile's terabit optical backbone show commitment to next-generation infrastructure.
Europe maintains moderate growth while leading sustainability mandates. EE's cell-sleep initiative cut energy use materially, showcasing how green regulation encourages intelligent architectures. Telefonica's program to achieve level 4 autonomy across EU networks sets the template for operational excellence. However, strict data-sovereignty laws complicate cross-border service delivery, slowing certain pan-regional offerings.
- Cisco Systems, Inc.
- Huawei Technologies Co., Ltd.
- Telefonaktiebolaget LM Ericsson
- Nokia Corporation
- Juniper Networks, Inc.
- Hewlett Packard Enterprise Company
- Dell Technologies Inc.
- Ciena Corporation
- IBM Corporation
- Lumen Technologies, Inc.
- Tech Mahindra Limited
- Arista Networks, Inc.
- Ribbon Communications Inc.
- Sandvine Incorporated ULC
- Aria Networks Ltd.
- Colt Technology Services Group Ltd.
Additional Benefits:
- The market estimate (ME) sheet in Excel format
- 3 months of analyst support
TABLE OF CONTENTS
1 INTRODUCTION
- 1.1 Study Assumptions and Market Definition
- 1.2 Scope of the Study
2 RESEARCH METHODOLOGY
3 EXECUTIVE SUMMARY
4 MARKET LANDSCAPE
- 4.1 Market Overview
- 4.2 Market Drivers
- 4.2.1 5G and IoT traffic surge
- 4.2.2 Exponential data-center bandwidth demand
- 4.2.3 CSP pivot to cloud-native cores
- 4.2.4 Telco AI factoriesfor sovereign AI workloads
- 4.2.5 Energy-efficiency mandates (Scope-3) on networks
- 4.2.6 Open-API monetisation (Network-as-Code)
- 4.3 Market Restraints
- 4.3.1 Scarcity of AI-networking skill sets
- 4.3.2 Legacy integration complexity
- 4.3.3 Power-draw of AI accelerators inflating OPEX
- 4.3.4 Data-sovereignty and cross-border traffic rules
- 4.4 Value / Supply-Chain Analysis
- 4.5 Regulatory Landscape
- 4.6 Technological Outlook
- 4.7 Porter's Five Forces Analysis
- 4.7.1 Threat of New Entrants
- 4.7.2 Bargaining Power of Buyers
- 4.7.3 Bargaining Power of Suppliers
- 4.7.4 Threat of Substitutes
- 4.7.5 Competitive Rivalry
5 TECHNOLOGY SNAPSHOT
6 MARKET SIZE AND GROWTH FORECASTS (VALUE)
- 6.1 By Component
- 6.1.1 Hardware
- 6.1.2 Software
- 6.1.3 Services
- 6.2 By Deployment Mode
- 6.2.1 On-Premises
- 6.2.2 Cloud / SaaS
- 6.3 By Enterprise Size
- 6.3.1 Small and Medium-sized Enterprises
- 6.3.2 Large Enterprises
- 6.4 By Application
- 6.4.1 Network Analytics
- 6.4.2 Network Automation and Orchestration
- 6.4.3 Intent-based Networking
- 6.4.4 Traffic Management and Policy
- 6.4.5 Self-optimising Networks (SON)
- 6.5 By End-user
- 6.5.1 Telecom Service Providers
- 6.5.2 Cloud / Hyperscale Providers
- 6.5.3 Managed Network Service Providers
- 6.5.4 Enterprises and Verticals
- 6.6 By Geography
- 6.6.1 North America
- 6.6.1.1 United States
- 6.6.1.2 Canada
- 6.6.1.3 Mexico
- 6.6.2 South America
- 6.6.2.1 Brazil
- 6.6.2.2 Argentina
- 6.6.2.3 Rest of South America
- 6.6.3 Europe
- 6.6.3.1 Italy
- 6.6.3.2 United Kingdom
- 6.6.3.3 Germany
- 6.6.3.4 France
- 6.6.3.5 Rest of Europe
- 6.6.4 Asia-Pacific
- 6.6.4.1 India
- 6.6.4.2 China
- 6.6.4.3 Japan
- 6.6.4.4 Rest of Asia-Pacific
- 6.6.5 Middle East and Africa
- 6.6.5.1 Middle East
- 6.6.5.1.1 Israel
- 6.6.5.1.2 Saudi Arabia
- 6.6.5.1.3 United Arab Emirates
- 6.6.5.1.4 Rest of Middle East
- 6.6.5.2 Africa
- 6.6.5.2.1 South Africa
- 6.6.5.2.2 Nigeria
- 6.6.5.2.3 Kenya
- 6.6.5.2.4 Rest of Africa
- 6.6.5.1 Middle East
- 6.6.1 North America
7 COMPETITIVE LANDSCAPE
- 7.1 Market Concentration
- 7.2 Strategic Moves
- 7.3 Market Share Analysis
- 7.4 Company Profiles (includes Global level Overview, Market level overview, Core Segments, Financials as available, Strategic Information, Market Rank/Share for key companies, Products and Services, and Recent Developments)
- 7.4.1 Cisco Systems, Inc.
- 7.4.2 Huawei Technologies Co., Ltd.
- 7.4.3 Telefonaktiebolaget LM Ericsson
- 7.4.4 Nokia Corporation
- 7.4.5 Juniper Networks, Inc.
- 7.4.6 Hewlett Packard Enterprise Company
- 7.4.7 Dell Technologies Inc.
- 7.4.8 Ciena Corporation
- 7.4.9 IBM Corporation
- 7.4.10 Lumen Technologies, Inc.
- 7.4.11 Tech Mahindra Limited
- 7.4.12 Arista Networks, Inc.
- 7.4.13 Ribbon Communications Inc.
- 7.4.14 Sandvine Incorporated ULC
- 7.4.15 Aria Networks Ltd.
- 7.4.16 Colt Technology Services Group Ltd.
8 MARKET OPPORTUNITIES AND FUTURE OUTLOOK
- 8.1 White-space and Unmet-need Assessment


