


 |
市場調查報告書
商品編碼
2115925
停電管理系統:市場佔有率分析、產業趨勢與統計、成長預測(2026-2031 年)Outage Management Systems - Market Share Analysis, Industry Trends & Statistics, Growth Forecasts (2026 - 2031) |
||||||

※ 本網頁內容可能與最新版本有所差異。詳細情況請與我們聯繫。
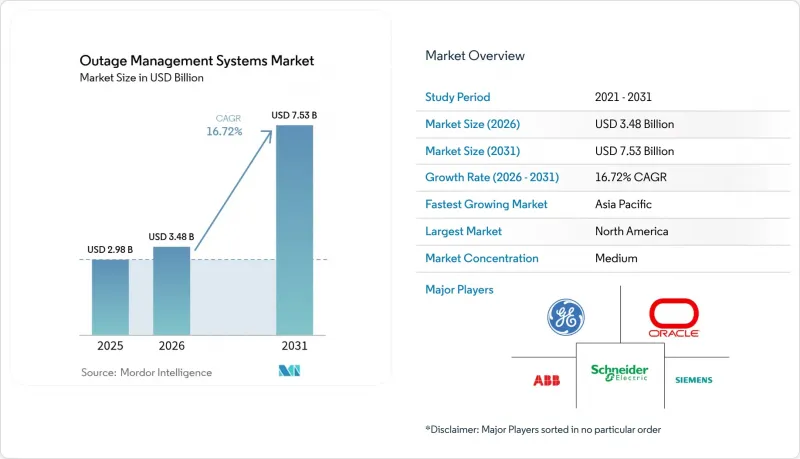
據 Mordor Intelligence 稱,2025 年電力中斷管理系統的市場規模估計為 29.8 億美元,預計到 2031 年將從 2026 年的 34.8 億美元成長到 75.3 億美元,在預測期(2026-2031 年)內的複合年成長率為 16.72%。
本報告按類型(獨立式、整合式)、元件(軟體、服務)、部署方式(本地部署、雲端部署)、應用程式(故障識別與隔離、維修與人員管理、客戶資訊與呼叫支援)以及地區(北美、歐洲、亞太、南美等)進行細分。市場規模和預測均以美元計價。
全球停電管理系統市場趨勢及洞察
氣候變遷導致停電情況日益惡化,促使人們增加投資,以增強電網的韌性。
目前,約80%的大規模停電是由天氣因素造成的,促使電力公司大力投資電網加固措施,例如自動分段系統、地下化和人工智慧驅動的植被分析。光是CenterPoint Energy一家公司就在五年內投入了210億美元用於增強其抵禦風暴的能力,這表明目前在預防性技術方面投入了大規模資金。運行管理系統(OMS)平台已從故障定位工具發展成為整合天氣資料、資產狀態資料和自動切換功能的綜合性韌性中心。鑑於持續數天的停電會對當地經濟造成數十億美元的損失,其經濟影響顯而易見,這進一步強化了預測性解決方案的投資報酬率(ROI)的合理性。電力公司也意識到,預防客戶供電中斷比僅僅加快恢復供電更能有效提高客戶滿意度,這正在加速OMS的升級。
主要電力公司引進智慧電網和ADMS
大型電力公司正以整合式 ADMS-OMS 套件取代各自獨立的應用程式,這些套件能夠即時處理 SCADA、GIS 和 AMI 資料。 GE Vernova 的 GridOS 和Schneider Electric的 One Digital Grid 平台便是這項轉變的例證,它們承諾透過自動故障隔離和分散式能源 (DER) 協調,將停電次數減少高達 40%。隨著雙向電力流動的增加,整合解決方案至關重要,這也解釋了其高昂的價格和快速普及的原因。為了滿足監管機構對網路安全架構的強烈需求,電力公司正擴大採用零信任安全技術。
高昂的資本投入和整合舊有系統的障礙
對於大規模的投資者擁有的公用事業公司而言,實施企業級營運管理系統 (OMS) 的成本通常超過 5,000 萬美元。整合缺乏現代 API 的、使用了數十年的 SCADA、GIS 和 CIS 資產會進一步增加成本,需要開發客製化中間件並進行耗時的資料遷移專案。由於現場工作人員需要適應自動化工作流程,組織變革管理也使部署變得更加複雜。監管審查依然嚴格,增加了實施風險,因為公用事業公司必須在整個系統遷移過程中保持可靠性指標。
細分市場分析
CAGR 指的是總能源成長率。已實施整合解決方案的公共產業報告稱,與使用分散系統的用戶相比,平均停電時間減少了 30-40%。
Oracle的「能源與水務資料智慧」解決方案正是這一趨勢的典型例證,它整合了運行遙測、氣象情報和客戶分析,實現了決策邏輯的自動化。因此,預計到 2031 年,由整合解決方案驅動的停電管理系統 (OMS) 市場規模將進一步擴大,領先於獨立部署方案。由此,擁有全面產品組合的供應商將獲得議價優勢,而專注於特定領域的解決方案供應商將擴大尋求夥伴關係和收購,以維持其市場地位。
到2025年,軟體將保持66.70%的市場佔有率,這主要得益於ABB、GE Vernova和Schneider Electric等公司成熟的程式碼庫。然而,隨著公共產業在訓練人工智慧模型、加強網路安全以及確保跨系統資料一致性方面需要指導,服務業正以18.02%的複合年成長率快速成長。公共產業業成長最為迅猛,因為公用事業公司面臨特定司法管轄區的信任法規和雲端主權法規。
此外,由於軟體採購僅佔專案總成本的三分之一左右,實施和支援領域也迅速擴張。向訂閱模式的轉變正在增強供應商的持續收入來源。Schneider Electric2024年的SaaS收入成長了140%,顯示電力公司願意將支出從資本支出(Capex)轉向營運支出(OpEx)。因此,服務供應商對專案結果的影響力日益增強,推動停電管理系統市場朝向高生命週期價值經濟模式發展。
區域分析
預計到2025年,北美將佔停電管理系統市場收入的37.00%。這主要得益於聯邦政府提供的80億美元輸電津貼,以及一連串極端天氣事件迫使電力公司加強電網建設。投資人高度重視整合解決方案的採用,因為它能顯著提升SAIDI/SAIFI的效能。在加拿大,省級現代化建設正在推動區域發展。例如,新不倫瑞克能源公司(Energy NB Power)的AI驅動型停電預測程序,在2024年的冰暴期間,該程序在24小時內恢復了90%用戶的電力供應。
亞太地區正經歷最快成長,複合年成長率達19.18%。中國國家電網公司已為2024年的數位化變電站和特高壓輸電線路計畫累計超過6,000億元人民幣,這將推動大規模的營運製造服務(OMS)競標。日本決定投資超過1,500億日圓加強電網建設,以因應人工智慧主導資料中心的擴張。印度也擁有進一步成長的空間,日立能源累計200億盧比用於擴大其國內製造和數位化解決方案能力。
歐洲、拉丁美洲以及中東和非洲地區均呈現穩定成長態勢,儘管成長率較低。在拉丁美洲,根據智利2050年實現碳中和的藍圖,到2040年配電領域需要投入4,310億美元,這擴大了分散式能源系統(OMS)的潛在預算規模。歐洲電力公司正致力於整合分散式能源(DER)並增強抵禦風暴的能力,但隨著輸電網現代化的成熟,收入成長速度正在放緩。在所有次要地區,政府政策支援和多邊氣候變遷融資機制在分散式能源系統的部署速度中發揮至關重要的作用。
其他好處:
- Excel格式的市場預測(ME)表
- 3個月的分析師支持
目錄
第1章:引言
- 市場分析與定義的前提條件
- 分析範圍
第2章 分析方法
第3章執行摘要
第4章 市場狀況
- 市場概覽
- 市場促進因素
- 氣候變遷導致停電次數不斷增加,促使人們增加對電網容錯能力的投資。
- 主要電力公司引進智慧電網和ADMS
- 可靠性指標(SAIDI/SAIFI)的合規性要求
- 引入人工智慧驅動的停電預測分析
- 隨著分散式能源資源(DER)的日益普及,即時視覺化變得至關重要。
- 遷移到雲端原生 OMS 和行動工作人員工具
- 市場限制因素
- 大型資本投資和舊有系統整合帶來的挑戰
- 互聯訂單管理系統中的網路安全漏洞
- GIS資料品質的差異正在損害演算法的功能。
- 人工智慧/機器學習分析領域熟練人才短缺
- 供應鏈分析
- 監理情勢
- 技術展望
- 波特五力分析
第5章:預測市場規模與成長率
- 按類型
- 獨立型
- 融合的
- 按組件
- 軟體
- 服務
- 透過部署方法
- 現場
- 雲
- 透過使用
- 識別並隔離故障部件
- 維修/工人管理
- 客戶資訊和電話支持
- 按地區
- 北美洲
- 美國
- 加拿大
- 墨西哥
- 歐洲
- 德國
- 英國
- 法國
- 義大利
- 北歐國家
- 俄羅斯
- 其他歐洲國家
- 亞太地區
- 中國
- 印度
- 日本
- 韓國
- 東南亞國協
- 其他亞太國家
- 南美洲
- 巴西
- 阿根廷
- 其他南美國家
- 中東和非洲
- 沙烏地阿拉伯
- 阿拉伯聯合大公國
- 南非
- 其他中東和非洲國家
- 北美洲
第6章 競爭情勢
- 市場集中度
- 策略趨勢(併購、聯盟、購電協議)
- 市場佔有率分析(主要公司的市場排名和佔有率)
- 公司簡介
- ABB Ltd.
- General Electric Co.
- Oracle Corp.
- Schneider Electric SE
- Siemens AG
- Hitachi Energy(OMS)
- Hexagon(Intergraph)
- CGI Inc.
- Advanced Control Systems(Indra/Minsait ACS)
- Futura Systems Inc.
- ETAP Automation
- Survalent Technology
- Landis+Gyr Group
- Milsoft Utility Solutions
- Trimble Utilities
- OSIsoft(AVEVA)
- IBM Corp.
- Cisco Systems Inc.
- Fujitsu Ltd.
- S&C Electric Co.
- Itron Inc.
第7章 市場機會與未來展望
According to Mordor Intelligence, the outage management systems market size was valued at USD 2.98 billion in 2025 and estimated to grow from USD 3.48 billion in 2026 to reach USD 7.53 billion by 2031, at a CAGR of 16.72% during the forecast period (2026-2031).
This report is Segmented by Type (Stand-Alone and Integrated), Component (Software and Service), Deployment Mode (On-Premises and Cloud), Application (Fault Location and Isolation, Restoration and Crew Management, and Customer Information and Call Handling), and Geography (North America, Europe, Asia-Pacific, South America, and More). The Market Sizes and Forecasts are Provided in Terms of Value (USD)
Global Outage Management Systems Market Trends and Insights
Intensifying Climate-Related Outages Boosting Grid-Resilience Spend
Weather now drives nearly 80% of major outages, prompting utilities to invest heavily in grid-hardening initiatives, such as automated sectionalizers, undergrounding, and AI-based vegetation analytics. CenterPoint Energy alone has allocated USD 21 billion over five years to bolster storm resilience, illustrating the large-scale capital currently being invested in preventive technologies. OMS platforms have evolved from fault location tools into comprehensive resilience hubs that integrate weather feeds, asset health data, and automated switching. The economic stakes are evident as multi-day outages repeatedly impose multi-billion-dollar losses on regional economies, strengthening return-on-investment arguments for predictive solutions. Utilities also recognize that preventing customer interruptions enhances satisfaction metrics more effectively than merely accelerating restoration, which in turn prompts accelerated OMS upgrades.
Smart-Grid & ADMS Roll-Outs Across Tier-1 Utilities
Large utilities are replacing siloed applications with unified ADMS-OMS suites that can process SCADA, GIS, and AMI data in real-time. GE Vernova's GridOS and Schneider Electric's One Digital Grid platforms exemplify the shift, promising outage reductions of up to 40% through automated fault isolation and DER coordination. As bidirectional power flows rise, integrated solutions become indispensable, explaining their premium pricing and faster adoption curve. Utilities increasingly embed Zero-Trust security, reflecting regulators' insistence on cyber-resilient architectures.
High Capex & Legacy Integration Hurdles
Enterprise-grade OMS deployments often exceed USD 50 million for large investor-owned utilities. Cost escalates when integrating decades-old SCADA, GIS, and CIS assets that lack modern APIs, forcing custom middleware development and long data-migration projects. Organizational change management further complicates roll-outs as frontline crews adapt to automated workflows. Regulatory scrutiny remains intense because utilities must uphold reliability metrics during system migrations, amplifying execution risk.
Other drivers and restraints analyzed in the detailed report include:
- AI-Driven Predictive Outage Analytics Adoption
- DER Proliferation Demanding Real-Time Visibility
- Cyber-Security Vulnerabilities in Connected OMS
For complete list of drivers and restraints, kindly check the Table Of Contents.
Segment Analysis
Integrated platforms commanded 61.90% of the revenue in 2025 and are forecast to grow at a 19.12% CAGR to 2031, reflecting utilities' drive to consolidate multiple point tools into a single pane of glass. This leadership position underscores how integrated suites cut vendor-management overhead, eliminate data-silo latency, and streamline restoration workflows. Utilities that deploy integrated offerings report 30-40% shorter average outage durations compared to users of fragmented systems.
Oracle's Energy & Water Data Intelligence exemplifies the trend, fusing operational telemetry, weather intelligence, and customer analytics to automate decision logic. As a result, the Outage Management System market size attributed to integrated solutions is set to widen its lead over standalone deployments through 2031. Vendors with comprehensive portfolios, therefore, obtain negotiating leverage, while niche point-solution providers increasingly seek partnerships or acquisitions to remain relevant.
Software maintained a 66.70% share in 2025, anchored by mature codebases from ABB, GE Vernova, and Schneider Electric. Yet services are expanding at 18.02% CAGR because utilities need guidance in AI model training, cyber-hardening, and multi-system data alignment. Consulting captures the fastest growth as utilities confront jurisdiction-specific reliability rules and cloud-sovereignty statutes.
Implementation and support also scale briskly because software procurement accounts for only about one-third of total project spend. The transition toward subscription models reinforces vendor annuity streams. Schneider Electric recorded a 140% jump in SaaS revenue in 2024, signaling utilities' willingness to trade capital expenditures (capex) for operational expenditures (opex). Consequently, service providers wield outsized influence over project outcomes, nudging the Outage Management System market toward higher lifetime-value economics.
Complete Report Scope:
- By Type
- Stand-alone
- Integrated
- By Component
- Software
- Services
- By Deployment Mode
- On-premise
- Cloud
- By Application
- Fault Location and Isolation
- Restoration and Crew Management
- Customer Information and Call Handling
- By Geography
- North America
- United States
- Canada
- Mexico
- Europe
- Germany
- United Kingdom
- France
- Italy
- NORDIC Countries
- Russia
- Rest of Europe
- Asia-Pacific
- China
- India
- Japan
- South Korea
- ASEAN Countries
- Rest of Asia-Pacific
- South America
- Brazil
- Argentina
- Rest of South America
- Middle East and Africa
- Saudi Arabia
- United Arab Emirates
- South Africa
- Rest of Middle East and Africa
- North America
Geography Analysis
North America generated 37.00% of the Outage Management System market revenue in 2025, driven by USD 8 billion in federal transmission grants and a series of severe weather events that compelled utilities to strengthen their grids. Investors reward the procurement of integrated solutions because it visibly improves SAIDI/SAIFI performance. Canada supports regional momentum through provincial-level modernization, as illustrated by Energie NB Power's AI-based outage prediction program, which restored 90% of customers within 24 hours during a 2024 ice storm.
The Asia-Pacific region is the fastest-growing, with a 19.18% CAGR. China's State Grid budgeted more than 600 billion yuan in 2024 for digital substations and ultra-high-voltage corridors, fuelling large OMS tenders. Japan committed upwards of 150 billion yen to reinforce its network in anticipation of AI-driven data-center expansion. India presents additional upside, as Hitachi Energy has earmarked INR 2,000 crore to scale its domestic manufacturing and digital solutions capabilities.
Europe, Latin America, and the Middle East & Africa show steady though lower growth. In Latin America, Chile's 2050 carbon-neutrality roadmap requires USD 431 billion in distribution spending by 2040, thereby expanding the addressable OMS budgets. European utilities emphasize DER integration and storm-resilience upgrades but face slower revenue expansion given their matured grid-modernization baselines. Across all secondary regions, government policy support and multilateral climate finance mechanisms play pivotal roles in the pace of OMS adoption.
- ABB Ltd.
- General Electric Co.
- Oracle Corp.
- Schneider Electric SE
- Siemens AG
- Hitachi Energy (OMS)
- Hexagon (Intergraph)
- CGI Inc.
- Advanced Control Systems (Indra/Minsait ACS)
- Futura Systems Inc.
- ETAP Automation
- Survalent Technology
- Landis+Gyr Group
- Milsoft Utility Solutions
- Trimble Utilities
- OSIsoft (AVEVA)
- IBM Corp.
- Cisco Systems Inc.
- Fujitsu Ltd.
- S&C Electric Co.
- Itron Inc.
Additional Benefits:
- The market estimate (ME) sheet in Excel format
- 3 months of analyst support
TABLE OF CONTENTS
1 Introduction
- 1.1 Study Assumptions & Market Definition
- 1.2 Scope of the Study
2 Research Methodology
3 Executive Summary
4 Market Landscape
- 4.1 Market Overview
- 4.2 Market Drivers
- 4.2.1 Intensifying climate-related outages boosting grid-resilience spend
- 4.2.2 Smart-grid & ADMS roll-outs across Tier-1 utilities
- 4.2.3 Reliability-index (SAIDI/SAIFI) compliance mandates
- 4.2.4 AI-driven predictive outage analytics adoption
- 4.2.5 DER proliferation demanding real-time visibility
- 4.2.6 Shift to cloud-native OMS & mobile workforce tools
- 4.3 Market Restraints
- 4.3.1 High capex & legacy integration hurdles
- 4.3.2 Cyber-security vulnerabilities in connected OMS
- 4.3.3 GIS data-quality gaps undermining algorithms
- 4.3.4 Workforce skill shortage in AI/ML analytics
- 4.4 Supply-Chain Analysis
- 4.5 Regulatory Landscape
- 4.6 Technological Outlook
- 4.7 Porter's Five Forces
- 4.7.1 Bargaining Power of Suppliers
- 4.7.2 Bargaining Power of Buyers
- 4.7.3 Threat of New Entrants
- 4.7.4 Threat of Substitutes
- 4.7.5 Intensity of Competitive Rivalry
5 Market Size & Growth Forecasts
- 5.1 By Type
- 5.1.1 Stand-alone
- 5.1.2 Integrated
- 5.2 By Component
- 5.2.1 Software
- 5.2.2 Services
- 5.3 By Deployment Mode
- 5.3.1 On-premise
- 5.3.2 Cloud
- 5.4 By Application
- 5.4.1 Fault Location and Isolation
- 5.4.2 Restoration and Crew Management
- 5.4.3 Customer Information and Call Handling
- 5.5 By Geography
- 5.5.1 North America
- 5.5.1.1 United States
- 5.5.1.2 Canada
- 5.5.1.3 Mexico
- 5.5.2 Europe
- 5.5.2.1 Germany
- 5.5.2.2 United Kingdom
- 5.5.2.3 France
- 5.5.2.4 Italy
- 5.5.2.5 NORDIC Countries
- 5.5.2.6 Russia
- 5.5.2.7 Rest of Europe
- 5.5.3 Asia-Pacific
- 5.5.3.1 China
- 5.5.3.2 India
- 5.5.3.3 Japan
- 5.5.3.4 South Korea
- 5.5.3.5 ASEAN Countries
- 5.5.3.6 Rest of Asia-Pacific
- 5.5.4 South America
- 5.5.4.1 Brazil
- 5.5.4.2 Argentina
- 5.5.4.3 Rest of South America
- 5.5.5 Middle East and Africa
- 5.5.5.1 Saudi Arabia
- 5.5.5.2 United Arab Emirates
- 5.5.5.3 South Africa
- 5.5.5.4 Rest of Middle East and Africa
- 5.5.1 North America
6 Competitive Landscape
- 6.1 Market Concentration
- 6.2 Strategic Moves (M&A, Partnerships, PPAs)
- 6.3 Market Share Analysis (Market Rank/Share for key companies)
- 6.4 Company Profiles (includes Global level Overview, Market level overview, Core Segments, Financials as available, Strategic Information, Products & Services, and Recent Developments)
- 6.4.1 ABB Ltd.
- 6.4.2 General Electric Co.
- 6.4.3 Oracle Corp.
- 6.4.4 Schneider Electric SE
- 6.4.5 Siemens AG
- 6.4.6 Hitachi Energy (OMS)
- 6.4.7 Hexagon (Intergraph)
- 6.4.8 CGI Inc.
- 6.4.9 Advanced Control Systems (Indra/Minsait ACS)
- 6.4.10 Futura Systems Inc.
- 6.4.11 ETAP Automation
- 6.4.12 Survalent Technology
- 6.4.13 Landis+Gyr Group
- 6.4.14 Milsoft Utility Solutions
- 6.4.15 Trimble Utilities
- 6.4.16 OSIsoft (AVEVA)
- 6.4.17 IBM Corp.
- 6.4.18 Cisco Systems Inc.
- 6.4.19 Fujitsu Ltd.
- 6.4.20 S&C Electric Co.
- 6.4.21 Itron Inc.
7 Market Opportunities & Future Outlook
- 7.1 White-space & Unmet-need Assessment

 2026年全球冷載取貨分析市場報告
 電力中斷管理系統市場:按組件、公共產業類型、部署類型和最終用戶分類 - 2026-2032 年全球預測分銷管理系統市場:按設備類型、組件、分銷管道和最終用戶行業分類 - 全球預測 2026-2032
 高階配電管理系統 (ADMS) 市場規模、佔有率及預測:依組件(SCADA、DMS、OMS)、部署模式(雲端、本地部署)和公用事業規模劃分 - 全球預測 (2026-2036)2026年全球停電管理市場報告
 先進配電管理系統市場-全球產業規模、佔有率、趨勢、機會及預測(依產品、系統類型、最終用戶產業、地區及競爭格局分類,2021-2031年)低壓線路監測終端市場(依配電相數、安裝類型、安裝方式、最終用戶、通訊技術和監測參數分類)-2026-2032年全球預測按解決方案類型、組件、最終用戶、通訊技術、部署模式和應用程式分類的配電市場數位化—2026-2032年全球預測
 故障管理系統市場規模、佔有率和成長分析(按類型、組件、應用、最終用戶和地區分類)—產業預測,2026-2033年
 全球工業低壓配電變電站市場