


 |
市場調查報告書
商品編碼
2115922
石油儲存:市場佔有率分析、產業趨勢及統計、成長預測(2026-2031)Oil Storage - Market Share Analysis, Industry Trends & Statistics, Growth Forecasts (2026 - 2031) |
||||||

※ 本網頁內容可能與最新版本有所差異。詳細情況請與我們聯繫。
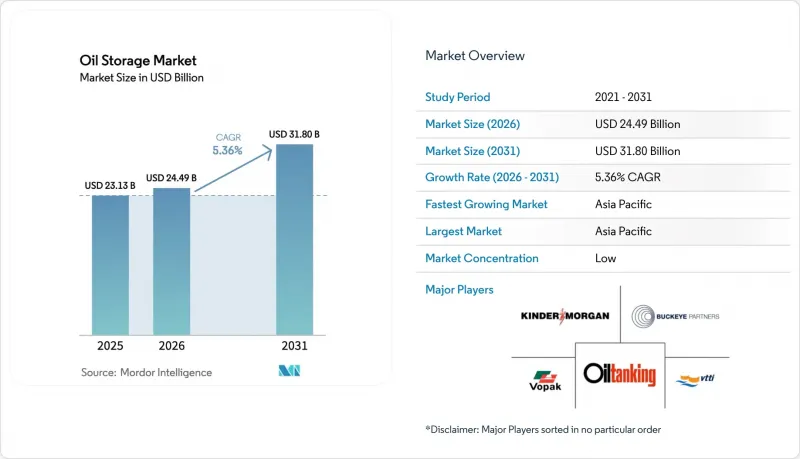
根據 Mordor Intelligence 預測,石油儲存市場規模將從 2025 年的 231.3 億美元和 2026 年的 244.9 億美元成長到 2031 年的 318 億美元,2026 年至 2031 年的複合年成長率為 5.36%。
本報告涵蓋倉儲設施(地上儲存槽、地下儲存槽)、建築材料(碳鋼、玻璃纖維增強塑膠等)、儲存產品(原油、航空燃料等)、容量範圍(100,000 立方米以下、500,000 立方米以上等)、應用(石油和天然氣生產商、戰略石油儲備等)以及地區(亞太地區等)。
全球石油儲存市場的趨勢與洞察
全球能源需求和石油產品消費量都在成長。
國際能源總署(IEA)預測,2026年至2028年間,受亞太地區航空燃料需求成長和撒哈拉以南非洲地區柴油需求成長的推動,石油產品需求將增加180萬桶/日。印度加速工業化進程,使其煉油加工能力在2025年成長了4.2%。值得注意的是,印度石油公司(Indian Oil Corporation)位於古吉拉突邦的煉油廠日加工能力增加了30萬桶。 2025年初,中國山東省的儲槽區利用率超過92%,凸顯了基礎建設未能跟上原油進口配額成長的現況。由於物流緊張導致即時庫存策略難以維持,煉油廠叢集附近的業者正利用強勁的價格溢價獲利。
各國政府擴大戰略石油儲備(SPR)
美國已於2025會計年度撥款15億美元補充美國戰略石油儲備(SPR),此前緊急釋放的儲備量曾降至3.95億桶,為1983年以來的最低水準。作為其自主能源政策的一部分,北京的國家石油儲備能力將在2025年底達到約10億桶,相當於90天的淨進口量。印度第三階段在昌迪科爾和帕杜爾油田新增了650萬桶石油,使國家石油儲備達到3,900萬桶。此次國家採購將使需求從現貨租賃轉向長期契約,導致公司利潤率收窄,但對於接受較低利潤率的營運商而言,這將提高其基準利用率。歐盟委員會已提案強製成員國維持90天的石油儲備量,此舉可望在2028年前將儲備能力再增加5,000萬桶。
為儲槽區引入人工智慧驅動的預測最佳化
到了2025年,Vopak在新加坡和鹿特丹部署了霍尼韋爾Forge分析工具,將意外停機時間減少了18%,並使年度費用收入增加1,200萬美元。 Kinder Morgan在其休士頓航道上試點應用了數位孿生平台,使每車次的卡車裝載等待時間減少了22分鐘。目前只有技術預算在500萬至1000萬美元之間的頂級營運商才能擴展這些系統,這進一步拉大了與小規模的獨立營運商之間的效能差距。
細分市場分析
預計到2025年,地下儲油將佔石油儲存市場佔有率的61.8%。這主要是因為鹽丘地質構造的每桶運作成本約為3.50美元,而地上儲油系統的每桶營運成本則高達12美元。中國黃島和舟山的戰略石油儲備庫是沿海含水層為國家儲備提供安全且易於規避的儲存能力的典型例子。同時,受其快速部署、較低的授權門檻以及在海上生產區域日益廣泛的應用(模組化設計可將建設週期縮短至18個月)的推動,預計到2031年,地上儲罐的複合年成長率將達到6.4%。
對於商業業者而言,地上儲槽更受歡迎,因為其產品周轉率率高且調配柔軟性,足以彌補蒸發損失較大的缺點。由於玻璃鋼(FRP)儲槽不易腐蝕,維修需求降低,因此在含硫原油和高硫燃料油的處理中,玻璃鋼儲槽正日益取代碳鋼。儘管位於德克薩斯州布萊恩山和比格希爾的戰略石油儲備(SPR)洞穴倉儲設施仍然是洞穴儲存經濟性的象徵,但Vopak公司計劃於2025年在富查伊拉安裝FRP儲罐,這表明商業終端的價值判斷正在轉變。
預計到2025年,碳鋼將佔石油儲存市場建築材料需求的40.4%。這主要得益於其成熟的製造供應鏈和全面的API 650認證。對於直徑超過50公尺的大型儲罐,碳鋼仍具有成本優勢。然而,隨著業主越來越重視整體生命週期經濟效益而非表面資本投資,預計玻璃纖維增強塑膠(FRP)將以6.9%的複合年成長率成長。
生命週期模型顯示,鋼製儲槽30年總擁有成本中約有35%用於腐蝕控制,而FRP(玻璃鋼)儲槽則無需內塗層和陰極防蝕。雙相不鏽鋼正日益用於儲存高硫原油,沙烏地阿美公司已在其延布擴建計畫中選用了這種材料,以適應其馬尼法混合原油的特性。歐洲對揮發性有機化合物(VOC)排放的監管壓力進一步加速了汽油和石腦油倉儲設施向FRP和不銹鋼解決方案的轉變。
區域分析
預計到2025年,亞太地區將佔全球銷售額的42.3%,這主要得益於2024年至2028年間煉油產能總合增加260萬桶,並維持到2031年5.8%的複合年成長率。山東省一家獨立煉油廠在2024年至2025年間增加了800萬桶的儲油能力,由於原油進口配額增加,運轉率超過90%。印度的第三期戰略石油儲備計畫(SPR)新增了650萬桶的儲油洞穴,使國家石油儲備總量達到3,900萬桶,到2025年,國家石油儲備能力足以滿足9.5天的淨進口量。東協的進口碼頭進行了擴建,以滿足不斷成長的柴油和噴射機燃料需求,而新加坡裕廊島繼續保持其作為區域樞紐的地位。
預計到2025年,北美將佔全球石油儲存市場佔有率的約24%,並以4.9%的複合年成長率成長,這主要得益於煉油廠的合理化調整與墨西哥灣沿岸地區出口碼頭擴張之間的平衡。奧克拉荷馬州庫欣的運作能力約為7,600萬桶,但由於管線回流使得來自二疊紀盆地的原油可以直接輸送到沿海煉油廠,其2025年中期的平均運轉率僅為62%。金德摩根公司和企業產品公司正在科珀斯克里斯蒂和休士頓附近新建1,200萬桶的出口倉儲設施,以支援每日400萬桶的原油出口。美國戰略石油儲備(SPR)補充計畫的目標是到2027年達到1.8億桶,預計這將部分抵消需求成長放緩的影響。
2025年,歐洲、中東和非洲三大區域合計將佔全球總貿易量的34%,但各區域的成長速度有所不同。在歐洲,由於煉油廠關閉,需求正在放緩,但由於為確保能源安全所做的努力,戰略儲備正在增加,因此複合年成長率(CAGR)為4.2%。 2025年,Vopak在鹿特丹新增了200萬桶的倉儲設施,以滿足可再生柴油和液化天然氣製油貿易的需求。中東的成長更為強勁,複合年成長率為6.1%,這得益於沙烏地阿美和阿布達比國家石油公司(ADNOC)對下游產業的整合,以及富查伊拉發展成為區域間燃料庫中心。非洲的加工能力擴張主要集中在奈及利亞、安哥拉和埃及,而在國內煉油能力跟不上消費的地區,正在海上生產倉儲設施和成品油進口碼頭之間尋求平衡。
其他好處:
- Excel格式的市場預測(ME)表
- 3個月的分析師支持
目錄
第1章:引言
- 市場分析與定義的前提條件
- 分析範圍
第2章 分析方法
第3章執行摘要
第4章 市場狀況
- 市場概覽
- 市場促進因素
- 全球能源需求和石油產品消耗量增加
- 政府擴大戰略石油儲備
- 原油價格波動導致各公司增加庫存。
- 新興國家煉油廠加工能力的提高
- 為儲槽區引入人工智慧驅動的預測最佳化
- 用於海上生產區的模組化浮體式儲存設施
- 市場限制因素
- 能源轉型導致石化燃料佔有率下降
- 建造新碼頭需要大量資金投入和漫長的授權程序。
- 強制性網路保險將導致營運成本增加。
- 深水港周邊沿海地區土地短缺
- 供應鏈分析
- 監理情勢
- 技術展望
- 波特五力分析
第5章:預測市場規模與成長率
- 透過倉儲設施
- 地面儲存槽(AST)
- 地下儲存槽(UST)
- 按建築材料
- 碳鋼
- 不銹鋼
- 玻璃纖維增強塑膠
- 複合材料及其他
- 按儲存產品
- 原油
- 汽油石腦油
- 柴油 - 中餾分油
- 航空燃料
- 其他(燃油、液化石油氣等)
- 按容量範圍
- 100,000 立方米或以下
- 100,000 至 250,000 立方米
- 250,000 至 500,000 立方米
- 超過50萬立方米
- 透過使用
- 石油和天然氣生產商
- 煉油廠
- 貿易業者/經銷商
- 石油化學和工業用戶
- 戰略石油儲備(SPR)
- 按地區
- 北美洲
- 美國
- 加拿大
- 墨西哥
- 歐洲
- 德國
- 英國
- 法國
- 義大利
- 西班牙
- 北歐國家
- 俄羅斯
- 其他歐洲國家
- 亞太地區
- 中國
- 印度
- 日本
- 韓國
- 東南亞國協
- 澳洲和紐西蘭
- 其他亞太國家
- 南美洲
- 巴西
- 阿根廷
- 哥倫比亞
- 其他南美國家
- 中東和非洲
- 沙烏地阿拉伯
- 阿拉伯聯合大公國
- 南非
- 埃及
- 其他中東和非洲國家
- 北美洲
第6章 競爭情勢
- 市場集中度
- 策略趨勢(併購、聯盟、購電協議)
- 市場佔有率分析(主要公司的市場排名和市場佔有率)
- 公司簡介
- Koninklijke Vopak NV
- Oiltanking GmbH
- Vitol Tank Terminals International(VTTI)
- Kinder Morgan Inc.
- Buckeye Partners LP
- Magellan Midstream Partners LP
- NuStar Energy LP
- Rubis Terminal
- Horizon Terminals Ltd.
- Gulf Petrochem FZC(GP Terminal)
- McDermott International Inc.
- Fluor Corporation
- China National Petroleum Corporation
- Saudi Aramco(including Aramco Trading & Terminals)
- PetroChina Company Ltd.
- ERGIL Group
- TF Warren Group
- Shawcor Ltd.
- Chemie Tech Group
- INCO Group
- Heavy Engineering Industries & Shipbuilding(HEISCO)
- Stolthaven Terminals
第7章 市場機會與未來展望
According to Mordor Intelligence, the oil storage market size is projected to expand from USD 23.13 billion in 2025 and USD 24.49 billion in 2026 to USD 31.80 billion by 2031, registering a CAGR of 5.36% between 2026 to 2031.
This report is Segmented by Storage Facility (Above Ground Storage Tanks and Underground Storage Tanks), Construction Material (Carbon Steel, Fiberglass-Reinforced Plastic, and More), Product Stored (Crude Oil, Aviation Fuel, and More), Capacity Range (Up To 100k M3, Above 500k M3, and More), Application (Oil and Gas Producers, Strategic Petroleum Reserve Agencies, and More) and Geography (Asia-Pacific, and More)
Global Oil Storage Market Trends and Insights
Rising Global Energy Demand and Petroleum-Product Consumption
The International Energy Agency (IEA) expects petroleum-product demand to expand by 1.8 million b/d between 2026 and 2028, led by aviation-fuel growth in Asia-Pacific and diesel in sub-Saharan Africa. Accelerating industrialization in India drove a 4.2% increase in refinery throughput during 2025, highlighted by Indian Oil Corporation's 300,000 b/d capacity addition at its Gujarat complex. Tank-farm utilization in China's Shandong province surpassed 92% in early 2025, underscoring infrastructure lag relative to crude-import quotas. Operators co-located with refinery clusters leverage resilient tariff premiums as just-in-time inventory strategies become fragile under logistics stress.
Strategic Petroleum Reserve Build-Outs by Governments
Washington allocated USD 1.5 billion in fiscal 2025 to replenish the U.S. SPR after emergency releases depleted inventories to 395 million barrels, its lowest level since 1983. Beijing's state reserve capacity reached roughly 1.0 billion barrels by end-2025, equal to 90 days of net imports, as part of a sovereignty-focused energy agenda. India's third phase added 6.5 million barrels across Chandikhol and Padur, lifting national reserves to 39 million barrels. These sovereign procurements pivot demand from spot leasing toward long-term tariffs, trimming merchant margins yet lifting baseline utilization for operators that accept lower returns. A European Commission proposal to mandate 90-day cover across member states could stimulate another 50 million barrels of capacity before 2028.
AI-Driven Predictive Tank-Farm Optimization Adoption
Vopak deployed Honeywell Forge analytics across Singapore and Rotterdam in 2025, trimming unplanned downtime by 18% and boosting annual tariff revenue by USD 12 million. Kinder Morgan piloted a digital-twin platform at the Houston Ship Channel, lowering truck-loading queues by 22 minutes per transaction. Only Tier-1 operators with access to USD 5-10 million technology budgets are scaling such systems, widening the performance gap with smaller independents.
Other drivers and restraints analyzed in the detailed report include:
- Volatile Crude-Oil Prices Increasing Commercial Stock-Holding
- Growing Refinery Throughput in Emerging Economies
- Modular Floating Storage Units for Offshore Production Zones
For complete list of drivers and restraints, kindly check the Table Of Contents.
Segment Analysis
Underground caverns controlled 61.8% of the oil storage market share in 2025, largely because salt-dome geology yields operating costs near USD 3.50 per barrel versus USD 12 for above-ground systems. China's Huangdao and Zhoushan SPR sites illustrate how coastal aquifers provide secure, surveillance-resistant capacity for sovereign reserves. Above-ground tanks, however, are projected to log a 6.4% CAGR through 2031, driven by rapid-deployment schedules, lower permitting barriers, and growing use in offshore production zones where modular designs shorten construction to 18 months.
Commercial operators favor above-ground tanks because higher product turnover and blending flexibility offset their larger evaporation losses. Fiberglass-reinforced plastic vessels are winning conversions from carbon steel in sour-crude and high-sulfur fuel-oil service thanks to reduced corrosion maintenance. The Bryan Mound and Big Hill SPR caverns in Texas remain emblematic of cavern economics, yet Vopak's 2025 installation of FRP vessels at Fujairah signals a shifting value calculus for commercial terminals.
Carbon steel accounted for 40.4% of construction-material demand within the oil storage market size in 2025 because of mature fabrication supply chains and comprehensive API 650 certification. It stays cost-advantaged for large-diameter tanks above 50 meters. Still, fiberglass-reinforced plastic is slated to grow at 6.9% CAGR as owners weigh full lifecycle economics rather than headline capex.
Lifecycle modeling shows corrosion management consumes roughly 35% of a steel tank's total ownership cost over 30 years, whereas FRP eliminates internal coating and cathodic-protection budgets. Duplex stainless steel is gaining traction in sulfur-rich crude service; Saudi Aramco opted for that material in its Yanbu expansion to anticipate Manifa blend properties. Regulatory pressure on volatile organic compound emissions further tilts European gasoline and naphtha storage toward FRP and stainless steel solutions.
Complete Report Scope:
- By Storage Facility
- Above Ground Storage Tanks (ASTs)
- Underground Storage Tanks (USTs)
- By Construction Material
- Carbon Steel
- Stainless Steel
- Fiberglass-Reinforced Plastic
- Composites and Others
- By Product Stored
- Crude Oil
- Gasoline & Naphtha
- Diesel & Middle Distillates
- Aviation Fuel
- Others (Fuel Oil, LPG, etc.)
- By Capacity Range
- Up to 100k m3
- 100 to 250k m3
- 250 to 500k m3
- Above 500k m3
- By Application
- Oil and Gas Producers
- Refineries
- Traders and Distributors
- Petrochemical and Industrial Users
- Strategic Petroleum Reserve Agencies (SPRs)
- By Geography
- North America
- United States
- Canada
- Mexico
- Europe
- Germany
- United Kingdom
- France
- Italy
- Spain
- NORDIC Countries
- Russia
- Rest of Europe
- Asia-Pacific
- China
- India
- Japan
- South Korea
- ASEAN Countries
- Australia and New Zealand
- Rest of Asia-Pacific
- South America
- Brazil
- Argentina
- Colombia
- Rest of South America
- Middle East and Africa
- Saudi Arabia
- United Arab Emirates
- South Africa
- Egypt
- Rest of Middle East and Africa
- North America
Geography Analysis
Asia-Pacific controlled 42.3% of 2025 revenue and will sustain a 5.8% CAGR through 2031, led by refinery throughput additions totaling 2.6 million b/d between 2024 and 2028. Independent refiners in Shandong province lifted storage capacity by 8 million barrels during 2024-2025, yet utilization stayed above 90% amid higher crude-import quotas. India's third SPR phase delivered 6.5 million barrels of new caverns, bringing total sovereign reserves to 39 million barrels and raising national cover to 9.5 days of 2025 net imports. ASEAN import terminals expanded to meet rising diesel and jet-fuel needs, with Singapore's Jurong Island retaining its role as a regional hub.
North America captured roughly 24% oil storage market share in 2025 and is expected to grow at a 4.9% CAGR as refinery rationalization balances Gulf Coast export-terminal expansion. Cushing, Oklahoma's working capacity sits near 76 million barrels, yet utilization averaged only 62% in mid-2025 after pipeline reversals routed Permian flows directly to coastal refineries. Kinder Morgan and Enterprise Products added 12 million barrels of new export storage around Corpus Christi and Houston to support 4 million b/d of outbound crude. The U.S. SPR refill program targets 180 million barrels by 2027, partially offsetting slower demand growth.
Europe, the Middle East, and Africa together generated 34% of the 2025 turnover with varying momentum. Europe advances at 4.2% CAGR as refinery closures moderate demand but energy-security initiatives lift strategic stocks. Vopak added 2 million barrels at Rotterdam in 2025 to serve renewable diesel and LNG-to-liquids trades. The Middle East exhibits stronger growth at 6.1% CAGR thanks to downstream integration by Saudi Aramco and ADNOC, alongside Fujairah's expansion as an inter-regional bunkering center. Africa's capacity builds cluster around Nigeria, Angola, and Egypt, balancing offshore production storage with product import terminals where domestic refining lags consumption.
- Koninklijke Vopak NV
- Oiltanking GmbH
- Vitol Tank Terminals International (VTTI)
- Kinder Morgan Inc.
- Buckeye Partners L.P.
- Magellan Midstream Partners L.P.
- NuStar Energy L.P.
- Rubis Terminal
- Horizon Terminals Ltd.
- Gulf Petrochem FZC (GP Terminal)
- McDermott International Inc.
- Fluor Corporation
- China National Petroleum Corporation
- Saudi Aramco (including Aramco Trading & Terminals)
- PetroChina Company Ltd.
- ERGIL Group
- T.F. Warren Group
- Shawcor Ltd.
- Chemie Tech Group
- INCO Group
- Heavy Engineering Industries & Shipbuilding (HEISCO)
- Stolthaven Terminals
Additional Benefits:
- The market estimate (ME) sheet in Excel format
- 3 months of analyst support
TABLE OF CONTENTS
1 Introduction
- 1.1 Study Assumptions & Market Definition
- 1.2 Scope of the Study
2 Research Methodology
3 Executive Summary
4 Market Landscape
- 4.1 Market Overview
- 4.2 Market Drivers
- 4.2.1 Rising global energy demand & petroleum-product consumption
- 4.2.2 Strategic petroleum reserve build-outs by governments
- 4.2.3 Volatile crude-oil prices increasing commercial stock-holding
- 4.2.4 Growing refinery throughput in emerging economies
- 4.2.5 AI-driven predictive tank-farm optimisation adoption
- 4.2.6 Modular floating storage units for offshore production zones
- 4.3 Market Restraints
- 4.3.1 Energy-transition-led decline in fossil-fuel share
- 4.3.2 High capex & lengthy permitting for new terminals
- 4.3.3 Cyber-insurance mandates inflating OPEX
- 4.3.4 Coastal-zoning land scarcity near deep-water ports
- 4.4 Supply-Chain Analysis
- 4.5 Regulatory Landscape
- 4.6 Technological Outlook
- 4.7 Porter's Five Forces
- 4.7.1 Bargaining Power of Suppliers
- 4.7.2 Bargaining Power of Consumers
- 4.7.3 Threat of New Entrants
- 4.7.4 Threat of Substitute Products & Services
- 4.7.5 Intensity of Competitive Rivalry
5 Market Size & Growth Forecasts
- 5.1 By Storage Facility
- 5.1.1 Above Ground Storage Tanks (ASTs)
- 5.1.2 Underground Storage Tanks (USTs)
- 5.2 By Construction Material
- 5.2.1 Carbon Steel
- 5.2.2 Stainless Steel
- 5.2.3 Fiberglass-Reinforced Plastic
- 5.2.4 Composites and Others
- 5.3 By Product Stored
- 5.3.1 Crude Oil
- 5.3.2 Gasoline & Naphtha
- 5.3.3 Diesel & Middle Distillates
- 5.3.4 Aviation Fuel
- 5.3.5 Others (Fuel Oil, LPG, etc.)
- 5.4 By Capacity Range
- 5.4.1 Up to 100k m3
- 5.4.2 100 to 250k m3
- 5.4.3 250 to 500k m3
- 5.4.4 Above 500k m3
- 5.5 By Application
- 5.5.1 Oil and Gas Producers
- 5.5.2 Refineries
- 5.5.3 Traders and Distributors
- 5.5.4 Petrochemical and Industrial Users
- 5.5.5 Strategic Petroleum Reserve Agencies (SPRs)
- 5.6 By Geography
- 5.6.1 North America
- 5.6.1.1 United States
- 5.6.1.2 Canada
- 5.6.1.3 Mexico
- 5.6.2 Europe
- 5.6.2.1 Germany
- 5.6.2.2 United Kingdom
- 5.6.2.3 France
- 5.6.2.4 Italy
- 5.6.2.5 Spain
- 5.6.2.6 NORDIC Countries
- 5.6.2.7 Russia
- 5.6.2.8 Rest of Europe
- 5.6.3 Asia-Pacific
- 5.6.3.1 China
- 5.6.3.2 India
- 5.6.3.3 Japan
- 5.6.3.4 South Korea
- 5.6.3.5 ASEAN Countries
- 5.6.3.6 Australia and New Zealand
- 5.6.3.7 Rest of Asia-Pacific
- 5.6.4 South America
- 5.6.4.1 Brazil
- 5.6.4.2 Argentina
- 5.6.4.3 Colombia
- 5.6.4.4 Rest of South America
- 5.6.5 Middle East and Africa
- 5.6.5.1 Saudi Arabia
- 5.6.5.2 United Arab Emirates
- 5.6.5.3 South Africa
- 5.6.5.4 Egypt
- 5.6.5.5 Rest of Middle East and Africa
- 5.6.1 North America
6 Competitive Landscape
- 6.1 Market Concentration
- 6.2 Strategic Moves (M&A, Partnerships, PPAs)
- 6.3 Market Share Analysis (Market Rank/Share for key companies)
- 6.4 Company Profiles (includes Global level Overview, Market level overview, Core Segments, Financials as available, Strategic Information, Products & Services, and Recent Developments)
- 6.4.1 Koninklijke Vopak NV
- 6.4.2 Oiltanking GmbH
- 6.4.3 Vitol Tank Terminals International (VTTI)
- 6.4.4 Kinder Morgan Inc.
- 6.4.5 Buckeye Partners L.P.
- 6.4.6 Magellan Midstream Partners L.P.
- 6.4.7 NuStar Energy L.P.
- 6.4.8 Rubis Terminal
- 6.4.9 Horizon Terminals Ltd.
- 6.4.10 Gulf Petrochem FZC (GP Terminal)
- 6.4.11 McDermott International Inc.
- 6.4.12 Fluor Corporation
- 6.4.13 China National Petroleum Corporation
- 6.4.14 Saudi Aramco (including Aramco Trading & Terminals)
- 6.4.15 PetroChina Company Ltd.
- 6.4.16 ERGIL Group
- 6.4.17 T.F. Warren Group
- 6.4.18 Shawcor Ltd.
- 6.4.19 Chemie Tech Group
- 6.4.20 INCO Group
- 6.4.21 Heavy Engineering Industries & Shipbuilding (HEISCO)
- 6.4.22 Stolthaven Terminals
7 Market Opportunities & Future Outlook
- 7.1 White-space & Unmet-Need Assessment

 石油和化學品洩漏應急包市場-2026-2032年全球市場預測石油儲存市場:2026-2032年全球市場預測(依儲槽類型、儲槽材質、產品類型、儲槽設計、安裝類型及應用分類)
 石油儲存市場報告:按材料、產品、應用和地區分類(2026-2034 年)
 全球石油儲存市場規模、佔有率、趨勢和成長分析報告(2026-2034年)
 2026年全球石油儲存市場報告
 石油儲存終端市場-全球產業規模、佔有率、趨勢、機會、預測:按類型、儲罐類型、產品、地區和競爭格局分類,2021-2031年
 石油儲存市場規模、佔有率和趨勢分析報告:按產品、應用、地區和細分市場預測(2026-2033 年)
 石油儲存市場規模、佔有率和成長分析(按類型、材質、容量、應用、產業和地區分類)-2026-2033年產業預測石油儲存市場-全球產業規模、佔有率、趨勢、機會和預測(按類型、材料、燃料類型、地區和競爭格局分類,2020-2030 年預測)
 按產品、材料、應用和地區分類的石油儲存市場