


 |
市場調查報告書
商品編碼
2115797
自主代理:市場佔有率分析、產業趨勢與統計、成長預測(2026-2031)Autonomous Agents - Market Share Analysis, Industry Trends & Statistics, Growth Forecasts (2026 - 2031) |
||||||

※ 本網頁內容可能與最新版本有所差異。詳細情況請與我們聯繫。
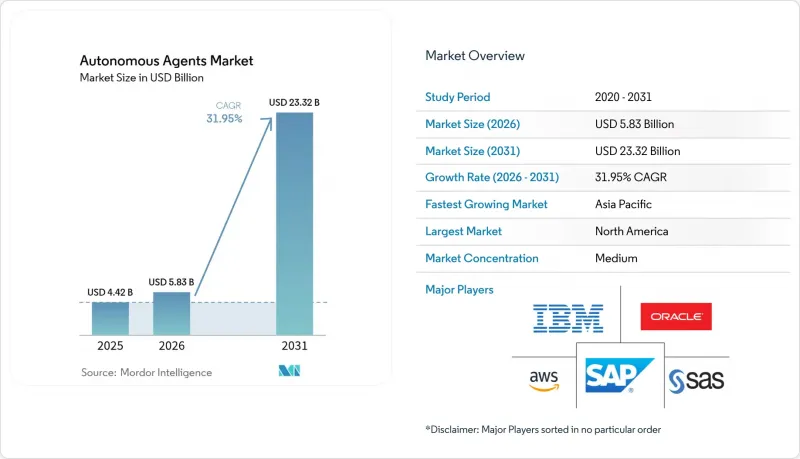
根據 Mordor Intelligence 估計,到 2026 年,自主代理市值將達到 58.3 億美元,高於 2025 年的 44.2 億美元,預計到 2031 年將達到 233.2 億美元。
預計 2026 年至 2031 年的複合年成長率將達到 31.95%。
本報告按組件(解決方案和服務)、部署模式(雲端和本地部署)、自主程度(反應式代理、思考式代理等)、組織規模(中小企業和大型企業)、行業(銀行、金融服務和保險、製造業、IT和電信等)以及地區進行分類。
全球自主代理市場趨勢及洞察
銀行、金融服務和保險 (BFSI) 行業對高度個人化客戶參與的需求正在推動代理商採用該技術。
銀行正在部署自主代理,透過數位管道提供即時、個人化的推薦服務。全球78%的金融機構計劃在2026年前完成部署。摩根大通的COIN平台目前每年審核12,000份複雜契約,從而減少了36萬工時,並將準確率提高了30%。與核心銀行系統的整合使代理商能夠就貸款和詐欺監控做出即時決策,將被動服務轉變為主動服務。服務交付成本降低25-30%,顧客滿意度提高15-20%,進一步提升了投資報酬率(ROI)。美國和歐盟法規結構的日趨成熟,使代理商能夠在處理敏感交易的同時,保持清晰的審計追蹤。這些因素共同推動自主代理市場以7.4%的複合年成長率成長。
歐洲汽車製造商正朝著車上用軟體定義架構的方向發展。
製造商正圍繞軟體平台重新設計車輛,將智慧代理整合到駕駛體驗的各個方面。賓士已將智慧代理整合到 MB.OS 系統中,使其能夠根據駕駛者的駕駛習慣和路況進行調整,從而提升預測性維護能力,並將停機時間減少 20%。從硬體差異化轉向軟體差異化,為部署符合歐洲嚴格隱私法規的安全且可擴展的智慧代理生態系統創造了更多空間。目前,主要汽車製造商的軟體研發投入正以每年超過 35% 的速度成長,推動了 5.8% 的複合年成長率。
異質代理平台之間缺乏互通性標準
企業報告稱,跨平台整合平均延遲 8.3 個月,這限制了多代理協作的優勢。只有 23% 的部署能夠連接來自多個供應商的代理,導致供應商鎖定和高昂的定製成本。推廣通用協議(例如 Google 的「Agent2Agent」)的供應商尚未達到關鍵階段,這使得短期採用率下降了 3.2%。
細分市場分析
預計到 2025 年,解決方案將佔據自主代理市場 67.20% 的佔有率,這表明企業對整合安全性、管治和工作流程編配功能的現成平台的支援日益增強。 IBM 的 WatsonX Orchestrate 可與 80 多個業務應用程式整合,並提供超過 150 個現成代理的目錄。該細分市場具有快速部署和整合管理主機等優勢,使其成為大規模部署的基礎。然而,隨著企業尋求針對更複雜部署的諮詢服務,服務領域正在迅速擴展。到 2031 年,33.92% 的複合年成長率表明,整合、培訓和託管服務合作夥伴在釋放解決方案價值方面發揮核心作用。隨著部署變得越來越複雜,對專家指導的需求也不斷成長。
在金融和醫療保健等受監管行業,需要諮詢服務來確保合規性,而託管服務供應商正進入代理營運市場,以幫助缺乏內部人才的客戶。隨著企業將先導計畫推進到生產環境並要求持續最佳化,預計服務業自主代理的市場規模將翻倍。
預計到 2025 年,雲端部署將佔據 81.10% 的市場佔有率,這反映出市場對支援大規模語言模型的彈性運算的偏好。微軟 Azure AI Foundry 為用戶提供超過 1900 個 AI 模型,並可自動擴展資源以滿足工作負載需求。雲端的預期複合年成長率 (CAGR) 為 34.02%,這得益於人們對虛擬私有雲端(VPC) 安全控制的信心不斷增強,從而鞏固了雲作為預設環境的地位。隨著模型規模超出本地容量,由雲端工作負載驅動的自主代理市場規模預計將進一步擴大。
在國防、政府和金融服務等對敏感資料管理要求極高的產業,本地部署系統仍然至關重要。混合方法透過在雲端運行訓練,同時將推理過程路由到本地基礎設施,從而彌合了這一差距。邊緣運算作為一種補充方法正在興起,它平衡了安全性和可擴展性,使代理程式能夠在設備附近執行對延遲敏感的任務。
區域分析
預計到2025年,北美將佔據全球自主代理市場40.30%的佔有率,這主要得益於大量的研發投入和企業的早期應用。美國企業計劃在2025年在人工智慧研究領域投資超過3000億美元,其中相當一部分預計將用於代理技術。金融機構和醫院在應用人工智慧方面處於領先地位,這得益於聯邦政府的支援框架,該框架旨在平衡創新與負責任的人工智慧。集中的創業投資資金和豐富的人才儲備也進一步推動了這一發展勢頭。
亞太地區是成長最快的地區,預計2026年至2031年的複合年成長率將達到35.10%。中國的國家人工智慧戰略大力補貼自主製造代理,而日本和韓國則支持智慧工廠示範計畫以應對勞動力短缺問題。沿岸地區客製化代理商解決方案的採用率不斷提高,CNTXT AI和Beam AI等合資企業預計,到2025年,該地區的市場規模將達到42億至54億美元。擴充性的雲端基礎設施和5G部署使該地區適合邊緣部署代理,從而拓展了其在物流和零售領域的應用。在歐洲,嚴格的倫理監管與實際應用在汽車、金融和工業領域並存。歐盟人工智慧立法要求透明度和風險管理,引導產品設計朝著可靠的結果邁進。憑藉車輛中的軟體定義架構,歐洲在車載代理領域處於領先地位。預計到2031年,該地區的AI市場規模將達到2,355億美元,複合年成長率達26.3%,展現強勁的成長潛力。儘管醫療保健領域與資料主權相關的監管措施正在減緩其實施速度,但同時也加速了隱私保護型AI技術的發展,這有望在未來成為一項重要的出口優勢。
其他好處:
- Excel格式的市場預測(ME)表
- 3個月的分析師支持
目錄
第1章:引言
- 研究假設和市場定義
- 調查範圍
第2章:調查方法
第3章執行摘要
第4章 市場狀況
- 市場概覽
- 市場促進因素
- 銀行、金融服務和保險 (BFSI) 行業對高度個人化客戶參與的需求正在推動代理商採用該技術。
- 歐洲汽車OEM廠商向車上用軟體定義架構的轉型
- 北亞智慧廠最佳化中多智慧體強化學習的興起
- 美國聯邦政府機構對可解釋人工智慧的監管要求
- 5G專用網路中邊緣部署代理程式的快速擴展
- 市場限制因素
- 異質代理平台之間缺乏互通性標準
- 歐盟醫療保健領域對培訓數據的主權存在很高的障礙。
- 行動代理中設備推理的能效限制
- 多智慧體安全與對準工程領域人員短缺
- 價值鏈分析
- 監管和標準展望
- 技術展望
- 波特五力模型
- 投資分析
- 宏觀經濟趨勢對市場的影響
第5章 市場規模與成長預測
- 按組件
- 解決方案
- - 平台
- 框架和工具包
- 服務
- 專業服務
- - 託管服務
- 依部署類型
- 雲
- 現場
- 自主等級
- 反應劑
- 審慎代理人
- 混合代理
- 認知代理
- 按組織規模
- 中小企業
- 大公司
- 按行業分類
- BFSI
- 資訊科技/通訊
- 醫療保健和生命科學
- 製造業
- 交通運輸與出行
- 零售與電子商務
- 能源公用事業
- 其他
- 按地區
- 北美洲
- 美國
- 加拿大
- 南美洲
- 巴西
- 其他南美國家
- 歐洲
- 德國
- 英國
- 法國
- 北歐的
- 其他歐洲國家
- 中東
- GCC
- 土耳其
- 其他中東國家
- 非洲
- 南非
- 其他非洲國家
- 亞太地區
- 中國
- 日本
- 韓國
- 印度
- 其他亞洲國家
- 北美洲
第6章 競爭情勢
- 市場集中度
- 策略趨勢
- 市佔率分析
- 公司簡介
- IBM Corporation
- Google LLC
- Microsoft Corporation
- Amazon Web Services Inc.
- Oracle Corporation
- SAP SE
- Salesforce Inc.
- SAS Institute Inc.
- Intel Corporation
- Aptiv PLC
- Nuance Communications
- Infosys Limited
- Fair Isaac Corporation(FICO)
- Fetch.ai Ltd.
- Affectiva Inc.
- Baidu Inc.
- Huawei Technologies Co. Ltd.
- Bosch Global Software Technologies
- SAPEON Inc.
- DataRobot Inc.
第7章 市場機會與未來展望
According to Mordor Intelligence, autonomous agents market size in 2026 is estimated at USD 5.83 billion, growing from 2025 value of USD 4.42 billion with 2031 projections showing USD 23.32 billion, growing at 31.95% CAGR over 2026-2031.
This report is Segmented by Component (Solution and Services), Deployment Type (Cloud and On-Premises), Autonomy Level (Reactive Agents, Deliberative Agents, and More), Organization Site (Small and Medium-Sized Enterprises (SMEs) and Large Enterprises), Industry Vertical (BFSI, Manufacturing, IT and Telecom, and More), and Geogrpahy.
Global Autonomous Agents Market Trends and Insights
Hyper-personalised Customer Engagement Needs in BFSI Driving Agent Adoption
Banks are rolling out autonomous agents to deliver real-time, personalised recommendations across digital channels, with 78% of global institutions scheduling deployments by 2026. JPMorgan's COIN platform now reviews 12,000 complex contracts a year, saving 360,000 human hours and raising accuracy by 30%. Integration with core banking systems lets agents make instant lending and fraud-monitoring decisions, turning reactive service into proactive engagement. Return on investment is strengthened by service-delivery savings of 25-30% and customer-satisfaction gains of 15-20%. Regulatory frameworks in the United States and the European Union are maturing, allowing agents to handle sensitive transactions with clear audit trails. These factors together are adding a 7.4% lift to the autonomous agents market CAGR.
European Automotive OEM Shift to In-Vehicle Software-Defined Architectures
Manufacturers are redesigning vehicles around software platforms that embed agents throughout the driving experience. Mercedes-Benz is integrating agents within MB.OS to adapt to driver habits and road conditions, boosting predictive-maintenance capability and cutting downtime by 20%. The movement from hardware to software differentiation is opening space for secure, scalable agent ecosystems that comply with Europe's strict privacy rules. Increased software R&D, now growing more than 35% each year among leading OEMs, underlies the 5.8% CAGR impact.
Lack of Interoperability Standards Across Heterogeneous Agent Platforms
Enterprises report cross-platform integration delays averaging 8.3 months, limiting multi-agent collaboration benefits. Only 23% of deployments manage to connect agents from more than one vendor, forcing lock-in or expensive custom work. Vendors pursuing common protocols, such as Google's Agent2Agent, have yet to reach critical mass, restraining near-term adoption by 3.2%.
Other drivers and restraints analyzed in the detailed report include:
- Surge in Multi-agent RL for Smart-Factory Optimisation in North Asia
- Regulatory Mandates for Explainable AI in U.S. Federal Agencies
- Talent Scarcity in Multi-Agent Safety and Alignment Engineering
For complete list of drivers and restraints, kindly check the Table Of Contents.
Segment Analysis
Solutions captured 67.20% of the autonomous agents market in 2025, showing enterprise preference for ready-made platforms that integrate security, governance, and workflow orchestration. IBM watsonx Orchestrate links to more than 80 business applications and lists over 150 pre-built agents in its catalog. The segment benefits from quick implementation and unified management consoles, making it the cornerstone of large-scale deployments. Services, however, are expanding quickly as firms seek consulting for complex rollouts. A 33.92% CAGR through 2031 indicates that integration, training, and managed-services partners are central to unlocking solution value.Growing adoption complexity is lifting demand for expert guidance.
Regulated sectors such as finance and healthcare need advisory services to meet compliance, and managed-services providers are stepping in to operate agents for customers lacking in-house talent. The autonomous agents market size allocated to services is predicted to multiply as enterprises migrate pilot projects into production and request ongoing optimization.
Cloud deployments owned 81.10% share in 2025, reflecting preference for elastic compute that supports large language models. Microsoft Azure AI Foundry gives users access to more than 1,900 AI models and auto-scales resources to match workload demand.The cloud's 34.02% forecast CAGR confirms its role as the default environment, helped by growing confidence in virtual-private-cloud security controls. The autonomous agents market size attributed to cloud workloads is expected to widen further as model-size growth outpaces on-premises capacity.
On-premises systems remain important for defense, government, and financial services that demand control over sensitive data. Hybrid approaches are bridging the gap, routing inference to local infrastructure while training runs in the cloud. Edge computing is emerging as a complementary method where agents run latency-sensitive tasks near devices, blending security with scale.
Complete Report Scope:
- By Component
- Solution
- - Platforms
- - Frameworks and Toolkits
- Services
- - Professional Services
- - Managed Services
- By Deployment Type
- Cloud
- On-Premises
- By Autonomy Level
- Reactive Agents
- Deliberative Agents
- Hybrid Agents
- Cognitive Agents
- By Organization Size
- Small and Medium-sized Enterprises (SMEs)
- Large Enterprises
- By Industry Vertical
- BFSI
- IT and Telecom
- Healthcare and Life Sciences
- Manufacturing
- Transportation and Mobility
- Retail and E-commerce
- Energy and Utilities
- Others
- By Geography
- North America
- United States
- Canada
- South America
- Brazil
- Rest of South America
- Europe
- Germany
- United Kingdom
- France
- Nordics
- Rest of Europe
- Middle East
- GCC
- Turkey
- Rest of Middle East
- Africa
- South Africa
- Rest of Africa
- Asia Pacific
- China
- Japan
- South Korea
- India
- Rest of Asia
- North America
Geography Analysis
North America generated 40.30% of the autonomous agents market in 2025 thanks to heavy R&D investment and early corporate adoption. United States enterprises plan to spend more than USD 300 billion on AI research in 2025, with a sizeable portion aligned to agent technologies. Financial institutions and hospitals lead deployments, boosted by supportive federal frameworks that balance innovation with responsible AI. Concentrated venture funding and deep talent pools add further momentum.
Asia Pacific is the fastest-growing region, forecast to record a 35.10% CAGR between 2026 and 2031. China's national AI strategy directs significant subsidies toward autonomous manufacturing agents, while Japan and South Korea back smart-factory pilots to address labor shortages. The Gulf region is attracting bespoke agent solutions, and joint ventures such as CNTXT AI and Beam AI estimate a regional market value of USD 4.2-5.4 billion in 2025. Scalable cloud infrastructure and 5G rollouts make the region conducive to edge-deployed agents, expanding scope in logistics and retail. Europe combines strong ethics oversight with practical deployment in automotive, finance, and industrial settings. The EU AI Act requires transparency and risk management, guiding product design toward trustworthy outcomes. Software-defined architectures in vehicles place Europe at the forefront of in-car agents. The regional AI market could hit USD 235.5 billion by 2031 at a 26.3% CAGR, illustrating robust potential. Data sovereignty rules in healthcare slow adoption but also catalyze advances in privacy-preserving AI that may turn into exportable strengths.
- IBM Corporation
- Google LLC
- Microsoft Corporation
- Amazon Web Services Inc.
- Oracle Corporation
- SAP SE
- Salesforce Inc.
- SAS Institute Inc.
- Intel Corporation
- Aptiv PLC
- Nuance Communications
- Infosys Limited
- Fair Isaac Corporation (FICO)
- Fetch.ai Ltd.
- Affectiva Inc.
- Baidu Inc.
- Huawei Technologies Co. Ltd.
- Bosch Global Software Technologies
- SAPEON Inc.
- DataRobot Inc.
Additional Benefits:
- The market estimate (ME) sheet in Excel format
- 3 months of analyst support
TABLE OF CONTENTS
1 INTRODUCTION
- 1.1 Study Assumptions and Market Definition
- 1.2 Scope of the Study
2 RESEARCH METHODOLOGY
3 EXECUTIVE SUMMARY
4 MARKET LANDSCAPE
- 4.1 Market Overview
- 4.2 Market Drivers
- 4.2.1 Hyper-personalised Customer Engagement Needs in BFSI Driving Agent Adoption
- 4.2.2 Automotive OEM Shift to In-Vehicle Software-Defined Architectures in Europe
- 4.2.3 Surge in Multi-agent RL for Smart-Factory Optimisation in North Asia
- 4.2.4 Regulatory Mandates for Explainable AI in U.S. Federal Agencies
- 4.2.5 Rapid Scaling of Edge-Deployed Agents in 5G Private Networks
- 4.3 Market Restraints
- 4.3.1 Lack of Interoperability Standards Across Heterogeneous Agent Platforms
- 4.3.2 High Training-data Sovereignty Barriers in EU Healthcare
- 4.3.3 Energy-Efficiency Limits on On-device Inference for Mobile Agents
- 4.3.4 Talent Scarcity in Multi-agent Safety and Alignment Engineering
- 4.4 Value Chain Analysis
- 4.5 Regulatory and Standards Outlook
- 4.6 Technological Outlook
- 4.7 Porter's Five Forces
- 4.7.1 Bargaining Power of Suppliers
- 4.7.2 Bargaining Power of Buyers
- 4.7.3 Threat of New Entrants
- 4.7.4 Threat of Substitutes
- 4.7.5 Competitive Rivalry
- 4.8 Investment Analysis
- 4.9 Impact of Macroeconomic Trends on the Market
5 MARKET SIZE AND GROWTH FORECASTS (VALUE)
- 5.1 By Component
- 5.1.1 Solution
- 5.1.2 - Platforms
- 5.1.3 - Frameworks and Toolkits
- 5.1.4 Services
- 5.1.5 - Professional Services
- 5.1.6 - Managed Services
- 5.2 By Deployment Type
- 5.2.1 Cloud
- 5.2.2 On-Premises
- 5.3 By Autonomy Level
- 5.3.1 Reactive Agents
- 5.3.2 Deliberative Agents
- 5.3.3 Hybrid Agents
- 5.3.4 Cognitive Agents
- 5.4 By Organization Size
- 5.4.1 Small and Medium-sized Enterprises (SMEs)
- 5.4.2 Large Enterprises
- 5.5 By Industry Vertical
- 5.5.1 BFSI
- 5.5.2 IT and Telecom
- 5.5.3 Healthcare and Life Sciences
- 5.5.4 Manufacturing
- 5.5.5 Transportation and Mobility
- 5.5.6 Retail and E-commerce
- 5.5.7 Energy and Utilities
- 5.5.8 Others
- 5.6 By Geography
- 5.6.1 North America
- 5.6.1.1 United States
- 5.6.1.2 Canada
- 5.6.2 South America
- 5.6.2.1 Brazil
- 5.6.2.2 Rest of South America
- 5.6.3 Europe
- 5.6.3.1 Germany
- 5.6.3.2 United Kingdom
- 5.6.3.3 France
- 5.6.3.4 Nordics
- 5.6.3.5 Rest of Europe
- 5.6.4 Middle East
- 5.6.4.1 GCC
- 5.6.4.2 Turkey
- 5.6.4.3 Rest of Middle East
- 5.6.5 Africa
- 5.6.5.1 South Africa
- 5.6.5.2 Rest of Africa
- 5.6.6 Asia Pacific
- 5.6.6.1 China
- 5.6.6.2 Japan
- 5.6.6.3 South Korea
- 5.6.6.4 India
- 5.6.6.5 Rest of Asia
- 5.6.1 North America
6 COMPETITIVE LANDSCAPE
- 6.1 Market Concentration
- 6.2 Strategic Moves
- 6.3 Market Share Analysis
- 6.4 Company Profiles (includes Global level Overview, Market level overview, Core Segments, Financials as available, Strategic Information, Market Rank/Share for key companies, Products and Services, and Recent Developments)
- 6.4.1 IBM Corporation
- 6.4.2 Google LLC
- 6.4.3 Microsoft Corporation
- 6.4.4 Amazon Web Services Inc.
- 6.4.5 Oracle Corporation
- 6.4.6 SAP SE
- 6.4.7 Salesforce Inc.
- 6.4.8 SAS Institute Inc.
- 6.4.9 Intel Corporation
- 6.4.10 Aptiv PLC
- 6.4.11 Nuance Communications
- 6.4.12 Infosys Limited
- 6.4.13 Fair Isaac Corporation (FICO)
- 6.4.14 Fetch.ai Ltd.
- 6.4.15 Affectiva Inc.
- 6.4.16 Baidu Inc.
- 6.4.17 Huawei Technologies Co. Ltd.
- 6.4.18 Bosch Global Software Technologies
- 6.4.19 SAPEON Inc.
- 6.4.20 DataRobot Inc.
7 MARKET OPPORTUNITIES AND FUTURE OUTLOOK
- 7.1 White-space and Unmet-need Assessment

 面向家用電子電器的人工智慧自主代理市場:按產品類型、應用、最終用途、國家和地區分類-全球產業分析、市場規模、市場佔有率及2026年至2033年預測
 自主代理市場:按組件、自主性、部署模式、組織規模、最終用戶產業和應用程式分類-2026-2032年全球市場預測
 自主代理市場規模、佔有率和成長分析:按組件、部署類型、自主等級、組織規模、產業和地區分類-2026-2033年產業預測
 2026-2030年全球企業級人工智慧代理編配平台市場
 自主人工智慧平台市場預測至2034年-全球分析(按組件、技術、代理架構、交付方式、應用、最終用戶和地區分類)
 2026-2030年全球人工智慧代理平台市場
 代理AI平台自主人工智慧代理市場預測至2034年-全球分析(按組件、代理類型、技術、運作模式、應用、最終用戶和地區分類)
 2026年全球人工智慧(AI)集群控制站市場報告2026年全球自主代理平台市場報告