


 |
市場調查報告書
商品編碼
2115785
任務管理軟體:市場佔有率分析、產業趨勢與統計、成長預測(2026-2031)Task Management Software - Market Share Analysis, Industry Trends & Statistics, Growth Forecasts (2026 - 2031) |
||||||

※ 本網頁內容可能與最新版本有所差異。詳細情況請與我們聯繫。
據 Mordor Intelligence 稱,2025 年任務管理軟體市場價值為 12.7 億美元,預計到 2031 年將從 2026 年的 14.4 億美元成長至 26.6 億美元,預測期(2026-2031 年)的複合年成長率為 13.1%。
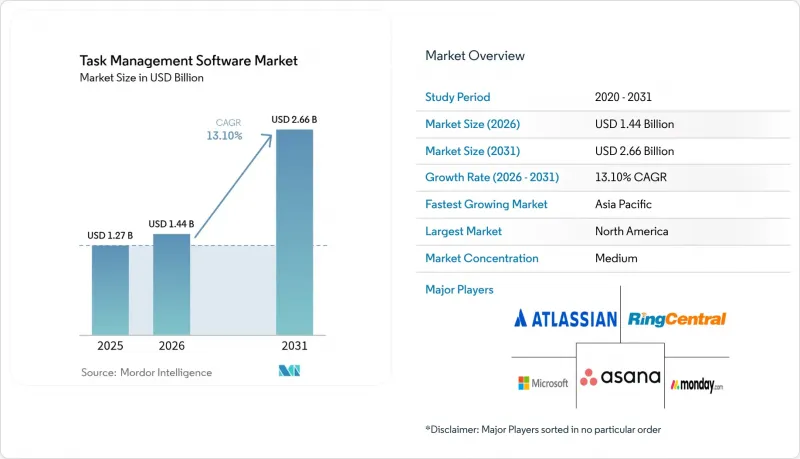
本報告按組件(軟體和服務)、組織規模(中小企業和大型企業)、部署類型(雲端和本地部署)、最終用戶行業(銀行、金融服務和保險、製造業等)、業務職能(行銷和創新、人力資源和招聘等)以及地區(北美等)進行細分。市場預測以美元計價。
全球任務管理軟體市場趨勢及洞察
中小企業快速採用雲端運算
訂閱式定價模式無需資本投入,自動續訂確保功能一致性,捆綁模組則擴大了用戶錢包佔有率,加速了中小企業大規模遷移到雲端。 2024 年印度的一項調查發現,半數中小企業將雲端基礎架構列為首要 IT 優先事項。 Salesforce 的報告顯示,52% 的中小企業已經在使用人工智慧工具,平均每月每用戶成本為 29 美元。這表明,雲端運算的經濟效益推動了高級功能的廣泛應用。供應商現在透過將 CRM、人力資源和會計功能與任務編配功能捆綁在一起,進一步加強了供應商鎖定。新興市場的中小企業擺脫了待開發區舊有系統的束縛,正在採用全端雲端套件進行全新部署。監管障礙雖然不多,但供應商正擴大開設區域資料中心,以遵守當地的隱私法規。
混合辦公和遠距辦公模式的擴展
如今,全球企業需要管理跨時區、使用不同裝置協作的員工,這進一步凸顯了集中式任務可見性的重要性。分散的工具集會導致重複工作、忽略依賴關係以及不必要的會議,從而阻礙生產力。現代平台將專案動態、聊天記錄和狀態指示器整合到單一螢幕中,減輕了管理員的工作量。即時儀錶板提供工作量平衡和風險環境的可見性,使管理人員能夠主動干預,而不是被動地「救火」。內建的環境智慧功能可自動擷取業務事件,減少負責人需要更新的資訊量,同時經營團隊可以獲得完整的稽核追蹤。非同步協作功能,例如評論主題和自動提醒,進一步簡化了交接流程。
SaaS 的無序擴張和整合疲勞
企業平均經營 50 個或更多雲端應用程式,60% 的 IT 領導者仍然每月添加新工具,這造成了生態系統的碎片化,削弱了效能提升的益處。連接如此多的獨立解決方案需要持續的 API 維護、授權管治和安全性增強,這會耗費寶貴的工程時間。由此產生的「整合疲勞」正推動供應商整合為多模組套件,以期降低總體擁有成本 (TCO)。到 2024 年,企業每年在重複的 SaaS 支出上浪費 1800 萬美元,一項針對首席資訊長 (CIO) 的調查顯示,幾乎所有受訪者都被敦促將簡化藍圖作為來年的首要任務。一個整合了聊天、文件管理和分析功能的綜合任務管理套件可以減少來回溝通造成的浪費,並集中管理資料沿襲。
細分市場分析
託管服務正以每年 16.8% 的速度成長,預計未來將繼續超越整體任務管理軟體市場,因為企業需要用於人工智慧驅動的工作流程設計和最佳化的承包解決方案。舊有應用程式。服務專家正在透過提供縮短獎勵實現時間的操作指南和將服務提供者激勵與生產力提升掛鉤的基於結果的合約來彌合這一差距。這種夥伴關係模式通常包含持續改進計劃,以根據不斷變化的工作模式和合規性要求調整編配引擎。
供應商目前正將變更管理培訓、管治審計和安全糾正措施納入年度契約,從而創造類似於許可證訂閱的經常性收入來源。這種以服務主導的部署模式有望提高平台留存率,因為客戶會將供應商資源深度整合到其營運團隊中。能夠將用戶互動數據無縫轉化為新產品功能的供應商,將在任務管理軟體市場中獲得長期競爭優勢。
大型企業在2025年佔據了54.60%的收入佔有率,這主要得益於其複雜的專案組合,這些專案組合需要強大的報告功能、單一登入和精細的存取控制。然而,預計到2031年,中小企業(SME)的複合年成長率將達到14.1%,因為直覺的註冊流程、經濟實惠的按用戶定價以及低程式碼的柔軟性正在縮小競爭格局。雲端原生架構降低了硬體支出並縮短了採購週期,使中小企業能夠在幾天內(而非幾季)部署企業級自動化系統。
隨著成長型企業在新組建的團隊中推廣使用任務管理軟體,預計到本十年末,中小企業 (SME) 的任務管理軟體市場規模將達到與大型企業市場相當的水平。提供免費增值或分級收費系統的供應商預計將透過將初始專案轉化為全組織範圍的部署,從而推動可預測的收入成長。社群論壇、範本庫和針對本地語言客製化的語言包將進一步加速新興經濟體的採用。
區域分析
預計到2025年,北美地區仍將佔總收入的37.10%。這是因為早期採用者正依靠人工智慧驅動的編配來滿足《薩班斯-奧克斯利法案》的審計要求,並緩解勞動力短缺的壓力。任務引擎與現有生產力套件的緊密整合正在加速其普及,因為大多數公司已經深度融入了主要供應商的生態系統。強大的創業融資和充滿活力的創業環境也推動了產品快速創新,這引起了尋求差異化競爭優勢的買家的共鳴。
亞太地區正以13.8%的複合年成長率成長,這主要得益於行動寬頻覆蓋範圍的擴大、政府主導的雲端運算推廣舉措以及面向中小企業的數位轉型計畫所營造的有利市場環境。印度和印尼等國的本土SaaS公司憑藉在地化的定價和語言支持,正發揮著主導作用;而中國的法規環境則有利於提供自主雲端解決方案的供應商。許多區域性公司正在徹底跳過傳統的本地部署,直接採用基於雲端或混合的任務引擎,以支援東南亞地區地域分散的供應鏈。
在歐洲,儘管需要遵守 GDPR、DORA 和新的人工智慧 (AI) 風險指南,導致實施難度增加,但市場仍保持穩定成長。在該地區運營的供應商正透過提供符合嚴格隱私標準的資料居住管理、客戶管理的加密金鑰以及持續的合規性報告來應對這些挑戰。在南歐,尋求遠端子公司營運視覺性的中型出口企業正在加速採用相關技術。在其他地區,拉丁美洲、中東和非洲仍在發展中,但前景廣闊,這得益於不斷擴展的雲端基礎設施以及公共部門現代化專案對結構化專案監控的早期需求。
其他好處:
- Excel格式的市場預測(ME)表
- 3個月的分析師支持
目錄
第1章:引言
- 研究假設和市場定義
- 調查範圍
第2章:調查方法
第3章執行摘要
第4章 市場狀況
- 市場概覽
- 市場促進因素
- 中小企業快速採用雲端運算
- 混合辦公和遠距辦公的激增催生了對集中式任務視覺化的需求。
- 針對受監管行業的行業特定任務套件
- 低程式碼/無程式碼平台及其任務引擎的興起
- 將任務分析整合到員工體驗 (EX) 雲端堆疊中。
- 強制性的 ESG 合規性和審計追蹤正在推動可追溯任務工作流程的發展。
- 市場限制因素
- SaaS 的無序擴張仍在繼續,導致整合過程出現疲勞感。
- 有關資料居住和主權的法規正在減緩多租戶模式的普及。
- 在根深蒂固的舊有系統的產業(製造業、公部門)中,變革管理存在慣性。
- 基於人工智慧的任務推薦正從可解釋性的角度接受審查。
- 產業價值/供應鏈分析
- 監理情勢
- 技術展望
- 宏觀經濟因素對市場的影響
- 波特五力分析
第5章 市場規模與成長預測
- 按組件
- 軟體
- 獨立任務管理應用程式
- 整合專案和業務管理套件
- 服務
- 專業(實施、諮詢)
- 託管服務
- 軟體
- 按組織規模
- 小型企業
- 大公司
- 部署模式
- 雲
- 公共雲端
- 私有雲端和混合雲端
- 現場
- 雲
- 按最終用戶行業分類
- BFSI
- 資訊科技/通訊
- 零售與電子商務
- 製造業
- 醫療保健和生命科學
- 政府/公共部門
- 旅遊、觀光和酒店
- 其他終端用戶產業(教育、媒體等)
- 業務職能
- 行銷與創新
- 人力資源/招聘
- 財會
- 銷售和客戶成功
- 按地區
- 北美洲
- 美國
- 加拿大
- 墨西哥
- 南美洲
- 巴西
- 阿根廷
- 智利
- 其他南美國家
- 歐洲
- 英國
- 德國
- 法國
- 義大利
- 西班牙
- 其他歐洲國家
- 亞太地區
- 中國
- 日本
- 印度
- 韓國
- 澳洲和紐西蘭
- 其他亞太國家
- 中東和非洲
- 中東
- 阿拉伯聯合大公國
- 沙烏地阿拉伯
- 土耳其
- 其他中東國家
- 非洲
- 南非
- 肯亞
- 奈及利亞
- 其他非洲國家
- 中東
- 北美洲
第6章 競爭情勢
- 市場集中度
- 市佔率分析
- 公司簡介
- Microsoft Corporation
- Atlassian Corporation Plc
- Asana, Inc.
- monday.com Ltd.
- Smartsheet Inc.
- Adobe Inc.(Workfront)
- RingCentral, Inc.
- Citrix Systems, Inc.(Wrike)
- Basecamp LLC
- ClickUp Inc.
- Quickbase, Inc.
- Redbooth, Inc.
- Upland Software, Inc.
- SAP SE
- Oracle Corporation(NetSuite)
- ServiceNow Inc.
- Zoho Corporation Pvt Ltd.(Zoho Projects)
- Airtable, Inc.
- Notion Labs, Inc.
- ProofHub LLC
第7章 市場機會與未來展望
According to Mordor Intelligence, the task management software market size was valued at USD 1.27 billion in 2025 and estimated to grow from USD 1.44 billion in 2026 to reach USD 2.66 billion by 2031, at a CAGR of 13.1% during the forecast period (2026-2031).
This report is Segmented by Component (Software, and Services), Organization Size (Small and Medium Enterprises, and Large Enterprises), Deployment Mode (Cloud, and On-Premises), End-User Industry (BFSI, Manufacturing, and More), Business Function (Marketing and Creative, HR and Recruiting, and More), and Geography (North America, and More). The Market Forecasts are Provided in Terms of Value (USD).
Global Task Management Software Market Trends and Insights
Rapid Adoption of Cloud by SMEs
Subscription pricing removes capital expense, automatic updates protect feature parity, and bundled modules increase wallet share, encouraging smaller firms to migrate en masse. A 2024 Indian survey showed half of SMEs ranking cloud infrastructure as the top IT priority. Salesforce reports that 52% of small businesses already use AI-enabled tools, paying a median USD 29 per user monthly, evidence that cloud economics have democratized advanced capabilities. Vendors now bundle CRM, HR, and accounting with task orchestration, deepening lock-in. Emerging-market SMEs, unburdened by legacy systems, adopt full-stack cloud suites in greenfield rollouts. Minimal regulatory friction exists, though providers increasingly open regional data centers to meet local privacy rules.
Expansion of Hybrid and Remote Workforces
Global firms now manage employees who collaborate across time zones and device types, which amplifies the need for unified task visibility. Fragmented tool stacks create duplicate work, missed dependencies, and unnecessary meetings that erode productivity gains. Modern platforms consolidate project feeds, chat threads, and status indicators into a single pane of glass that reduces administrative overhead for managers. Real-time dashboards surface workload balance and risk metrics, enabling proactive interventions rather than reactive fire-fighting. Embedded ambient intelligence captures work events automatically, so individual contributors update fewer fields while leadership still obtains complete audit trails. Asynchronous collaboration features such as comment threads and automated reminders further streamline hand-offs.
Persistent SaaS Sprawl and Integration Fatigue
Organizations juggle 50-plus cloud applications on average, and 60% of IT leaders still add new tools each month, creating sprawling ecosystems that drain performance gains. Connecting so many point solutions requires ongoing API maintenance, license governance, and security hardening that consume precious engineering hours. The resulting integration fatigue encourages vendor consolidation toward multi-module suites that promise lower total cost of ownership. Enterprises wasted USD 18 million annually on redundant SaaS spending in 2024, prompting nearly every CIO survey respondent to prioritize rationalization roadmaps over the next fiscal year. Comprehensive task management suites that incorporate chat, document management, and analytics reduce swivel-chair overhead and centralize data lineage.
Other drivers and restraints analyzed in the detailed report include:
- Vertical-Specific Task Suites for Regulated Industries
- Rise of Low-Code and No-Code Platforms
- Data-Residency and Sovereignty Regulations
For complete list of drivers and restraints, kindly check the Table Of Contents.
Segment Analysis
Managed services grew 16.8% annually and are expected to continue outpacing overall task management software market growth as enterprises seek turnkey delivery of AI-driven workflow design and optimization. Software packages still represented 64.10% revenue in 2025 because they provide the digital foundation, yet many buyers lack in-house teams to configure advanced rules, train machine learning models, and integrate legacy applications. Services specialists close this gap by offering playbooks that shorten time to value and outcome-based contracts that align provider incentives with productivity gains. The partnership model often includes continuous improvement programs that calibrate orchestration engines against evolving staffing patterns and compliance mandates.
Providers now bundle change-management training, governance audits, and security remediation into annual engagements, creating recurring revenue streams that rival license subscriptions. This service-led adoption pattern is expected to raise platform stickiness because clients embed vendor resources deep within operational teams. Vendors that can seamlessly convert engagement data into new product features will secure long-term competitive moats in the task management software market.
Large enterprises captured 54.60% 2025 revenue due to complex program portfolios that demand robust reporting, single sign-on, and granular permissions. Nonetheless, SMEs will expand at 14.1% CAGR through 2031 as intuitive onboarding, affordable per-seat pricing, and low-code flexibility level the competitive playing field. Cloud-native architectures eliminate hardware spend and shorten procurement cycles, helping smaller firms deploy enterprise-grade automation within days rather than quarters.
The task management software market size for the SME segment is projected to approach parity with the large-enterprise segment near the end of the decade as growing firms scale usage across newly formed teams. Vendors that nurture freemium or tiered offerings stand to convert initial projects into organization-wide deployments, driving predictable expansion revenue. Community forums, template libraries, and localized language packs further accelerate adoption in emerging economies.
Complete Report Scope:
- By Component
- Software
- Stand-alone Task Management Apps
- Integrated Project and Work-Management Suites
- Services
- Professional (Implementation, Consulting)
- Managed Services
- Software
- By Organization Size
- Small and Medium Enterprises
- Large Enterprises
- By Deployment Mode
- Cloud
- Public Cloud
- Private and Hybrid Cloud
- On-Premise
- Cloud
- By End-User Industry
- BFSI
- IT and Telecommunication
- Retail and eCommerce
- Manufacturing
- Healthcare and Life-Sciences
- Government and Public Sector
- Travel, Tourism and Hospitality
- Other End-User Industrys (Education, Media, etc.)
- By Business Function
- Marketing and Creative
- HR and Recruiting
- Finance and Accounting
- Sales and Customer Success
- By Geography
- North America
- United States
- Canada
- Mexico
- South America
- Brazil
- Argentina
- Chile
- Rest of South America
- Europe
- United Kingdom
- Germany
- France
- Italy
- Spain
- Rest of Europe
- Asia-Pacific
- China
- Japan
- India
- South Korea
- Australia and New Zealand
- Rest of Asia-Pacific
- Middle East and Africa
- Middle East
- United Arab Emirates
- Saudi Arabia
- Turkey
- Rest of Middle East
- Africa
- South Africa
- Kenya
- Nigeria
- Rest of Africa
- Middle East
- North America
Geography Analysis
North America retained 37.10% of 2025 revenue because early adopters rely on AI-augmented orchestration to satisfy Sarbanes-Oxley audit requirements and to mitigate worker shortage pressures. Tight integration between task engines and incumbent productivity suites accelerates rollout because most enterprises are already entrenched in large vendor ecosystems. Robust venture funding and a vibrant startup landscape also feed rapid product innovation cycles that resonate with buyers seeking competitive differentiation.
Asia Pacific is advancing at a 13.8% CAGR as improved mobile broadband coverage, government cloud incentives, and SME digitalization programs combine to create favorable market conditions. Countries such as India and Indonesia champion domestic SaaS champions that localize pricing and language, while China's regulatory environment favors providers with sovereign cloud options. Many regional businesses leapfrog legacy on-premise deployments altogether, adopting cloud or hybrid task engines that support geographically dispersed supply chains across Southeast Asia.
Europe maintains steady growth despite navigating GDPR, DORA, and emerging artificial-intelligence risk guidelines that raise implementation complexity. Vendors that operate within the region respond by offering data-residency controls, customer-managed encryption keys, and continuous compliance reporting that align with stringent privacy norms. Southern Europe is witnessing accelerated uptake among mid-market exporters who seek operational visibility across far-flung subsidiaries. Elsewhere, Latin America, the Middle East, and Africa remain nascent but promising as cloud infrastructure expands and public-sector modernization programs anchor early demand for structured project oversight.
- Microsoft Corporation
- Atlassian Corporation Plc
- Asana, Inc.
- monday.com Ltd.
- Smartsheet Inc.
- Adobe Inc. (Workfront)
- RingCentral, Inc.
- Citrix Systems, Inc. (Wrike)
- Basecamp LLC
- ClickUp Inc.
- Quickbase, Inc.
- Redbooth, Inc.
- Upland Software, Inc.
- SAP SE
- Oracle Corporation (NetSuite)
- ServiceNow Inc.
- Zoho Corporation Pvt Ltd. (Zoho Projects)
- Airtable, Inc.
- Notion Labs, Inc.
- ProofHub LLC
Additional Benefits:
- The market estimate (ME) sheet in Excel format
- 3 months of analyst support
TABLE OF CONTENTS
1 Introduction
- 1.1 Study Assumptions and Market Definition
- 1.2 Scope of the Study
2 Research Methodology
3 Executive Summary
4 Market Landscape
- 4.1 Market Overview
- 4.2 Market Drivers
- 4.2.1 Rapid Adoption of Cloud by SMEs
- 4.2.2 Explosion of Hybrid/Remote Workforces Requiring Unified Task Visibility
- 4.2.3 Vertical-Specific Task Suites for Regulated Industries
- 4.2.4 Rise of Low-Code/No-Code Platforms that Embed Task Engines
- 4.2.5 Bundling of Task Analytics into Employee-Experience (EX) Cloud Stacks
- 4.2.6 ESG Compliance and Audit-Trail Mandates Boosting Traceable Task Workflows
- 4.3 Market Restraints
- 4.3.1 Persistent Saas Sprawl Creating Integration Fatigue
- 4.3.2 Data-Residency and Sovereignty Regulations Slowing Multi-Tenant Adoption
- 4.3.3 Change-Management Inertia In Legacy-Heavy Verticals (Manufacturing, Public Sector)
- 4.3.4 AI-Generated Task Recommendations Facing Explainability Scrutiny
- 4.4 Industry Value / Supply-Chain Analysis
- 4.5 Regulatory Landscape
- 4.6 Technological Outlook
- 4.7 Impact of Macroeconomic Factors on the Market
- 4.8 Porter's Five Forces Analysis
- 4.8.1 Threat of New Entrants
- 4.8.2 Bargaining Power of Buyers
- 4.8.3 Bargaining Power of Suppliers
- 4.8.4 Threat of Substitutes
- 4.8.5 Competitive Rivalry
5 MARKET SIZE AND GROWTH FORECASTS (VALUE)
- 5.1 By Component
- 5.1.1 Software
- 5.1.1.1 Stand-alone Task Management Apps
- 5.1.1.2 Integrated Project and Work-Management Suites
- 5.1.2 Services
- 5.1.2.1 Professional (Implementation, Consulting)
- 5.1.2.2 Managed Services
- 5.1.1 Software
- 5.2 By Organization Size
- 5.2.1 Small and Medium Enterprises
- 5.2.2 Large Enterprises
- 5.3 By Deployment Mode
- 5.3.1 Cloud
- 5.3.1.1 Public Cloud
- 5.3.1.2 Private and Hybrid Cloud
- 5.3.2 On-Premise
- 5.3.1 Cloud
- 5.4 By End-User Industry
- 5.4.1 BFSI
- 5.4.2 IT and Telecommunication
- 5.4.3 Retail and eCommerce
- 5.4.4 Manufacturing
- 5.4.5 Healthcare and Life-Sciences
- 5.4.6 Government and Public Sector
- 5.4.7 Travel, Tourism and Hospitality
- 5.4.8 Other End-User Industrys (Education, Media, etc.)
- 5.5 By Business Function
- 5.5.1 Marketing and Creative
- 5.5.2 HR and Recruiting
- 5.5.3 Finance and Accounting
- 5.5.4 Sales and Customer Success
- 5.6 By Geography
- 5.6.1 North America
- 5.6.1.1 United States
- 5.6.1.2 Canada
- 5.6.1.3 Mexico
- 5.6.2 South America
- 5.6.2.1 Brazil
- 5.6.2.2 Argentina
- 5.6.2.3 Chile
- 5.6.2.4 Rest of South America
- 5.6.3 Europe
- 5.6.3.1 United Kingdom
- 5.6.3.2 Germany
- 5.6.3.3 France
- 5.6.3.4 Italy
- 5.6.3.5 Spain
- 5.6.3.6 Rest of Europe
- 5.6.4 Asia-Pacific
- 5.6.4.1 China
- 5.6.4.2 Japan
- 5.6.4.3 India
- 5.6.4.4 South Korea
- 5.6.4.5 Australia and New Zealand
- 5.6.4.6 Rest of Asia-Pacific
- 5.6.5 Middle East and Africa
- 5.6.5.1 Middle East
- 5.6.5.1.1 United Arab Emirates
- 5.6.5.1.2 Saudi Arabia
- 5.6.5.1.3 Turkey
- 5.6.5.1.4 Rest of Middle East
- 5.6.5.2 Africa
- 5.6.5.2.1 South Africa
- 5.6.5.2.2 Kenya
- 5.6.5.2.3 Nigeria
- 5.6.5.2.4 Rest of Africa
- 5.6.5.1 Middle East
- 5.6.1 North America
6 Competitive Landscape
- 6.1 Market Concentration
- 6.2 Market Share Analysis
- 6.3 Company Profiles (includes Global level Overview, Market level overview, Core Segments, Financials as available, Strategic Information, Market Rank/Share for key companies, Products and Services, and Recent Developments)
- 6.3.1 Microsoft Corporation
- 6.3.2 Atlassian Corporation Plc
- 6.3.3 Asana, Inc.
- 6.3.4 monday.com Ltd.
- 6.3.5 Smartsheet Inc.
- 6.3.6 Adobe Inc. (Workfront)
- 6.3.7 RingCentral, Inc.
- 6.3.8 Citrix Systems, Inc. (Wrike)
- 6.3.9 Basecamp LLC
- 6.3.10 ClickUp Inc.
- 6.3.11 Quickbase, Inc.
- 6.3.12 Redbooth, Inc.
- 6.3.13 Upland Software, Inc.
- 6.3.14 SAP SE
- 6.3.15 Oracle Corporation (NetSuite)
- 6.3.16 ServiceNow Inc.
- 6.3.17 Zoho Corporation Pvt Ltd. (Zoho Projects)
- 6.3.18 Airtable, Inc.
- 6.3.19 Notion Labs, Inc.
- 6.3.20 ProofHub LLC
7 MARKET OPPORTUNITIES AND FUTURE OUTLOOK
- 7.1 White-space and Unmet-Need Assessment

 任務管理軟體市場規模、佔有率、成長率、全球產業分析、區域趨勢以及 2026 年至 2034 年的預測。全球任務管理軟體市場規模、佔有率、趨勢和成長分析報告(2026-2034)
 微任務市場-2026-2032年全球市場預測
 任務管理軟體市場規模、佔有率和趨勢分析報告:按組件、部署模式、功能、最終用途、地區和細分市場預測(2026-2033 年)
 2026年全球飯店員工任務管理軟體市場報告任務管理軟體市場:按部署類型、組件和最終用戶行業分類 - 全球預測(2026-2032 年)工作管理軟體市場:部署模式、使用者類型、公司規模、功能、產業垂直領域、全球預測(2026-2032 年)