


 |
市場調查報告書
商品編碼
2115227
空氣品質監測:市場佔有率分析、產業趨勢與統計、成長預測(2026-2031)Air Quality Monitoring - Market Share Analysis, Industry Trends & Statistics, Growth Forecasts (2026 - 2031) |
||||||

※ 本網頁內容可能與最新版本有所差異。詳細情況請與我們聯繫。
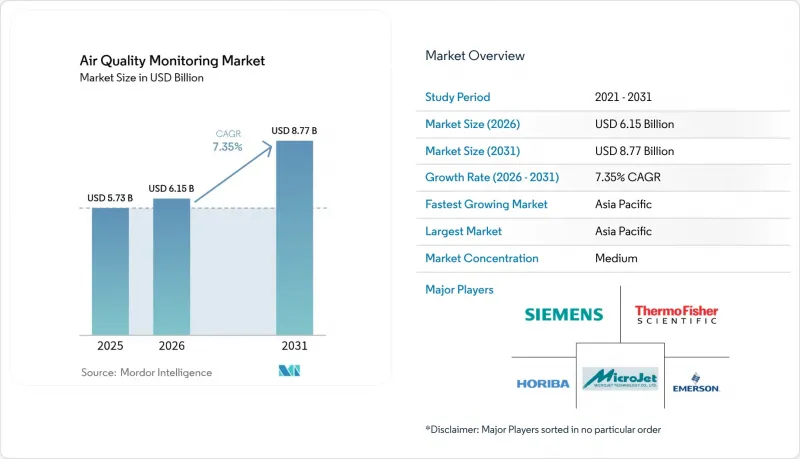
據 Mordor Intelligence 稱,2025 年空氣品質監測市場價值為 57.3 億美元,預計到 2031 年將達到 87.7 億美元,高於 2026 年的 61.5 億美元,預測期(2026-2031 年)的複合年成長率為 7.35%。
本報告按產品類型(室內監測器、室外監測器)、採樣方法(連續、其他)、組件(硬體、其他)、技術(氣體分析儀、其他)、污染物參數(顆粒污染物、其他)、部署模式(固定監測站、其他)、最終用戶行業(住宅和商業建築、其他)和地區(亞太地區、其他)進行分類。
全球空氣品質監測市場趨勢及洞察
亞洲智慧城市規劃中國家層級低成本感測器網路的部署
中國、印度和日本的大規模智慧城市預算正在支援高密度感測器的部署,以填補參考級觀測站稀疏造成的空間資料空白。中國的「藍天保衛宣傳活動」目前已涵蓋269個城市,利用數位融合降低資源密集型城市的PM2.5濃度。在海得拉巴,一個覆蓋4平方公里、由49個節點組成的網格展示了精細資料如何揭示傳統網路無法捕捉到的季節性PM變化模式。日本的研究人員正在將人工智慧演算法「AIRTrans」應用於衛星數據,以減少氣溶膠光學厚度的誤差,並指南地方合規計畫。大規模採購正在降低感測器價格並加速部署,同時也為政策制定者提供了製定有針對性的排放法規的依據。
歐盟強制要求企業披露 ESG 訊息,因此範圍 3 報告需要即時大氣數據。
目前,根據歐盟永續性報告指令,約有5萬家公司需要提交詳細的排放報告,這刺激了對持續空氣監測的投資,以支持範圍3的計算。銀行正在遵守歐洲銀行管理局(EBA)的規定,該規定將空氣品質風險納入信用評估。加州的《氣候變遷企業資料課責法案》以及澳洲計畫對資訊揭露違規行為處以的處罰,進一步加劇了全球趨勢,縮短了合規期限,並增加了對可直接與溫室氣體清單整合的自動化監測網路的需求。
由於低成本感測器的校準漂移和精度問題,大規模採購受到限制。
試驗測試表明,基於機器學習的重新校準可以將非分散紅外線(NDIR)二氧化碳感測器的精度提高65%,但不同模型之間仍然存在顯著差異,且顆粒物測量仍會受到溫度和濕度波動的影響。美國環保署(EPA)和歐洲的AirSensEUR專案等機構正在努力製定統一的校準協議,但在這些框架成熟之前,城市負責人通常會限制採購數量或將感測器保持在試驗運行模式。分位數映射和其他統計校正方法成本高且複雜,限制了它們在預算敏感地區的短期部署。
細分市場分析
預計到2025年,戶外分析設備將佔銷售額的62.40%。這主要歸因於聯邦法規強制要求24小時合規性檢查,例如美國環保署將PM2.5基準值降低至9微克/立方公尺。配備符合聯邦參考方法標準的儀器的固定監測站構成了政府網路空氣品質監測市場規模的基礎。此外,還有行動平台,包括大學開發的無人機,可以對廢氣成分進行3D採樣。
室內監測是成長最快的細分市場,年複合成長率高達 9.10%,這主要得益於疫情後對通風系統的要求以及健康建築認證的推動。攜帶式徽章和室內感測器可透過 BLE、Wi-Fi 或 LoRaWAN 連接,將數據傳輸到建築管理系統 (BMS) 控制面板,從而實現暖通空調 (HVAC) 的即時調節。將溫度、相對濕度 (RH)、顆粒物 (PM)、總揮發性有機化合物 (TVOC) 和二氧化碳濃度 (eCO2) 等功能整合到單一電路板上,降低了應用門檻,並促進了其在辦公室、教室、醫療機構和其他場所的廣泛應用。
連續測量系統佔據了空氣品質監測市場55.30%的佔有率,這主要得益於美國環保署(EPA)針對環氧乙烷連續排放監測系統(CEMS)制定的第19號性能規範以及與之並行實施的NSPS法規,後者要求以一分鐘為間隔自動採集數據。工業用戶更傾向於選擇具有自動零點調整和自校準功能的雷射連續分析儀,因為這些設備可以減少因維護造成的停機時間。
由於在高密度測量網路中具有成本優勢,連續檢測法正以每年 8.25% 的速度成長。安裝在石化廠邊界的盒式被動採樣器和安裝在都市區路燈上的電池供電微型站,即使在無法全天候供電的地區,也能收集到符合法律規定的瞬時數據,從而在無需大量資本投入的情況下擴展空間測量範圍。
即使到了 2025 年,硬體市佔率仍維持在 49.40%。合規項目仍指定化學冷光和 FDMS PM 模組來滿足法律規定的不確定性閾值。
該軟體和雲端平台預計年複合成長率達 9.55%,它利用人工智慧驅動的校準、預測和合規性儀表板,將原始數據轉化為有價值的洞察。阿拉伯聯合大公國國家空氣品質平台由 31 個監測站組成,其數據被輸入機器學習模型,用於預測未來三天的空氣污染事件,並為交通規劃提供資訊。此外,此多租戶 SaaS 架構簡化了企業範圍 3 的報告流程,並提高了訂閱用戶留存率。
區域分析
預計到2025年,亞太地區將佔全球營收的37.50%,並維持最高的成長率,到2031年年複合成長率(CAGR)將達到8.55%。這主要得益於涵蓋中國269個城市的「藍天網格」項目以及印度在地區層級開展的試點項目,這些項目揭示了局部污染的細微差異。日本的人工智慧衛星分析技術進一步提升了該地區的技術成熟度。製造業基礎的增強降低了感測器的成本,推動了全球供應鏈向該地區的轉移,同時也支持各國政府在短時間內部署數千個測量節點。
預計到2030年,中東將成為全球成長速度第二快的地區,這主要得益於各國政府致力於實現智慧城市居住目標。阿拉伯聯合大公國營運31個人工智慧監測站,並投資5億美元用於新型移動測量設備;沙烏地阿拉伯則在7,000家工業設施部署了連續排放監測設備。海上科考航行以及碳基感測器的研發,都凸顯了該地區在科學領域的雄心壯志。
北美地區仍以監管主導,主要依據美國環保署修訂後的PM2.5標準,該標準要求所有人口超過35萬的大都會圈每日報告空氣品質指數(AQI)。從不列顛哥倫比亞省到大西洋中部地區的野火正在推動感測器部署和緊急服務工具包在當地社區的開發。歐洲的成長則受到環境、社會和治理(ESG)法規以及2024年空氣品質指令的影響,該指令引入了超細顆粒物測量標準。南美洲和非洲已成功資金籌措試點項目,但通訊和電力基礎設施的匱乏阻礙了監測站向偏遠地區的部署。然而,在都市區,LoRaWAN和太陽能套件正開始彌補這一差距。
其他福利
- Excel格式的市場預測(ME)表
- 3個月的分析師支持
目錄
第1章:引言
- 研究假設和市場定義
- 調查範圍
第2章:調查方法
第3章執行摘要
第4章 市場狀況
- 市場概覽
- 市場促進因素
- 亞洲智慧城市計畫中低成本感測器網路的全國性部署
- 歐盟強制要求企業披露 ESG 訊息,因此範圍 3 報告需要即時大氣數據。
- 由於北美野火造成的煙霧排放量增加,對分散式PM感測器的需求也隨之增加。
- 新冠疫情後商業建築中空氣品質數據與暖通空調自動化系統的整合
- 美國環保署的 OOOa 法規要求對美國石化產業叢集周圍的圍籬線進行監測。
- 引入基於無人機的監測技術,用於石油和天然氣資產中的甲烷和揮發性有機化合物檢測。
- 市場限制因素
- 由於低成本感測器的校準漂移和精度問題,大規模採購受到限制。
- 非洲農村地區 5G/LPWAN 部署的延遲阻礙了偏遠地區的網路連線。
- 對於面臨融資困難的市政當局來說,高價標準級分析儀器的維護費用是一項重大負擔。
- 跨多個司法管轄區(EPA EQOA、歐盟 CEN)的複雜認證流程導致產品上市時間延長。
- 供應鏈分析
- 監理展望
- 技術展望
- 波特五力模型
第5章 市場規模與成長預測
- 依產品類型
- 室內顯示器(固定式/站式室內顯示器和可攜式/穿戴式式室內顯示器)
- 戶外顯示器(固定式/站式戶外顯示器和可攜式/移動式戶外顯示器)
- 透過抽樣方法
- 連續型
- 手動的
- 間歇性/被動式
- 按組件
- 硬體
- 感應器
- 採樣器泵浦
- 數據記錄分析儀
- 軟體雲端平台
- 服務(校準、維護、資料訂閱)
- 按污染物參數
- 粒狀物(PM1、PM2.5、PM10、超細懸浮微粒)
- 氣態污染物(氮氧化物、硫氧化物、氧化物、一氧化碳、揮發性有機化合物)
- 有毒金屬和放射性核種(鉛、汞、氡)
- 生物污染物(花粉、黴菌孢子、細菌)
- 透過技術
- 氣體分析儀(化學冷光、NDIR、FID)
- 粒子計數器(光學型、重力型和BETA射線衰減型)
- 光譜和雷射感測器(FTIR、UV-DOAS、LiDAR)
- 部署模式
- 固定監測站
- 可攜式檢測器
- 穿戴式空氣品質感測器
- 無人機搭載的行動平台
- 按最終用戶行業分類
- 住宅及商業建築
- 工業設施(發電、石油、天然氣、石化、採礦、冶金、離散製造、流程製造)
- 政府和學術研究
- 醫療機構
- 交通運輸和智慧基礎設施(機場、隧道、智慧城市網路)
- 按地區
- 北美洲
- 美國
- 加拿大
- 墨西哥
- 歐洲
- 英國
- 德國
- 法國
- 西班牙
- 北歐國家
- 俄羅斯
- 其他歐洲國家
- 亞太地區
- 中國
- 印度
- 日本
- 韓國
- 馬來西亞
- 泰國
- 印尼
- 越南
- 澳洲
- 其他亞太國家
- 南美洲
- 巴西
- 阿根廷
- 哥倫比亞
- 其他南美國家
- 中東和非洲
- 阿拉伯聯合大公國
- 沙烏地阿拉伯
- 南非
- 埃及
- 其他中東和非洲國家
- 北美洲
第6章 競爭情勢
- 市場集中度
- 策略趨勢(併購、聯盟、購電協議)
- 市場佔有率分析(主要公司的市場排名和佔有率)
- 公司簡介
- Thermo Fisher Scientific Inc.
- Teledyne Technologies Inc.
- Siemens AG
- Honeywell International Inc.
- Horiba Ltd.
- TSI Inc.
- Emerson Electric Co.
- 3M Company
- Merck KGaA
- Agilent Technologies Inc.
- Aeroqual Ltd.
- Vaisala Oyj
- ABB Ltd.
- Ametek Inc.
- ENVEA Group
- AlphaSense Ltd.
- Sensirion AG
- Bosch Sensortec GmbH
- Oizom Instruments Pvt Ltd.
- Kaiterra Inc.
- Breeze Technologies UG
- PurpleAir Inc.
- Ecotech Pty Ltd(ACOEM)
- Opsis AB
- FLIR Systems(Teledyne FLIR)
第7章 市場機會與未來展望
According to Mordor Intelligence, the air quality monitoring market size was valued at USD 5.73 billion in 2025 and estimated to grow from USD 6.15 billion in 2026 to reach USD 8.77 billion by 2031, at a CAGR of 7.35% during the forecast period (2026-2031).
This report is Segmented by Product Type (Indoor Monitor and Outdoor Monitor), Sampling Method (Continuous and More), Component (Hardware and More), Technology (Gas Analysers and More), Pollutant Parameter (Particulate Pollutants and More), Deployment Mode (Fixed Monitoring Stations and More), End-User Industry (Residential and Commercial Buildings and More), and Geography (Asia-Pacific and More).
Global Air Quality Monitoring Market Trends and Insights
National-level roll-outs of low-cost sensor networks in Asian smart-city programs
Extensive smart-city budgets across China, India, and Japan are underwriting dense sensor deployments that fill spatial data gaps left by sparse reference-grade stations. China's Blue Sky Protection Campaign now covers 269 cities and leverages digital integration to cut PM2.5 levels in resource-heavy municipalities.Hyderabad's 49-node grid spanning 4 km2 illustrates how granular data surfaces seasonal PM patterns missed by legacy networks.Japanese researchers apply AI algorithms-AIRTrans-to satellite inputs, lowering aerosol optical thickness errors and guiding local compliance programs. Bulk procurement volumes push sensor prices down, accelerating adoption and giving policymakers evidence to direct targeted emission controls.
Corporate ESG disclosure mandates in EU requiring real-time ambient data for Scope 3 reporting
Roughly 50,000 companies must now file granular emissions accounts under the EU Corporate Sustainability Reporting Directive, spurring investments in continuous ambient monitoring to support Scope 3 calculations. Banks follow European Banking Authority rules that embed air quality risks into credit assessments. California's Climate Corporate Data Accountability Act and Australia's incoming disclosure penalties reinforce the global trend, compressing compliance timelines and lifting demand for automated monitoring networks that integrate directly with greenhouse gas inventories.
Calibration-drift & accuracy issues of low-cost sensors limiting bulk procurements
Field trials show that machine-learning recalibration can improve NDIR CO2 sensor accuracy by 65%, yet inter-model variability remains wide, and temperature or humidity swings still skew particulate readings. Agencies such as the US EPA and European AirSensEUR project are drafting harmonized calibration protocols, but until those frameworks mature, city planners often cap purchase volumes or keep sensors in pilot mode. Quantile mapping and other statistical corrections add cost and complexity, tempering near-term uptake in budget-sensitive regions.
Other drivers and restraints analyzed in the detailed report include:
- Rise of wildfire smoke events in North America driving demand for distributed PM sensors
- Integration of AQ data into HVAC automation in commercial buildings post-COVID
- Delays in 5G/LPWAN roll-outs in rural Africa hindering remote-station connectivity
For complete list of drivers and restraints, kindly check the Table Of Contents.
Segment Analysis
Outdoor analyzers delivered 62.40% of 2025 revenues as federal rules, including the US EPA's stricter PM2.5 limit of 9 µg/m3, imposed round-the-clock compliance checks. Fixed stations equipped with Federal Reference Method instruments form the air quality monitoring market size cornerstone for government networks. Complementing them are mobile platforms, including university-developed drones that sample plume constituents in three-dimensional profiles.
Indoor monitors are the fastest risers, expanding at 9.10% CAGR by catering to post-pandemic ventilation mandates and healthy-building certifications. Portable badges and room sensors connect over BLE, Wi-Fi, or LoRaWAN, streaming data into BMS dashboards for real-time HVAC adjustments. Feature integration-temperature, RH, PM, TVOC, and eCO2 in one board-cuts deployment friction and enhances uptake across offices, classrooms, and healthcare settings.
Continuous systems account for 55.30% of the air quality monitoring market size, championed by EPA Performance Specification 19 for ethylene oxide CEMS and parallel NSPS logic that require automatic data capture at one-minute intervals. Industrial operators prefer laser-based continuous analyzers that auto-zero and self-calibrate, cutting maintenance downtime.
Continuous methods grow 8.25% annually thanks to their cost advantage for dense grids. Cartridge-based passive samplers at petrochemical fence lines and battery-powered mini-stations on urban lampposts gather legally defensible snapshots where 24 X 7 power is infeasible, broadening spatial coverage without heavy capital outlays.
Hardware retained a 49.40% share in 2025. Compliance projects still specify chemiluminescence or FDMS PM modules to match statutory uncertainty thresholds.
Software and cloud platforms, projected to scale 9.55% CAGR, transform raw signals into insights through AI-enabled calibration, forecasting, and compliance dashboards. The UAE's 31-station National Air Quality Platform feeds a machine-learning model that predicts three-day episodes and informs traffic planning. Multitenant SaaS architectures also simplify enterprise Scope 3 reporting, driving subscription stickiness.
Complete Report Scope:
- By Product Type
- Indoor Monitors (Fixed/Stationary Indoor and Portable/Wearable Indoor)
- Outdoor Monitors (Fixed/Stationary Outdoor and Portable/Mobile Outdoor)
- By Sampling Method
- Continuous
- Manual
- Intermittent/Passive
- By Component
- Hardware
- Sensors
- Samplers and Pumps
- Data Loggers and Analysers
- Software and Cloud Platforms
- Services (Calibration, Maintenance, Data Subscriptions)
- By Pollutant Parameter
- Particulate Pollutants (PM1, PM2.5, PM10, UFP)
- Gaseous Pollutants (NOx, SO?, O?, CO, VOCs)
- Toxic Metals and Radionuclides (Pb, Hg, Radon)
- Biological Pollutants (Pollen, Mould Spores, Bacteria)
- By Technology
- Gas Analysers (Chemiluminescence, NDIR, FID)
- Particle Counters (Optical, Gravimetric, Beta-attenuation)
- Spectroscopic and Laser-based Sensors (FTIR, UV-DOAS, LiDAR)
- By Deployment Mode
- Fixed Monitoring Stations
- Portable Detectors
- Wearable AQ Sensors
- Drone-mounted and Mobile Platforms
- By End-User Industry
- Residential and Commercial Buildings
- Industrial Facilities (Power Generation, Oil, Gas and Petrochemicals, Mining and Metallurgy, and Discrete and Process Manufacturing)
- Government and Academic Research
- Healthcare Facilities
- Transportation and Smart Infrastructure (Airports, Tunnels, Smart-City Networks)
- By Geography
- North America
- United States
- Canada
- Mexico
- Europe
- United Kingdom
- Germany
- France
- Spain
- Nordic Countries
- Russia
- Rest of Europe
- Asia-Pacific
- China
- India
- Japan
- South Korea
- Malaysia
- Thailand
- Indonesia
- Vietnam
- Australia
- Rest of Asia-Pacific
- South America
- Brazil
- Argentina
- Colombia
- Rest of South America
- Middle East and Africa
- United Arab Emirates
- Saudi Arabia
- South Africa
- Egypt
- Rest of Middle East and Africa
- North America
Geography Analysis
Asia-Pacific delivered 37.50% of 2025 revenue, and the fastest 8.55% CAGR through 2031, buoyed by China's 269-city Blue Sky grid and India's district-level pilots that reveal hyper-local pollution nuances. Japan's AI-powered satellite analytics further elevate regional technical sophistication. Manufacturing depth lowers per-unit sensor costs, tilting global supply chains toward the region and helping governments roll out thousands of nodes in compressed timeframes.
The Middle East is the second fastest growing region through 2030 due to sovereign commitments to smart-city livability targets. The UAE operates 31 AI-enabled stations and funds USD 500 million for new mobile units, while Saudi Arabia equips 7,000 industrial sites for continuous emissions checks. Offshore research cruises and carbon-based sensor R&D underscore regional scientific ambition.
North America remains regulation-driven, anchored by the EPA's updated PM2.5 standard that obliges daily Air Quality Index reporting in all metros above 350,000 residents. Wildfire smoke episodes spanning from British Columbia to the Mid-Atlantic catalyze community sensor deployments and emergency service toolkits. Europe's growth is shaped by ESG mandates and the 2024 Ambient Air Quality Directive that introduces ultrafine particle metrics. South America and Africa seize pilot funding yet face telecom and power gaps that slow remote-station rollout, though LoRaWAN and solar kits begin to close the divide in urban clusters.
- Thermo Fisher Scientific Inc.
- Teledyne Technologies Inc.
- Siemens AG
- Honeywell International Inc.
- Horiba Ltd.
- TSI Inc.
- Emerson Electric Co.
- 3M Company
- Merck KGaA
- Agilent Technologies Inc.
- Aeroqual Ltd.
- Vaisala Oyj
- ABB Ltd.
- Ametek Inc.
- ENVEA Group
- AlphaSense Ltd.
- Sensirion AG
- Bosch Sensortec GmbH
- Oizom Instruments Pvt Ltd.
- Kaiterra Inc.
- Breeze Technologies UG
- PurpleAir Inc.
- Ecotech Pty Ltd (ACOEM)
- Opsis AB
- FLIR Systems (Teledyne FLIR)
Additional Benefits:
- The market estimate (ME) sheet in Excel format
- 3 months of analyst support
TABLE OF CONTENTS
1 Introduction
- 1.1 Study Assumptions & Market Definition
- 1.2 Scope of the Study
2 Research Methodology
3 Executive Summary
4 Market Landscape
- 4.1 Market Overview
- 4.2 Market Drivers
- 4.2.1 National-level roll-outs of low-cost sensor networks in Asian smart-city programs
- 4.2.2 Corporate ESG disclosure mandates in EU requiring real-time ambient data for Scope 3 reporting
- 4.2.3 Rise of wildfire smoke events in North America driving demand for distributed PM sensors
- 4.2.4 Integration of AQ data into HVAC automation in commercial buildings post-COVID
- 4.2.5 Mandatory fence-line monitoring around US petrochemical clusters after EPA OOOOa rule
- 4.2.6 Deployment of drone-based monitoring for methane & VOC detection in O&G assets
- 4.3 Market Restraints
- 4.3.1 Calibration-drift & accuracy issues of low-cost sensors limiting bulk procurements
- 4.3.2 Delays in 5G/LPWAN roll-outs in rural Africa hindering remote-station connectivity
- 4.3.3 High maintenance cost of reference-grade analyzers for cash-strapped municipalities
- 4.3.4 Complex multi-jurisdictional certification (EPA EQOA, EU CEN) slowing time-to-market
- 4.4 Supply-Chain Analysis
- 4.5 Regulatory Outlook
- 4.6 Technological Outlook
- 4.7 Porters Five Forces
- 4.7.1 Bargaining Power of Suppliers
- 4.7.2 Bargaining Power of Buyers
- 4.7.3 Threat of New Entrants
- 4.7.4 Threat of Substitute Products & Services
- 4.7.5 Intensity of Competitive Rivalry
5 Market Size & Growth Forecasts
- 5.1 By Product Type
- 5.1.1 Indoor Monitors (Fixed/Stationary Indoor and Portable/Wearable Indoor)
- 5.1.2 Outdoor Monitors (Fixed/Stationary Outdoor and Portable/Mobile Outdoor)
- 5.2 By Sampling Method
- 5.2.1 Continuous
- 5.2.2 Manual
- 5.2.3 Intermittent/Passive
- 5.3 By Component
- 5.3.1 Hardware
- 5.3.2 Sensors
- 5.3.3 Samplers and Pumps
- 5.3.4 Data Loggers and Analysers
- 5.3.5 Software and Cloud Platforms
- 5.3.6 Services (Calibration, Maintenance, Data Subscriptions)
- 5.4 By Pollutant Parameter
- 5.4.1 Particulate Pollutants (PM1, PM2.5, PM10, UFP)
- 5.4.2 Gaseous Pollutants (NOx, SO?, O?, CO, VOCs)
- 5.4.3 Toxic Metals and Radionuclides (Pb, Hg, Radon)
- 5.4.4 Biological Pollutants (Pollen, Mould Spores, Bacteria)
- 5.5 By Technology
- 5.5.1 Gas Analysers (Chemiluminescence, NDIR, FID)
- 5.5.2 Particle Counters (Optical, Gravimetric, Beta-attenuation)
- 5.5.3 Spectroscopic and Laser-based Sensors (FTIR, UV-DOAS, LiDAR)
- 5.6 By Deployment Mode
- 5.6.1 Fixed Monitoring Stations
- 5.6.2 Portable Detectors
- 5.6.3 Wearable AQ Sensors
- 5.6.4 Drone-mounted and Mobile Platforms
- 5.7 By End-User Industry
- 5.7.1 Residential and Commercial Buildings
- 5.7.2 Industrial Facilities (Power Generation, Oil, Gas and Petrochemicals, Mining and Metallurgy, and Discrete and Process Manufacturing)
- 5.7.3 Government and Academic Research
- 5.7.4 Healthcare Facilities
- 5.7.5 Transportation and Smart Infrastructure (Airports, Tunnels, Smart-City Networks)
- 5.8 By Geography
- 5.8.1 North America
- 5.8.1.1 United States
- 5.8.1.2 Canada
- 5.8.1.3 Mexico
- 5.8.2 Europe
- 5.8.2.1 United Kingdom
- 5.8.2.2 Germany
- 5.8.2.3 France
- 5.8.2.4 Spain
- 5.8.2.5 Nordic Countries
- 5.8.2.6 Russia
- 5.8.2.7 Rest of Europe
- 5.8.3 Asia-Pacific
- 5.8.3.1 China
- 5.8.3.2 India
- 5.8.3.3 Japan
- 5.8.3.4 South Korea
- 5.8.3.5 Malaysia
- 5.8.3.6 Thailand
- 5.8.3.7 Indonesia
- 5.8.3.8 Vietnam
- 5.8.3.9 Australia
- 5.8.3.10 Rest of Asia-Pacific
- 5.8.4 South America
- 5.8.4.1 Brazil
- 5.8.4.2 Argentina
- 5.8.4.3 Colombia
- 5.8.4.4 Rest of South America
- 5.8.5 Middle East and Africa
- 5.8.5.1 United Arab Emirates
- 5.8.5.2 Saudi Arabia
- 5.8.5.3 South Africa
- 5.8.5.4 Egypt
- 5.8.5.5 Rest of Middle East and Africa
- 5.8.1 North America
6 Competitive Landscape
- 6.1 Market Concentration
- 6.2 Strategic Moves (M&A, Partnerships, PPAs)
- 6.3 Market Share Analysis (Market Rank/Share for key companies)
- 6.4 Company Profiles (includes Global level Overview, Market level overview, Core Segments, Financials as available, Strategic Information, Products & Services, and Recent Developments)
- 6.4.1 Thermo Fisher Scientific Inc.
- 6.4.2 Teledyne Technologies Inc.
- 6.4.3 Siemens AG
- 6.4.4 Honeywell International Inc.
- 6.4.5 Horiba Ltd.
- 6.4.6 TSI Inc.
- 6.4.7 Emerson Electric Co.
- 6.4.8 3M Company
- 6.4.9 Merck KGaA
- 6.4.10 Agilent Technologies Inc.
- 6.4.11 Aeroqual Ltd.
- 6.4.12 Vaisala Oyj
- 6.4.13 ABB Ltd.
- 6.4.14 Ametek Inc.
- 6.4.15 ENVEA Group
- 6.4.16 AlphaSense Ltd.
- 6.4.17 Sensirion AG
- 6.4.18 Bosch Sensortec GmbH
- 6.4.19 Oizom Instruments Pvt Ltd.
- 6.4.20 Kaiterra Inc.
- 6.4.21 Breeze Technologies UG
- 6.4.22 PurpleAir Inc.
- 6.4.23 Ecotech Pty Ltd (ACOEM)
- 6.4.24 Opsis AB
- 6.4.25 FLIR Systems (Teledyne FLIR)
7 Market Opportunities & Future Outlook
- 7.1 White-space & Unmet-Need Assessment

 大氣氮氧化物監測儀市場規模、佔有率和成長分析:按技術、安裝類型、應用、最終用戶、連接方式和地區分類-2026-2033年產業預測
 穩健型空氣品質監測儀市場:全球市場預測(2026-2032 年)
 空氣品質監測市場規模及預測(2021-2034年)、全球及區域佔有率、趨勢及成長機會分析報告:按組件、產品類型、部署模式、採樣方法、最終用戶產業及地區分類
 居家醫療市場:2034 年區域預測—按服務類型、護理交付模式、技術整合、病患人口統計特徵、支付和報銷模式、最終用戶和地區分類的全球分析
 2026-2030年全球空氣品質監測器市場空氣品質監測系統市場:2026-2032年全球市場預測(依產品類型、污染物類型、採樣方法、組件、應用及通路分類)
 全球空氣品質監測系統市場:依污染物、產品、最終用戶、採樣方法及地區分類-預測至2031年
 空氣品質監測系統市場:規模、佔有率、成長率、全球產業分析、區域分析與未來預測(2026-2034)
 臭氧檢測儀市場 - 全球產業規模、佔有率、趨勢、機會、預測:按產品、組件、應用、地區和競爭對手分類,2021-2031年
 2026年全球農業應用人工智慧市場報告