


 |
市場調查報告書
商品編碼
2115218
廢氣回收系統:市場佔有率分析、產業趨勢與統計、成長預測(2026-2031 年)Flare Gas Recovery System - Market Share Analysis, Industry Trends & Statistics, Growth Forecasts (2026 - 2031) |
||||||

※ 本網頁內容可能與最新版本有所差異。詳細情況請與我們聯繫。
據 Mordor Intelligence 稱,廢氣回收系統的市場規模預計在 2026 年達到 39.7 億美元,高於 2025 年的 36.7 億美元,預計到 2031 年將達到 58.4 億美元。
預計 2026 年至 2031 年的複合年成長率為 8.07%。
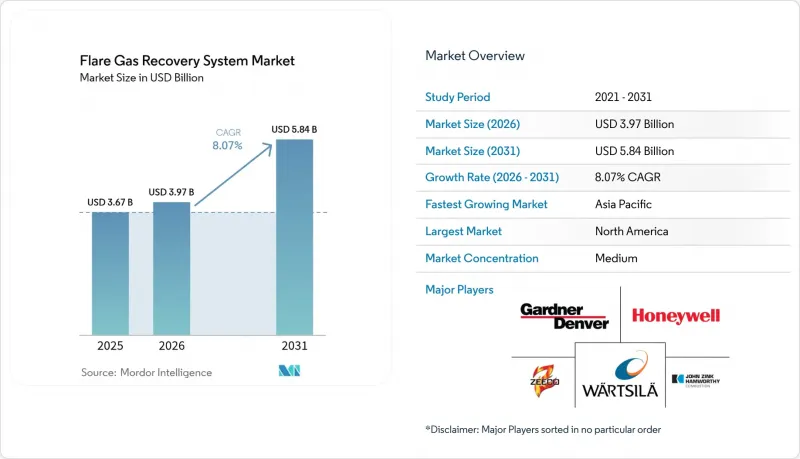
本報告按技術(僅壓縮系統、膜分離等)、組件(壓縮機和鼓風機、儀器和控制系統等)、處理能力範圍(小於 1 MMSCFD、15 MMSCFD 或以上等)、應用(下游、LNG 和天然氣加工廠、其他)和地區(北美、歐洲、亞太地區、南美、其他)進行分類。
全球廢氣回收系統市場趨勢及洞察
加強全球甲烷排放法規
監管機構已從自願性指南轉向具有約束力的規則,並逐步提高罰款金額。美國環保署 (EPA) 的 NSPS 000b 規定,每噸甲烷排放罰款 900 至 1500 美元,而歐盟則強制要求每季提交洩漏檢測報告。加州修訂後的法律對屢次違規行為處以每天 4 萬美元的罰款,並要求在項目設計階段而非違規發生後安裝廢氣回收系統。投資者在股票估值中使用甲烷排放強度指標,因此安裝回收設備對於資金籌措至關重要。
增加液化天然氣和浮動液化天然氣項目
亞太地區的液化天然氣產能正快速擴張。卡達的「聯合蒸發氣」計畫透過整合回收設備,實現了99.5%的天然氣利用率。新堡壘能源公司的模組化「快速液化天然氣」裝置可處理0.5至2.0百萬標準立方英尺/天的廢氣,即使在小規模天然氣田也展現出經濟可行性。 2024年獲準的12艘浮式液化天然氣運輸船需要緊湊型、適用於海上作業的膜組件和壓縮機,這將為長期需求奠定基礎。
超成熟油田面臨高資本支出(CAPEX)和低價值聯產氣
報廢的海上平檯面臨產量下降和天然氣價格低迷的雙重困境,使得部署造價在200萬至500萬美元之間的小規模裝置難以獲得經濟效益。空間限制往往會使安裝成本翻倍。雖然平台共享方案可以減輕負擔,但它們依賴複雜的商業協議以及資產剩餘壽命較短的問題。
細分市場分析
到2025年,由於其可靠性高且初始成本低,僅壓縮式系統在廢氣回收系統中仍將保持45.60%的市場佔有率。同時,膜分離技術預計將以12.18%的複合年成長率成為所有技術中成長最快的。這一轉變歸因於日益嚴格的管道規範以及新一代聚合物能夠承受酸性氣體流動。低溫冷凝技術是超高純度應用領域的利基技術,但面臨高能耗的挑戰。吸收和吸附法在硫化氫含量高的油田中正穩步地得到應用。
結合壓縮和薄膜技術的混合解決方案正日益受到關注,因為它們能夠幫助營運商最佳化資本支出 (CAPEX),同時實現更高的回收率。 MTR 的 FuelSep™ 系統於 2024 年在 Eagle Ford 油田投入使用,成功回收並轉售了 C3+ 液體,與傳統撬裝設備相比,能耗降低了 20%。隨著製造商推出能夠適應氣體品質變化的模組化濾芯,預計到 2031 年,混合廢氣回收系統的市場規模將以超過 8.07% 的整體平均成長速度成長。
預計到2025年,壓縮機和鼓風機將佔銷售額的39.60%,這表明它們在產生吸氣和排氣壓力方面發揮著至關重要的作用。然而,隨著設施從手動操作閥門過渡到由雲端分析控制的自主迴路,預計到2031年,儀器和控制系統將以12.05%的複合年成長率實現最高成長。貝克休斯公司的「flare.IQ」使操作人員能夠即時監控98%的燃燒效率,這項功能目前已被多個司法管轄區強制要求。雖然蒸氣回收塔和分離罐的銷售量與市場成長保持同步,但在氣候寒冷的地區,熱交換器正擴大被更節能的冷卻器機組所取代。
區域分析
北美地區佔據廢氣回收系統市場38.70%的佔有率,這得益於美國環保署(EPA)的監管、頁岩氣基礎設施以及便利的服務網路。然而,2024年二疊紀盆地天然氣價格間歇性為負,迫使一些業者選擇燃燒而非出售天然氣,凸顯了加強監管的必要性。加拿大的「清潔能源法規」以及墨西哥新興的頁岩氣資源,儘管發展時間表各不相同,但都為市場提供了進一步成長的空間。
亞太地區是成長最快的地區,年複合成長率達11.35%。中國正在維修煉油廠,採用碳捕獲和廢氣回收系統;印度則在投資氣化和LNG接收站。東南亞的浮式液化天然氣項目以及日本和韓國在緊湊型系統方面的創新正在推動持續成長。政府為減少甲烷排放而提供的稅收優惠政策進一步縮短了投資回收期。
在歐洲,在歐盟甲烷戰略和碳定價機制的推動下,回收利用正在穩步推進。北海油田業者正在權衡翻新成本與維修義務,但由於歐盟排放交易體系(EU ETS)配額如今已成為重要的收入來源,許多業者仍在推動回收。德國針對運輸燃料的溫室氣體(THG)配額制度也為從回收氣體創造價值開闢了新的途徑。
在中東和非洲地區,天然氣開採呈現選擇性成長的趨勢。沙烏地阿拉伯和阿拉伯聯合大公國(阿拉伯聯合大公國)正透過將火炬氣回收要求納入特許經營協議來加快部署。奈及利亞修訂後的商業化計畫和伊拉克的天然氣回收舉措(GGIP)確保了大規模的回收量。然而,資金籌措和在地採購義務可能會減緩採購速度。
其他好處:
- Excel格式的市場預測(ME)表
- 3個月的分析師支持
目錄
第1章:引言
- 研究假設和市場定義
- 調查範圍
第2章:調查方法
第3章執行摘要
第4章 市場狀況
- 市場概覽
- 市場促進因素
- 全球範圍內加強甲烷排放法規
- 液化天然氣和浮動液化天然氣計畫增加
- 將火炬燃燒信用與ESG資金籌措掛鉤的碳定價機制。
- 與小規模藍氫生產設施(合成氣供應)的整合
- 國營石油公司(NOC)生產分成合約中的強制性火炬減排目標
- 人工智慧驅動的廢氣路徑預測
- 市場限制因素
- 超成熟油田資本支出高,聯產氣價值低。
- 頁岩層中低溫級天然氣的供應有限。
- 碳權額度價格下限的不確定性(監理風險)
- 老舊海上平台缺乏維修空間
- 供應鏈分析
- 監理情勢
- 技術展望
- 波特五力模型
第5章 市場規模與成長預測
- 透過技術
- 僅壓縮系統
- 膜分離
- 低溫冷凝
- 吸收/吸附
- 混合式(例如,壓縮+膜)
- 按組件
- 壓縮機和鼓風機
- 蒸氣回收塔
- 脫殼滾筒和分離器
- 熱交換器/冷卻器
- 儀器和控制系統
- 按生產能力範圍分類
- 1. 小於百萬標準立方英尺/天
- 1~5 MMSCFD
- 5~15 MMSCFD
- 15 MMSCFD 或更高
- 透過使用
- 上游領域(陸地和海洋)
- 下游產業(煉油廠和石化廠)
- 液化天然氣和天然氣處理廠
- 其他(天然氣儲存、終端)
- 按地區
- 北美洲
- 美國
- 加拿大
- 墨西哥
- 歐洲
- 德國
- 英國
- 法國
- 義大利
- 北歐國家
- 俄羅斯
- 其他歐洲國家
- 亞太地區
- 中國
- 印度
- 日本
- 韓國
- 東南亞國協
- 其他亞太國家
- 南美洲
- 巴西
- 阿根廷
- 其他南美國家
- 中東和非洲
- 沙烏地阿拉伯
- 阿拉伯聯合大公國
- 卡達
- 南非
- 埃及
- 奈及利亞
- 其他中東和非洲國家
- 北美洲
第6章 競爭情勢
- 市場集中度
- 策略趨勢(併購、聯盟、購電協議)
- 市場佔有率分析(主要公司的市場排名和佔有率)
- 公司簡介
- John Zink Hamworthy Combustion LLC
- Zeeco Inc.
- Honeywell UOP
- Gardner Denver(Ingersoll Rand)
- Wartsila Oyj Abp
- Transvac Systems Ltd
- Aereon(ION Clean Air)
- Schlumberger Endura
- Air Liquide Global E&C
- MAN Energy Solutions
- Eisenmann Environmental
- SoEnergy International
- Zephyr Gas Recovery
- KPS Holdings
- Envent Corporation
- Cimarron Energy Inc.
- Cool Sorpt
- Sundyne LLC
- Ramesa Sistemas
- PetroGas Systems
第7章 市場機會與未來展望
According to Mordor Intelligence, flare gas recovery system market size in 2026 is estimated at USD 3.97 billion, growing from 2025 value of USD 3.67 billion with 2031 projections showing USD 5.84 billion, growing at 8.07% CAGR over 2026-2031.
This report is Segmented by Technology (Compression-Only Systems, Membrane Separation, and More), Component (Compressors and Blowers, Instrumentation and Control Systems, and More), Capacity Range (Below 1 MMSCFD, Above 15 MMSCFD, and More), Application (Downstream, Downstream, LNG and Gas-Processing Plants, and Others), and Geography (North America, Europe, Asia-Pacific, South America, and More).
Global Flare Gas Recovery System Market Trends and Insights
Stricter global methane-emission penalties
Regulators shifted from voluntary guidelines to binding rules with escalating fees. The US EPA's NSPS OOOOb requires methane fees of USD 900-1,500 per metric ton, while the EU mandates quarterly leak-detection reports. California's amendments add a USD 40,000-per-day liability for repeat infractions, ensuring that flare gas recovery system market uptake now occurs during project design rather than after violations. Investors use methane intensity metrics in equity valuations, making recovery units essential for capital access.
Rising LNG liquefaction & FLNG projects
Asia-Pacific LNG capacity is expanding rapidly. Qatar's Joint Boil-Off Gas project integrates recovery units to reach 99.5% gas utilization. Modular "Fast LNG" plants from New Fortress Energy process 0.5-2.0 MMSCFD of waste gas, proving economically viable for small fields. Twelve FLNG vessels sanctioned in 2024 require compact, offshore-rated membranes and compressors, anchoring long-term demand.
High CAPEX vs. low associated-gas value in ultra-mature fields
Late-life offshore platforms face declining production and modest gas prices, making USD 2-5 million small-scale units hard to justify. Space constraints often double installation costs. Joint-platform sharing schemes ease the burden but rely on complex commercial agreements and short remaining asset lives.
Other drivers and restraints analyzed in the detailed report include:
- Carbon-pricing schemes linking flare credits to ESG funding
- Integration with small-scale blue-hydrogen units
- Limited cryogenic-grade gas quality in shale plays
For complete list of drivers and restraints, kindly check the Table Of Contents.
Segment Analysis
Compression-only systems retained 45.60% of the flare gas recovery system market share in 2025, owing to proven reliability and lower upfront costs. Membrane separation, however, is estimated to record a 12.18% CAGR, the fastest among technologies. The shift stems from tighter pipeline specifications and the ability of next-generation polymers to withstand sour-gas streams. Cryogenic condensation is a niche in ultra-high-purity applications but suffers from elevated energy demand. Absorption and adsorption maintain steady uptake in H2S-rich fields.
Hybrid solutions blending compression and membranes are gaining traction because operators optimize capex while achieving higher recovery yields. MTR's FuelSep(TM) system, deployed in the Eagle Ford in 2024, demonstrated 20% lower energy use than legacy skids while capturing C3+ liquids for resale. The flare gas recovery system market size for hybrid units is forecast to expand above the overall 8.07% baseline through 2031 as manufacturers introduce modular cartridges adaptable to changing gas quality.
Compressors and blowers dominated 39.60% of revenue in 2025, reflecting their indispensable role in creating suction and discharge pressure. Yet instrumentation and control systems will post the highest 12.05% CAGR to 2031 as facilities migrate from manual valves to autonomous loops governed by cloud analytics. Baker Hughes' flare.IQ enables operators to verify 98% combustion efficiency in real time, a capability now mandatory in several jurisdictions. Vapour recovery towers and knock-out drums follow market growth, while heat exchangers face substitution by energy-efficient chiller packages in low-temperature climates.
Complete Report Scope:
- By Technology
- Compression-only Systems
- Membrane Separation
- Cryogenic Condensation
- Absorption/Adsorption
- Hybrid (e.g., Compression + Membrane)
- By Component
- Compressors and Blowers
- Vapour Recovery Towers
- Knock-Out Drums and Separators
- Heat Exchangers/Chillers
- Instrumentation and Control Systems
- By Capacity Range
- Below 1 MMSCFD
- 1 to 5 MMSCFD
- 5 to 15 MMSCFD
- Above 15 MMSCFD
- By Application
- Upstream (Onshore and Offshore)
- Downstream (Refineries and Petrochemicals)
- LNG and Gas-processing Plants
- Others (Gas Storage, Terminals)
- By Geography
- North America
- United States
- Canada
- Mexico
- Europe
- Germany
- United Kingdom
- France
- Italy
- NORDIC Countries
- Russia
- Rest of Europe
- Asia-Pacific
- China
- India
- Japan
- South Korea
- ASEAN Countries
- Rest of Asia-Pacific
- South America
- Brazil
- Argentina
- Rest of South America
- Middle East and Africa
- Saudi Arabia
- United Arab Emirates
- Qatar
- South Africa
- Egypt
- Nigeria
- Rest of Middle East and Africa
- North America
Geography Analysis
North America holds 38.70% of the flare gas recovery system market size, supported by EPA rules, shale infrastructure, and readily available service networks. However, intermittent negative gas prices in the Permian Basin during 2024 prompted some operators to flare rather than sell, underlining the need for stricter enforcement. Canada's Clean Electricity Regulations and Mexico's emerging shale resources present incremental upside, though timelines diverge.
Asia-Pacific is the fastest-growing region at 11.35% CAGR. China is retrofitting refineries with carbon-capture and flare-recovery units, while India invests in gasification and LNG terminals. Southeast Asian FLNG projects and Japan and South Korea's compact-system innovations underpin sustained momentum. Government policies offering tax breaks for methane abatement further reduce payback times.
Europe shows steady uptake driven by the EU methane strategy and carbon pricing. Operators in the North Sea weigh retrofit costs against decommissioning obligations, yet many proceed because EU ETS allowances now represent a significant revenue stream. Germany's THG quota system for transport fuels creates another value pathway for recovered gas.
Middle East & Africa record selective growth. Saudi Arabia and UAE bundle flare-recovery requirements into concession agreements, ensuring early-phase deployment. Nigeria's updated commercialization programme and Iraq's GGIP establish large capture volumes. Nevertheless, financing and local-content mandates can slow procurement.
- John Zink Hamworthy Combustion LLC
- Zeeco Inc.
- Honeywell UOP
- Gardner Denver (Ingersoll Rand)
- Wartsila Oyj Abp
- Transvac Systems Ltd
- Aereon (ION Clean Air)
- Schlumberger Endura
- Air Liquide Global E&C
- MAN Energy Solutions
- Eisenmann Environmental
- SoEnergy International
- Zephyr Gas Recovery
- KPS Holdings
- Envent Corporation
- Cimarron Energy Inc.
- Cool Sorpt
- Sundyne LLC
- Ramesa Sistemas
- PetroGas Systems
Additional Benefits:
- The market estimate (ME) sheet in Excel format
- 3 months of analyst support
TABLE OF CONTENTS
1 Introduction
- 1.1 Study Assumptions & Market Definition
- 1.2 Scope of the Study
2 Research Methodology
3 Executive Summary
4 Market Landscape
- 4.1 Market Overview
- 4.2 Market Drivers
- 4.2.1 Stricter global methane-emission penalties
- 4.2.2 Rising LNG liquefaction & FLNG projects
- 4.2.3 Carbon-pricing schemes linking flare credits to ESG funding
- 4.2.4 Integration with small-scale blue-hydrogen units (syngas feed)
- 4.2.5 Mandatory flare-reduction targets in NOC production-sharing contracts
- 4.2.6 AI-enabled predictive vent-gas routing
- 4.3 Market Restraints
- 4.3.1 High CAPEX vs. low associated-gas value in ultra-mature fields
- 4.3.2 Limited cryogenic-grade gas quality in shale plays
- 4.3.3 Uncertain carbon-credit price floors (regulatory risk)
- 4.3.4 Scarcity of retrofit space on ageing offshore platforms
- 4.4 Supply-Chain Analysis
- 4.5 Regulatory Landscape
- 4.6 Technological Outlook
- 4.7 Porter's Five Forces
- 4.7.1 Bargaining Power of Suppliers
- 4.7.2 Bargaining Power of Buyers
- 4.7.3 Threat of New Entrants
- 4.7.4 Threat of Substitutes
- 4.7.5 Competitive Rivalry
5 Market Size & Growth Forecasts
- 5.1 By Technology
- 5.1.1 Compression-only Systems
- 5.1.2 Membrane Separation
- 5.1.3 Cryogenic Condensation
- 5.1.4 Absorption/Adsorption
- 5.1.5 Hybrid (e.g., Compression + Membrane)
- 5.2 By Component
- 5.2.1 Compressors and Blowers
- 5.2.2 Vapour Recovery Towers
- 5.2.3 Knock-Out Drums and Separators
- 5.2.4 Heat Exchangers/Chillers
- 5.2.5 Instrumentation and Control Systems
- 5.3 By Capacity Range
- 5.3.1 Below 1 MMSCFD
- 5.3.2 1 to 5 MMSCFD
- 5.3.3 5 to 15 MMSCFD
- 5.3.4 Above 15 MMSCFD
- 5.4 By Application
- 5.4.1 Upstream (Onshore and Offshore)
- 5.4.2 Downstream (Refineries and Petrochemicals)
- 5.4.3 LNG and Gas-processing Plants
- 5.4.4 Others (Gas Storage, Terminals)
- 5.5 By Geography
- 5.5.1 North America
- 5.5.1.1 United States
- 5.5.1.2 Canada
- 5.5.1.3 Mexico
- 5.5.2 Europe
- 5.5.2.1 Germany
- 5.5.2.2 United Kingdom
- 5.5.2.3 France
- 5.5.2.4 Italy
- 5.5.2.5 NORDIC Countries
- 5.5.2.6 Russia
- 5.5.2.7 Rest of Europe
- 5.5.3 Asia-Pacific
- 5.5.3.1 China
- 5.5.3.2 India
- 5.5.3.3 Japan
- 5.5.3.4 South Korea
- 5.5.3.5 ASEAN Countries
- 5.5.3.6 Rest of Asia-Pacific
- 5.5.4 South America
- 5.5.4.1 Brazil
- 5.5.4.2 Argentina
- 5.5.4.3 Rest of South America
- 5.5.5 Middle East and Africa
- 5.5.5.1 Saudi Arabia
- 5.5.5.2 United Arab Emirates
- 5.5.5.3 Qatar
- 5.5.5.4 South Africa
- 5.5.5.5 Egypt
- 5.5.5.6 Nigeria
- 5.5.5.7 Rest of Middle East and Africa
- 5.5.1 North America
6 Competitive Landscape
- 6.1 Market Concentration
- 6.2 Strategic Moves (M&A, Partnerships, PPAs)
- 6.3 Market Share Analysis (Market Rank/Share for key companies)
- 6.4 Company Profiles (includes Global level Overview, Market level overview, Core Segments, Financials as available, Strategic Information, Products & Services, and Recent Developments)
- 6.4.1 John Zink Hamworthy Combustion LLC
- 6.4.2 Zeeco Inc.
- 6.4.3 Honeywell UOP
- 6.4.4 Gardner Denver (Ingersoll Rand)
- 6.4.5 Wartsila Oyj Abp
- 6.4.6 Transvac Systems Ltd
- 6.4.7 Aereon (ION Clean Air)
- 6.4.8 Schlumberger Endura
- 6.4.9 Air Liquide Global E&C
- 6.4.10 MAN Energy Solutions
- 6.4.11 Eisenmann Environmental
- 6.4.12 SoEnergy International
- 6.4.13 Zephyr Gas Recovery
- 6.4.14 KPS Holdings
- 6.4.15 Envent Corporation
- 6.4.16 Cimarron Energy Inc.
- 6.4.17 Cool Sorpt
- 6.4.18 Sundyne LLC
- 6.4.19 Ramesa Sistemas
- 6.4.20 PetroGas Systems
7 Market Opportunities & Future Outlook
- 7.1 White-space & Unmet-Need Assessment

 廢氣回收系統市場:按技術、組件、流量範圍、工作壓力和最終用戶分類-2026-2032年全球市場預測提高採收率市場:依採收技術、化學品類型、井類型及應用分類-2026-2032年全球預測
 廢氣回收系統市場-全球產業規模、佔有率、趨勢、機會及預測(依產能、應用、地區及競爭格局分類,2021-2031年)火焰氣體流量計市場按技術類型、安裝類型、測量輸出、應用和最終用戶產業分類,全球預測(2026-2032)
 廢氣回收系統市場規模、佔有率和成長分析(按工作壓力、配置、流量、技術、應用和地區分類)-2026-2033年產業預測
 全球富氧回收市場:2032 年預測 - 按產品、分銷管道、技術、應用、最終用戶和地區進行分析
 全球廢氣超音波流量計市場:依最終用戶、技術、類型、精度等級和地區(~2032年)
 廢氣回收系統市場規模、佔有率、趨勢分析報告:按技術、壓力、流量、最終用途、地區、細分市場預測,2025-2030 年
 廢氣回收系統市場:按容量、應用和地區分類