


 |
市場調查報告書
商品編碼
2115217
矽鐵:市場佔有率分析、產業趨勢與統計、成長預測(2026-2031 年)Ferrosilicon - Market Share Analysis, Industry Trends & Statistics, Growth Forecasts (2026 - 2031) |
||||||

※ 本網頁內容可能與最新版本有所差異。詳細情況請與我們聯繫。
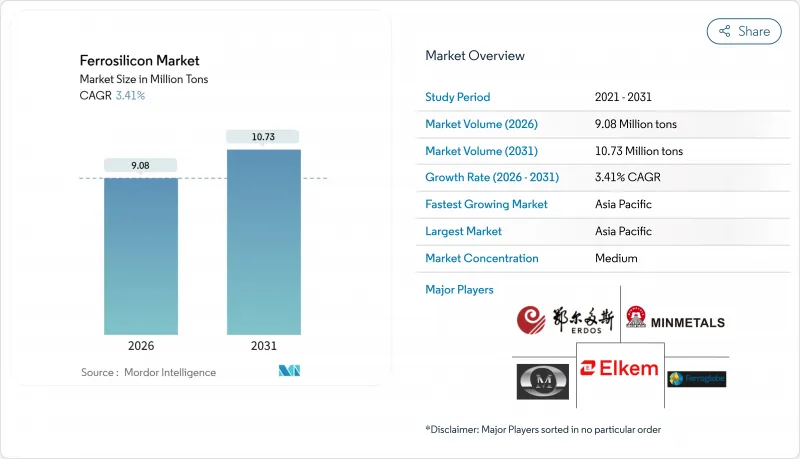
根據 Mordor Intelligence 估計,2026 年矽鐵市場規模為 908 萬噸,預計到 2031 年將達到 1,073 萬噸,在預測期(2026-2031 年)內複合年成長率為 3.41%。
本報告依等級(含矽量45%~75%的FeSi、含矽量75%~90%的FeSi以及含矽量超過90%的高純度FeSi)、形態(塊狀、粉末狀、壓塊狀及其他)、應用領域(冶金、半導體、太陽能、化工及其他應用細分)及歐洲地區(冶金、半導體、太陽能、化工及其他應用、歐洲地區(冶金、半導體、太陽能、化工及其他應用領域)進行細分。市場預測以噸為單位。
全球矽鐵市場趨勢及洞察
亞太地區鋼鐵產能增加
經合組織數據顯示,2025年至2027年間,新的鋼鐵產能擴張計畫正在實施,其中大部分集中在亞太地區。 2025會計年度,印度的粗鋼產能超乎預期。印度對廢鐵實施零進口關稅政策,並輔以與特殊鋼產量生產連結獎勵計畫機制,推動了其綜合鋼廠對脫氧劑的需求成長。中國的目標是到2026年實現粗鋼產量的年成長,但內蒙古和寧夏的能源限制導致老舊燃煤高爐間歇性停產。這迫使鋼廠採用更新、更節能的埋弧爐。儘管2024年熱軋捲板價格下降,但鋼鐵生產商仍維持了每噸粗鋼的矽鐵用量,穩定了基準消耗量。因此,該地區對中間合金的需求正在成長。
電氣化正在推動電動汽車馬達用電工鋼板的需求成長。
電工鋼片,即含矽的鐵矽合金薄片,被美國能源局視為牽引馬達的重要材料。每輛電池式電動車(EV)都需要用到這種材料製成的疊片。為了因應不斷擴大的電動車市場,浦項鋼鐵(POSCO)、寶武鋼鐵和JFE鋼鐵已推出新的取向矽鋼片和非晶取向矽鋼片生產線,預計2026年全面投入生產。這些鋼廠採用高純度矽鐵來最大限度地降低磁芯損耗。國際能源總署(IEA)預測,未來幾年全球電動車銷量將激增。此外,隨著可再生能源併網輸電變壓器的安裝量增加,對取向矽鋼片的需求也在上升,尤其是在升壓變壓器領域。電工鋼片的供應主要集中在中國、日本、韓國和德國,但與一般碳鋼應用相比,這些主要地區的需求受經濟波動的影響較小。即使建築用鋼需求疲軟,這種合金鋼的需求仍保持穩定。
石英岩和電力成本波動很大
生產一噸矽需要大量電力,因此能源成本幾乎佔冶煉廠總支出的一半。由於南非國家電力公司(Eskom)每年上調電價,嘉能可(Glencore)已調整其位於Mpumalanga省的冶煉爐運作。同時,由於歐洲隔日電價飆升,費羅格羅布(Ferroglobe)被迫暫停在西班牙和法國的營運。對於石英岩原料而言,高二氧化矽(SiO2)含量至關重要。然而,紅海和巴拿馬運河的中斷導致運輸成本飛漲。中國的「雙軌制」政策收緊了內蒙古和寧夏的冬季電力供應,導致運轉率下降,合金現貨價格上漲。挪威和巴拉圭水力資源豐富,因此成本有所緩解,但許多位於電價高昂地區的冶煉廠卻難以實現盈虧平衡,尤其是在矽鐵價格面臨下行壓力的情況下。
細分市場分析
預計到2025年,含矽量為45-75%的FeSi牌號將佔供應量的65.44%,其成長速度將超過其他任何牌號,複合年成長率(CAGR)為4.06%。此牌號易於添加到碳鋼包和鑄鐵孕育液中,可在不產生過多熱量的情況下實現較高的矽回收率。中國旨在提高粗鋼產量的政策推動了需求的成長,而印度產能的提升也促進了需求。標準75%牌號的產品用於電弧爐和鑄造廠,但由於其在廢鋼含量較高的熔煉製程所需材料較少,因此其成長速度相對低於高爐。含矽量超過90%的高純度牌號符合半導體和太陽能電池片的規格要求。生產商正從傳統的合金矽生產轉向冶金矽生產,多晶矽的價格也為此轉變提供了合理的依據。價格差異促使他們做出這一選擇,而靈活的冶煉廠則透過瞄準太陽能電池週期的峰值來創造利潤獎勵。用於太陽能發電的回收矽有可能在未來成為循環供應鏈的基礎,但工業規模的回收和提煉基礎設施仍處於起步階段。
區域分析
預計到2025年,亞太地區將佔據全球矽鐵市場佔有率的58.81%,並將持續以4.53%的複合年成長率(CAGR)成長至2031年,創歷史新高。儘管能源政策迫使內蒙古和寧夏的一些老舊運作關閉,但中國仍然是最大的生產國。在印度,特種鋼的激勵措施和廢鋼免稅進口政策正在推動合金需求成長,這些需求流向國內供應商和不丹的塔什集團。同時,日本和韓國每年合計進口大量矽鐵,而且由於浦項鋼鐵公司(POSCO)擴大了電工鋼板的生產,預計需求將進一步成長。
北美佔全球鋼鐵需求的很大一部分,美國依賴五家鋼鐵廠(其中一家目前已停產),同時也從巴西、加拿大和馬來西亞進口鋼鐵。由於兩黨共同支持的基礎設施立法,隨著橋樑和鐵路項目對鋼鐵的需求增加,預計年需求量將上升。加拿大正努力確保關鍵礦產資源的供應,並已提案建設水力發電廠的計劃(儘管核准延誤預計將使其推遲到2030年代),而墨西哥的近岸外包業務不斷增加,從而推高了家用電器和汽車用扁鋼的需求。然而,該地區對矽鐵進口的依賴凸顯了美墨兩國之間極為緊密的相互依存關係。
歐洲年消費量龐大,正苦於應付飆升的電價。 Ferrogrove公司已縮減其在西班牙和法國冶煉廠的營運規模,但挪威透過利用水力發電保持了成本競爭力。此外,挪威也在其位於赫羅亞的太陽能級矽綜合設施進行大量投資。南美洲主要依賴巴西的水力發電產能,向美國和歐洲出口大量產品。在中東和非洲,南非扮演核心角色。然而,由於Eskom公司漲價和計畫性停電等挑戰,產能運轉率仍有限。儘管如此,沙烏地阿拉伯的基礎設施項目帶來了一線希望,預示著需求將逐步成長。
其他好處:
- Excel格式的市場預測(ME)表
- 3個月的分析師支持
目錄
第1章:引言
- 研究假設和市場定義
- 調查範圍
第2章:調查方法
第3章執行摘要
第4章 市場狀況
- 市場概覽
- 市場促進因素
- 全部區域鋼鐵產能增加
- 電氣化正在推動電動汽車馬達用電工鋼板的需求成長。
- 北美和印度的基礎設施發展獎勵策略
- 在與氫相容的直接還原鐵(DRI)工廠中,使用矽含量高的合金混合物。
- 利用噴霧乾燥的FeSi粉末擴大高密度介質回收利用範圍
- 市場限制因素
- 石英岩價格波動與電力成本
- 加強冶煉廠二氧化碳排放法規
- 汽車鑄件中鋁矽中間合金的過渡
- 價值鏈分析
- 波特五力模型
第5章 市場規模與成長預測
- 按年級
- FeSi 45~75%Si
- FeSi 75~90% Si
- 矽含量超過90%的高純度FeSi
- 按形式
- 凹凸不平
- 粉末
- 煤球和其他
- 透過使用
- 冶金
- 半導體
- 太陽能
- 化學處理
- 其他用途
- 按地區
- 亞太地區
- 中國
- 印度
- 日本
- 韓國
- 其他亞太國家
- 北美洲
- 美國
- 加拿大
- 墨西哥
- 歐洲
- 德國
- 英國
- 法國
- 義大利
- 其他歐洲國家
- 南美洲
- 巴西
- 阿根廷
- 其他南美國家
- 中東和非洲
- 沙烏地阿拉伯
- 南非
- 其他中東和非洲國家
- 亞太地區
第6章 競爭情勢
- 市場集中度
- 策略趨勢
- 市佔率和排名分析
- 公司簡介
- Anyang Huatuo Metallurgy Co., Ltd
- China Minmetals Corporation
- Elkem ASA
- Erdos Group
- Eurasian Resources Group
- Ferro Alloys Corporation Ltd.(FACOR)
- Ferroglobe
- Finnfjord AS
- Glencore Ferroalloys
- Henan Xinxin Silicon Alloy Co.,Ltd
- Mechel PAO
- Nikopol Ferroalloy Plant
- OM Holdings Ltd.
- Shanghai Shenjia Ferroalloys Co. Ltd.
- SKP Merchants
- Tashi Group
第7章 市場機會與未來展望
According to Mordor Intelligence, the ferrosilicon market size is estimated at 9.08 million tons in 2026 and is expected to reach 10.73 million tons by 2031, at a CAGR of 3.41% during the forecast period (2026-2031).
This report is Segmented by Grade (FeSi 45-75% Si, Fesi 75-90% Si, and High-Purity FeSi Greater Than 90% Si), Form (Lumps, Powder, and Briquettes and Others), Application (Metallurgy, Semiconductors, Photovoltaic Solar Energy, Chemical Processing, and Other Applications), and Geography (Asia-Pacific, North America, Europe, and More). The Market Forecasts are Provided in Terms of Volume (Tons).
Global Ferrosilicon Market Trends and Insights
Rising Steel-Capacity Additions Across Asia-Pacific
Between 2025 and 2027, OECD data reveals plans for new steelmaking capacity, with a significant portion concentrated in the Asia-Pacific region. In fiscal 2025, India's finished-steel capacity surpassed expectations. India's zero-import-duty policy on ferrous scrap, coupled with a Production-Linked Incentive scheme for specialty steel, is driving heightened demand for deoxidizers at its integrated mills. While China aims for annual growth in crude steel through 2026, energy restrictions in Inner Mongolia and Ningxia have led to intermittent shutdowns of older coal-fired furnaces. This has pushed operators to adopt newer, energy-efficient submerged-arc units. Even as hot-rolled coil prices dipped in 2024, steelmakers maintained the use of ferrosilicon per ton of crude steel, stabilizing baseline consumption. Consequently, the region sees an increase in medium-grade alloy demand.
Electrification Spurring Electrical-Steel Demand for EV Motors
Electrical steel, an iron-silicon sheet with silicon content, is deemed critical for traction motors by the U.S. Department of Energy. Each battery electric vehicle (EV) requires laminations made from this material. In anticipation of the growing EV market, POSCO, Baowu, and JFE Steel have introduced new grain-oriented and non-oriented production lines, set to ramp up by 2026. These mills are also opting for higher-purity ferrosilicon to minimize magnetic-core losses. The International Energy Agency projects a surge in global EV sales in the coming years. Additionally, as grid-transformer installations for renewable energy interconnections grow, there's a heightened demand for grain-oriented electrical steel, especially since step-up transformers depend on it. While the supply of electrical steel is concentrated in China, Japan, South Korea, and Germany, these regional hotspots experience less cyclicality compared to bulk carbon-steel uses. This stability in alloy offtake persists even when there's a downturn in construction steel.
Volatile Quartzite and Electricity Costs
Producing a ton of silicon consumes significant electricity, making energy costs account for nearly half of a smelter's expenses. Due to annual Eskom tariff hikes, Glencore adjusted its furnace operations in Mpumalanga. Simultaneously, Ferroglobe had to halt operations in Spain and France, reacting to high European day-ahead electricity prices. For quartzite feedstock, a high SiO2 content is essential. However, disruptions in the Red Sea and Panama Canal have led to a spike in shipping costs. China's dual-control policy is tightening winter electricity supplies in Inner Mongolia and Ningxia, reducing utilization rates and driving up spot alloy prices. While hydropower-abundant Norway and Paraguay present some cost relief, many smelters in regions with high tariffs find it challenging to break even, especially when ferrosilicon prices remain under pressure.
Other drivers and restraints analyzed in the detailed report include:
- Infrastructure Stimulus in North America and India
- Hydrogen-Ready DRI Mills Adopting Higher-Silicon Blends
- Tightening CO2-Emission Regulations on Smelters
For complete list of drivers and restraints, kindly check the Table Of Contents.
Segment Analysis
The FeSi 45-75% slice held 65.44% of 2025 volume and is forecast to expand faster than any other grade at a 4.06% CAGR. This grade integrates effortlessly into carbon-steel ladles and cast-iron inoculation, delivering high silicon recoveries without excessive heat. Chinese measures aimed at increasing crude steel production underpin incremental offtake, and India's capacity additions amplify the pull. Standard 75% material serves electric-arc furnaces and foundries but grows more slowly because scrap-heavy melting requires less material compared to blast furnaces. High-purity grades over 90% silicon meet semiconductor and solar wafer standards; producers toggle furnaces between traditional alloy and metallurgical-grade silicon when polysilicon prices justify the switch. Pricing spreads validate that choice, giving agile smelters the margin incentive to chase solar-cycle peaks. Recycled photovoltaic silicon may eventually seed a circular supply, yet industrial-scale collection and refining infrastructure is still embryonic.
Complete Report Scope:
- By Grade
- FeSi 45-75% Si
- FeSi 75-90% Si
- High-purity FeSi greater than 90% Si
- By Form
- Lumps
- Powder
- Briquettes and Others
- By Application
- Metallurgy
- Semiconductors
- Photovoltaic Solar Energy
- Chemical Processing
- Other Applications
- By Geography
- Asia-Pacific
- China
- India
- Japan
- South Korea
- Rest of Asia-Pacific
- North America
- United States
- Canada
- Mexico
- Europe
- Germany
- United Kingdom
- France
- Italy
- Rest of Europe
- South America
- Brazil
- Argentina
- Rest of South America
- Middle-East and Africa
- Saudi Arabia
- South Africa
- Rest of Middle-East and Africa
- Asia-Pacific
Geography Analysis
Asia-Pacific owned 58.81% of the ferrosilicon market share in 2025 and is projected to clock the highest 4.53% CAGR through 2031. Despite energy policies causing some legacy furnaces in Inner Mongolia and Ningxia to idle, China stands firm as the leading producer. India is channeling increased alloy demand to its domestic suppliers and Bhutan's Tashi Group, thanks to its specialty-steel incentive scheme and zero-duty scrap imports. Meanwhile, Japan and South Korea, collectively importing substantial quantities annually, see an added boost from POSCO's electrical-steel expansion, potentially increasing demand further.
North America, accounting for a notable portion of global demand, saw the U.S. rely on five smelters, one of which was idled, alongside imports from Brazil, Canada, and Malaysia. Thanks to the Bipartisan Infrastructure Law, an annual uptick is anticipated as steel tonnage flows into bridge and rail projects. While Canada pushes for critical minerals and proposes hydro-powered plants (albeit with permitting delays into the 2030s), Mexico's near-shoring trend is driving up flat-steel demand for appliances and automotive. However, the region's reliance on imports for ferrosilicon underscores a significant interdependence.
Europe, with a substantial annual consumption, grapples with high power prices. While Ferroglobe has curtailed operations in Spanish and French furnaces, Norway capitalizes on hydropower to maintain competitive costs. Furthermore, Norway is channeling significant investment into a solar-grade silicon complex at Heroya. South America, primarily driven by Brazil's hydro-advantaged capacity, finds itself shipping significant quantities to both the U.S. and Europe. In the Middle East and Africa, South Africa takes center stage. However, with Eskom's tariff hikes and load-shedding challenges, capacity utilization remains restricted. Yet, there's a glimmer of hope with Saudi infrastructure projects hinting at modest incremental demand.
- Anyang Huatuo Metallurgy Co., Ltd
- China Minmetals Corporation
- Elkem ASA
- Erdos Group
- Eurasian Resources Group
- Ferro Alloys Corporation Ltd.(FACOR)
- Ferroglobe
- Finnfjord AS
- Glencore Ferroalloys
- Henan Xinxin Silicon Alloy Co.,Ltd
- Mechel PAO
- Nikopol Ferroalloy Plant
- OM Holdings Ltd.
- Shanghai Shenjia Ferroalloys Co. Ltd.
- SKP Merchants
- Tashi Group
Additional Benefits:
- The market estimate (ME) sheet in Excel format
- 3 months of analyst support
TABLE OF CONTENTS
1 Introduction
- 1.1 Study Assumptions and Market Definition
- 1.2 Scope of the Study
2 Research Methodology
3 Executive Summary
4 Market Landscape
- 4.1 Market Overview
- 4.2 Market Drivers
- 4.2.1 Rising steel-capacity additions across Asia-Pacific
- 4.2.2 Electrification spurring electrical-steel demand for EV motors
- 4.2.3 Infrastructure stimulus in North America and India
- 4.2.4 Hydrogen-ready DRI mills adopting higher-Si alloy blends
- 4.2.5 Growth of dense-media recycling using atomised FeSi powders
- 4.3 Market Restraints
- 4.3.1 Volatile quartzite and electricity costs
- 4.3.2 Tightening CO2-emission regulations on smelters
- 4.3.3 Shift to Al-Si master-alloys in auto castings
- 4.4 Value Chain Analysis
- 4.5 Porter's Five Forces
- 4.5.1 Bargaining Power of Suppliers
- 4.5.2 Bargaining Power of Buyers
- 4.5.3 Threat of New Entrants
- 4.5.4 Threat of Substitutes
- 4.5.5 Degree of Competition
5 Market Size and Growth Forecasts (Volume)
- 5.1 By Grade
- 5.1.1 FeSi 45-75% Si
- 5.1.2 FeSi 75-90% Si
- 5.1.3 High-purity FeSi greater than 90% Si
- 5.2 By Form
- 5.2.1 Lumps
- 5.2.2 Powder
- 5.2.3 Briquettes and Others
- 5.3 By Application
- 5.3.1 Metallurgy
- 5.3.2 Semiconductors
- 5.3.3 Photovoltaic Solar Energy
- 5.3.4 Chemical Processing
- 5.3.5 Other Applications
- 5.4 By Geography
- 5.4.1 Asia-Pacific
- 5.4.1.1 China
- 5.4.1.2 India
- 5.4.1.3 Japan
- 5.4.1.4 South Korea
- 5.4.1.5 Rest of Asia-Pacific
- 5.4.2 North America
- 5.4.2.1 United States
- 5.4.2.2 Canada
- 5.4.2.3 Mexico
- 5.4.3 Europe
- 5.4.3.1 Germany
- 5.4.3.2 United Kingdom
- 5.4.3.3 France
- 5.4.3.4 Italy
- 5.4.3.5 Rest of Europe
- 5.4.4 South America
- 5.4.4.1 Brazil
- 5.4.4.2 Argentina
- 5.4.4.3 Rest of South America
- 5.4.5 Middle-East and Africa
- 5.4.5.1 Saudi Arabia
- 5.4.5.2 South Africa
- 5.4.5.3 Rest of Middle-East and Africa
- 5.4.1 Asia-Pacific
6 Competitive Landscape
- 6.1 Market Concentration
- 6.2 Strategic Moves
- 6.3 Market Share (%)/Ranking Analysis
- 6.4 Company Profiles (includes Global level Overview, Market level overview, Core Segments, Financials as available, Strategic Information, Market Rank/Share for key companies, Products and Services, and Recent Developments)
- 6.4.1 Anyang Huatuo Metallurgy Co., Ltd
- 6.4.2 China Minmetals Corporation
- 6.4.3 Elkem ASA
- 6.4.4 Erdos Group
- 6.4.5 Eurasian Resources Group
- 6.4.6 Ferro Alloys Corporation Ltd.(FACOR)
- 6.4.7 Ferroglobe
- 6.4.8 Finnfjord AS
- 6.4.9 Glencore Ferroalloys
- 6.4.10 Henan Xinxin Silicon Alloy Co.,Ltd
- 6.4.11 Mechel PAO
- 6.4.12 Nikopol Ferroalloy Plant
- 6.4.13 OM Holdings Ltd.
- 6.4.14 Shanghai Shenjia Ferroalloys Co. Ltd.
- 6.4.15 SKP Merchants
- 6.4.16 Tashi Group
7 Market Opportunities and Future Outlook
- 7.1 White-space and Unmet-Need Assessment


