


 |
市場調查報告書
商品編碼
2115037
汽車人機介面(HMI):市場佔有率分析、產業趨勢與統計及成長預測(2026-2031)Automotive Human Machine Interface - Market Share Analysis, Industry Trends & Statistics, Growth Forecasts (2026 - 2031) |
||||||

※ 本網頁內容可能與最新版本有所差異。詳細情況請與我們聯繫。
據 Mordor Intelligence 稱,2025 年汽車人機介面 (HMI) 市場價值為 274.5 億美元,預計到 2031 年將達到 501.9 億美元,而 2026 年為 301.1 億美元,預測期(2026-2031 年)的複合年成長率為 10.7%。
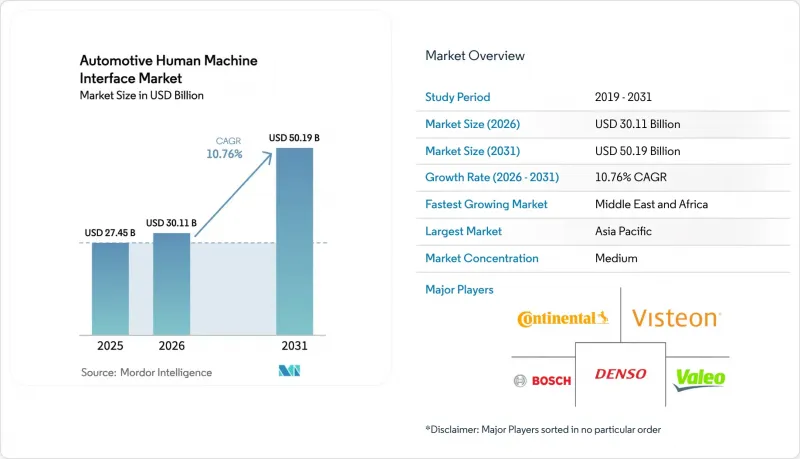
本報告按產品類型(例如,中央顯示器)、存取類型(單模式和多模態)、互動方式(例如,視覺)、車輛類型(例如,經濟型乘用車)、動力類型(例如,內燃機)、銷售管道(OEM 和售後市場)以及地區進行分類。預測以美元以金額為準。
全球汽車人機介面市場趨勢及洞察
對互聯資訊娛樂生態系的需求
消費者將車輛視為更廣泛的數位網路中的一個節點,並期望智慧型手機、智慧家居助理和汽車之間能夠無縫整合。 2025年,TomTom和微軟共同推出了一款對話式導航平台,該平台利用Azure OpenAI服務以故事敘述的方式提供即時路況資訊。 SoundHound等語音平台在2024年實現了OEM廠商數量的翻番,達到18個品牌,從而支援多層次對話,用於控制空調、媒體和智慧家庭。始終線上連接性支援基於使用量的保險和預測性維護警報,從而產生可抵消硬體成本的售後收入。隨著邊緣運算向駕駛座域控制器轉移,軟體更新無需更換硬體即可提供新功能,從而縮小了消費性電子產品更新周期與汽車開發之間的差距。因此,人機介面(HMI)市場受益於良性循環:更豐富的雲端服務提升了互聯訂閱的價值,而這反過來又需要更強大的介面。
ADAS和自動駕駛系統對直覺人機互動介面的依賴
在L2+級駕駛輔助系統中,駕駛可以雙手輕放在方向盤上,系統則負責長時間的橫向和縱向控制。將於2024年生效的UNECE R171標準要求系統使用逐步增強的視覺和聽覺提示來指示狀態和駕駛權交接。梅賽德斯-奔馳的“Drive Pilot”系統使用三色燈帶和方向盤上的發光二極體來指示角色轉換,最大限度地減少歧義。供應商正在將地理圍欄和基於天氣的限制整合到AR抬頭顯示器中,將安全駕駛範圍直接疊加到道路上,以減少駕駛員視線離開道路的時間。駕駛監視錄影機可以驗證眼神交流,並在駕駛分心時暫時中止輔助模式。隨著自動駕駛能力逐步接近L3級,人機互動(HMI)市場需要確保車輛意圖清晰可見,以維持駕駛員的信心;否則,監管機構可能會限制其部署。
先進的人機介面硬體堆疊高成本
有機發光二極體面板、超音波觸覺回饋和AR-HUD光學元件使組件成本增加了800至1500美元,入門車型難以負擔。京東方等中國面板製造商尚未將汽車曲面有機發光二極體的良率提升至70%以上,導致價格居高不下。 Micro-LED晶圓的晶片傳輸製程仍處於半手工階段,成本是OLED的三倍,因此其應用僅限於有機發光二極體高階產品。為了減輕高價帶來的經濟負擔,OEM廠商正在對不同等級的產品進行功能分級,但硬體碎片化會影響軟體的一致性,增加測試負擔,並阻礙人機介面(HMI)市場的規模化發展。
細分市場分析
到2025年,中央顯示器將佔據人機互動(HMI)市場42.28%的主導佔有率,10至15英吋的觸控螢幕將成為導航、媒體和空調控制的標準介面。擴增實境(AR)抬頭顯示器市場正以17.06%的複合年成長率快速成長。這主要得益於投射在擋風玻璃上的導航箭頭,它可以減少駕駛員的視線停留時間,符合聯合國歐洲經濟委員會(UNECE)關於減少駕駛員分心的標準。語音控制系統正轉向基於雲端的自然語言處理技術,這降低了對半導體的需求,並擴大了潛在市場規模。旋鈕正在從主流車型中消失,但一些追求觸覺回饋的豪華品牌仍然保留了旋鈕。
Panasonic的擴增實境(AR)單元可將影像投射到前方10公尺處,擁有13度的視野角,並將物件偵測資訊疊加到駕駛場景中。 Ultraleap的手勢模組支援空中接聽電話,但其面臨的挑戰是路面不平整時容易發生意外觸發。穿戴式裝置擴充、智慧型手機解鎖和智慧型手錶電量檢測等功能仍處於早期階段,但正在迅速發展。隨著以往用於豪華車的顯示器在中階車型中越來越普及,獨立顯示器的人機互動(HMI)市場預計將以高於整體市場收入的速度成長。
預計到2025年,多模態系統將佔總營收的51.62%,成長率達14.93%。這是因為L2級以上ADAS(高級駕駛輔助系統)和資訊娛樂系統的功能遠遠超出了單通道的處理能力。梅賽德斯-奔馳的56英寸“Hyperscreen”融合了觸控、手勢和語音功能,並根據實際情況動態地優先選擇對駕駛員干擾最小的通道。在經濟型車市場,由於成本限制,實驗性舉措受到阻礙,單模態佈局仍然佔據主導地位,但即使在這些車型中,與外部語音助理整合的無線手機鏡像功能也正在被採用。
觸覺回饋作為第四通道加入,與觸摸、語音和手勢並列。博世的壓電觸控螢幕透過模擬機械點擊來確認選擇,無需視覺確認。自適應系統旨在透過了解駕駛員的偏好並突出顯示最常用的操作模式,來遵守美國國家公路交通安全管理局 (NHTSA) 的「兩秒視線轉移規則」。然而,手勢識別錯誤和語音延遲可能會導致用戶感到沮喪,而多模態技術的價值已被證明取決於人機互動市場的整合品質。
區域分析
預計到2025年,亞太地區將佔全球銷量的47.88%,這主要得益於中國電池式電動車(BEV)的激增以及強制要求在本地存儲駕駛座數據的法規。這迫使全球供應商加快部署中文語音模型和國內雲端節點。日本品牌傾向採用極簡的觸感按鈕,以迎合日本人減少干擾的文化偏好。同時,韓國透過現代摩比斯與蔡司的合作,正逐步成為全球第二大AR-HUD光學元件供應商。在印度,配備9吋顯示器的印地語語音助理正成為售價低於1.5萬美元汽車的標配,從而帶動了銷量成長。
中東和非洲地區的複合年成長率 (CAGR) 為 13.74%,是各地區中成長最快的。沙烏地阿拉伯對 Lucid 的 56 億美元投資包括阿拉伯語人機介面 (HMI) 和區域專屬地圖。杜拜正在進行的多語言自動駕駛計程車試點計畫需要阿拉伯語、英語、印地語和烏爾都語之間的即時翻譯。南非的組裝正在支援南非荷蘭語和祖魯語介面,這表明原始設備製造商 (OEM) 正在積極推進在地化工作,以期滿足撒哈拉以南非洲市場的成長需求。
北美和歐洲是標準化領域的先驅,儘管它們的成熟速度較慢。聯合國歐洲經濟委員會的R171標準和GDPR正在塑造全球駕駛座設計和數據管道,德國豪華汽車製造商通常會在國內推出新的介面技術,然後再推廣到海外。巴西和阿根廷採用了有利於老牌製造商的歐洲式認證框架,而受制裁影響的俄羅斯品牌則依賴中國產安卓車載資訊娛樂系統。這些區域趨勢導致人機介面市場分散,設計中心集中在德國、美國、中國和日本,儘管海灣國家和印度也呈現成長跡象。
其他好處:
- Excel格式的市場預測(ME)表
- 3個月的分析師支持
目錄
第1章:引言
- 研究的先決條件
- 調查範圍
第2章:調查方法
第3章執行摘要
第4章 市場狀況
- 市場概覽
- 市場促進因素
- 對互聯資訊娛樂生態系的需求
- ADAS和自動駕駛系統對直覺人機互動介面的依賴
- 旨在減少駕駛分心的法規重點
- 向軟體定義車輛和OTA UI升級過渡
- 車載健康和保健介面創新
- 由生成式人工智慧副駕駛實現的高度個人化語音使用者體驗。
- 市場限制因素
- 先進的人機介面硬體堆疊高成本
- 網路安全和資料隱私漏洞
- Micro-LED 和 AR-HUD 組件的供應瓶頸
- 多模態使用者介面複雜性所導致的認知負荷過重
- 價值供應鏈分析
- 監理情勢
- 技術展望
- 波特五力分析
第5章 市場規模與成長預測
- 依產品類型
- 中央顯示螢幕
- 語音控制系統
- 抬頭顯示器(傳統型和擴增實境型)
- 觸控式方向盤控制
- 手勢控制模組
- 旋轉/旋鈕式控制器
- 穿戴式裝置和 BYOD(自帶裝置)介面
- 按存取類型
- 單一模式
- 多模態(語音+手勢+觸控)
- 互動方法
- 視覺(LCD/OLED/MicroLED)
- 聲學(語音、聲音和觸覺)
- 觸覺(力回饋、超音波)
- 車輛類型
- 經濟型轎車
- 中檔乘用車
- 豪華轎車
- 商用車輛
- 依推進類型
- 內燃機(ICE)
- 電池式電動車(BEV)
- 插電式混合動力汽車(PHEV)
- 燃料電池汽車(FCEV)
- 按銷售管道
- OEM安裝的系統
- 售後改裝
- 按地區
- 北美洲
- 美國
- 加拿大
- 其他北美國家
- 南美洲
- 巴西
- 阿根廷
- 其他南美國家
- 歐洲
- 德國
- 英國
- 法國
- 義大利
- 西班牙
- 俄羅斯
- 其他歐洲國家
- 亞太地區
- 中國
- 日本
- 印度
- 韓國
- 其他亞太國家
- 中東和非洲
- 沙烏地阿拉伯
- 阿拉伯聯合大公國
- 南非
- 其他中東和非洲國家
- 北美洲
第6章 競爭情勢
- 市場集中度
- 策略趨勢
- 市佔率分析
- 公司簡介
- Continental AG
- Visteon Corporation
- DENSO Corporation
- Bosch GmbH
- Valeo SA
- Harman International(Samsung)
- Panasonic Automotive
- Aptiv plc
- Synaptics Inc.
- Luxoft(DXC Technology)
- Alps Alpine
- Magna International
- Faurecia Clarion
- Hyundai Mobis
- Yazaki Corp.
- Nippon Seiki
- Pioneer Corp.
- Tencent
- Cerence Inc.
- Elektrobit Automotive
第7章 市場機會與未來展望
According to Mordor Intelligence, the automotive human machine interface market size was valued at USD 27.45 billion in 2025 and estimated to grow from USD 30.11 billion in 2026 to reach USD 50.19 billion by 2031, at a CAGR of 10.76% during the forecast period (2026-2031).
This report is Segmented by Product Type (Central Displays, and More), Access Type (Single-Modal and Multimodal), Interaction Modality (Visual, and More), Vehicle Type (Economy Passenger Cars, and More), Propulsion Type (Internal Combustion Engine and More), Sales Channel (Original Equipment Manufacturer-Installed and Aftermarket), and Geography. Forecasts in Value (USD).
Global Automotive Human Machine Interface Market Trends and Insights
Demand for Connected-Infotainment Ecosystems
Consumers treat the vehicle as a node in a wider digital mesh, expecting seamless handoffs among phone, home assistant, and car. TomTom and Microsoft introduced a conversational navigation platform in 2025 that employs Azure OpenAI Service to deliver real-time traffic storytelling. Voice platforms such as SoundHound, which doubled original equipment manufacturer wins to 18 brands in 2024, allow multi-turn dialogue for climate, media, and smart-home control. Always-on connectivity unlocks usage-based insurance and predictive-maintenance alerts, producing post-sale revenue that offsets hardware cost. As edge computing migrates to cockpit domain controllers, software updates can deliver new features without hardware swaps, shrinking the gap between consumer-electronics refresh cycles and automotive development. The human machine interface market, therefore, benefits from a virtuous loop in which richer cloud services justify connectivity subscriptions that in turn demand more capable interfaces.
ADAS and Autonomous-Driving Dependency on Intuitive HMI
Level 2+ assistance keeps hands loosely on the wheel while transferring lateral and longitudinal control for extended stretches. United Nations Economic Commission for Europe (UNECE) R171, enforced from 2024, obliges systems to communicate status and takeover prompts by escalating audio-visual cues. Mercedes-Benz Drive Pilot uses tri-color light strips and steering-wheel light-emitting diodes to signal role changes, minimizing ambiguity. Suppliers embed geo-fencing and weather limits into AR head-up displays that overlay safe-operation bounds directly on the road, trimming eyes-off-road time. Driver-monitor cameras ensure gaze compliance and can suspend assisted mode when attention drifts. As autonomous functions inch toward Level 3, the human machine interface market must visualize vehicle intent clearly enough to sustain driver trust, or regulators could throttle roll-outs.
High Cost of Advanced HMI Hardware Stacks
Curved organic light-emitting diode panels, ultrasonic haptics, and AR-HUD optics add USD 800-1,500 to the bill of materials, pricing them out of entry models. Chinese panel makers such as BOE have yet to bring curved automotive organic light-emitting diode (OLED) yields above 70%, sustaining premiums. Micro-LED wafers, still semi-manual in die transfer, sit at thrice the organic light-emitting diode (OLED) cost, confining adoption to ultra-luxury trims. Original equipment manufacturers tier features by trim to soften sticker shock, but fragmented hardware complicates software consistency and raises test overhead, an impediment to scale within the human machine interface market.
Other drivers and restraints analyzed in the detailed report include:
- Regulatory Focus on Driver-Distraction Mitigation
- Shift Toward Software-Defined Vehicles and OTA UI Upgrades
- Cyber-Security and Data-Privacy Vulnerabilities
For complete list of drivers and restraints, kindly check the Table Of Contents.
Segment Analysis
Central displays held a commanding 42.28% human-machine interface market share in 2025, as 10- to 15-inch touchscreens became the default portal for navigation, media, and climate control. The augmented-reality head-up display category is scaling at a 17.06% CAGR, propelled by windshield-level navigation arrows that align with United Nations Economic Commission for Europe (UNECE) distraction caps and keep glance durations low. Voice control systems are migrating down-market to cloud natural-language processing that lowers silicon demands, expanding total addressable units. Rotary knobs are disappearing in mainstream models but linger in select luxury brands for tactile reassurance.
Augmented-reality units from Panasonic project a 13-degree field of view 10 meters ahead, overlaying object detection on the driving scene. Gesture modules from Ultraleap give mid-air call-accept motions, yet struggle with unintentional triggers in bumpy conditions. Wearable extensions, phone unlock, smartwatch battery checks, form a nascent but rising slice. As premium screens filter into mid-price cars, the human machine interface market size for displays alone is positioned to expand faster than overall revenue.
Multimodal systems controlled 51.62% of the 2025 revenue and will grow at 14.93%, because Level 2+ ADAS and infotainment depth exceed any single channel's bandwidth. Mercedes' 56-inch Hyperscreen marries touch, gesture, and voice, dynamically prioritizing the least distracting channel per context. Single-modality layouts persist in economy tiers where cost gates experimentation, yet even these cars adopt wireless phone mirroring that injects external voice assistants.
Haptic feedback joins touch, voice, and gesture as a fourth lane; Bosch piezo touchscreens fake mechanical clicks to confirm selections without visual verification. Adaptive systems observe driver preference and highlight the dominant modality, aiming to meet NHTSA's 2-second glance rule. However, gesture misreads and voice latency risk frustrating users, proving that multimodal value depends on orchestration quality within the human machine interface market.
Complete Report Scope:
- By Product Type
- Central Displays
- Voice Control Systems
- Head-Up Displays (Conventional and AR)
- Touch-Sensitive Steering Controls
- Gesture-Control Modules
- Rotary/Knob Controllers
- Wearable and Bring-Your-Own-Device Interfaces
- By Access Type
- Single-Modal
- Multimodal (Voice+Gesture+Touch)
- By Interaction Modality
- Visual (LCD/OLED/micro-LED)
- Acoustic (Voice, Sound-Haptics)
- Haptic (Force-feedback, Ultrasonic)
- By Vehicle Type
- Economy Passenger Cars
- Mid-Price Passenger Cars
- Luxury Passenger Cars
- Commercial Vehicles
- By Propulsion Type
- Internal Combustion Engine (ICE)
- Battery-Electric Vehicles (BEVs)
- Plug-in Hybrid Vehicles (PHEVs)
- Fuel-Cell Vehicles (FCEVs)
- By Sales Channel
- OEM-Installed Systems
- Aftermarket Retro-fits
- By Geography
- North America
- United States
- Canada
- Rest of North America
- South America
- Brazil
- Argentina
- Rest of South America
- Europe
- Germany
- United Kingdom
- France
- Italy
- Spain
- Russia
- Rest of Europe
- Asia-Pacific
- China
- Japan
- India
- South Korea
- Rest of Asia-Pacific
- Middle East and Africa
- Saudi Arabia
- United Arab Emirates
- South Africa
- Rest of Middle East and Africa
- North America
Geography Analysis
Asia-Pacific owned 47.88% of 2025 revenue, anchored by China's battery electric vehicle surge and mandates that cockpit data be stored locally, forcing global suppliers to spin up Mandarin voice models and in-country cloud nodes. Japanese brands favor minimalist tactile buttons, fitting cultural preferences for low distraction, while South Korea positions itself as a second source for AR-HUD optics through Hyundai Mobis and Zeiss collaboration. India's sub-USD 15,000 cars now feature Hindi voice assistance on 9-inch displays, enlarging unit volume.
The Middle East and Africa books a 13.74% CAGR, the fastest geography. Saudi Arabia's USD 5.6 billion investment in Lucid includes Arabic-local HMI and region-specific maps. Dubai's multilingual autonomous-taxi pilots demand real-time translation across Arabic, English, Hindi, and Urdu. South African assembly lines adapt interfaces to Afrikaans and Zulu, indicating original equipment manufacturer willingness to localize for sub-Saharan growth.
North America and Europe mature more slowly yet pioneer standards. United Nations Economic Commission for Europe (UNECE) R171 and GDPR shape global cockpit design and data pipelines, and premium German cars typically debut new interface tech before exporting it. Brazil and Argentina adopt Euro-style approval frameworks that favor incumbents, while Russian brands rely on Chinese Android head units amid sanctions. These regional dynamics keep the human machine interface market dispersed, with design centers clustered in Germany, the United States, China, and Japan, but growth pockets emerging in the Gulf and India.
- Continental AG
- Visteon Corporation
- DENSO Corporation
- Bosch GmbH
- Valeo S.A.
- Harman International (Samsung)
- Panasonic Automotive
- Aptiv plc
- Synaptics Inc.
- Luxoft (DXC Technology)
- Alps Alpine
- Magna International
- Faurecia Clarion
- Hyundai Mobis
- Yazaki Corp.
- Nippon Seiki
- Pioneer Corp.
- Tencent
- Cerence Inc.
- Elektrobit Automotive
Additional Benefits:
- The market estimate (ME) sheet in Excel format
- 3 months of analyst support
TABLE OF CONTENTS
1 Introduction
- 1.1 Study Assumptions
- 1.2 Scope of the Study
2 Research Methodology
3 Executive Summary
4 Market Landscape
- 4.1 Market Overview
- 4.2 Market Drivers
- 4.2.1 Demand for Connected-Infotainment Ecosystems
- 4.2.2 ADAS and Autonomous-Driving Dependency on Intuitive HMI
- 4.2.3 Regulatory Focus on Driver-Distraction Mitigation
- 4.2.4 Shift Toward Software-Defined Vehicles and OTA UI Upgrades
- 4.2.5 In-Cabin Health and Wellness Interface Innovations
- 4.2.6 Generative-AI Copilots Enabling Hyper-Personalized Voice UX
- 4.3 Market Restraints
- 4.3.1 High Cost of Advanced HMI Hardware Stacks
- 4.3.2 Cyber-Security and Data-Privacy Vulnerabilities
- 4.3.3 Micro-LED and AR-HUD Component Supply Bottlenecks
- 4.3.4 Cognitive Overload From Multimodal UI Complexity
- 4.4 Value/Supply-Chain Analysis
- 4.5 Regulatory Landscape
- 4.6 Technological Outlook
- 4.7 Porter's Five Forces Analysis
- 4.7.1 Threat of New Entrants
- 4.7.2 Bargaining Power of Buyers/Consumers
- 4.7.3 Bargaining Power of Suppliers
- 4.7.4 Threat of Substitute Products
- 4.7.5 Intensity of Competitive Rivalry
5 Market Size and Growth Forecasts (Value (USD))
- 5.1 By Product Type
- 5.1.1 Central Displays
- 5.1.2 Voice Control Systems
- 5.1.3 Head-Up Displays (Conventional and AR)
- 5.1.4 Touch-Sensitive Steering Controls
- 5.1.5 Gesture-Control Modules
- 5.1.6 Rotary/Knob Controllers
- 5.1.7 Wearable and Bring-Your-Own-Device Interfaces
- 5.2 By Access Type
- 5.2.1 Single-Modal
- 5.2.2 Multimodal (Voice+Gesture+Touch)
- 5.3 By Interaction Modality
- 5.3.1 Visual (LCD/OLED/micro-LED)
- 5.3.2 Acoustic (Voice, Sound-Haptics)
- 5.3.3 Haptic (Force-feedback, Ultrasonic)
- 5.4 By Vehicle Type
- 5.4.1 Economy Passenger Cars
- 5.4.2 Mid-Price Passenger Cars
- 5.4.3 Luxury Passenger Cars
- 5.4.4 Commercial Vehicles
- 5.5 By Propulsion Type
- 5.5.1 Internal Combustion Engine (ICE)
- 5.5.2 Battery-Electric Vehicles (BEVs)
- 5.5.3 Plug-in Hybrid Vehicles (PHEVs)
- 5.5.4 Fuel-Cell Vehicles (FCEVs)
- 5.6 By Sales Channel
- 5.6.1 OEM-Installed Systems
- 5.6.2 Aftermarket Retro-fits
- 5.7 By Geography
- 5.7.1 North America
- 5.7.1.1 United States
- 5.7.1.2 Canada
- 5.7.1.3 Rest of North America
- 5.7.2 South America
- 5.7.2.1 Brazil
- 5.7.2.2 Argentina
- 5.7.2.3 Rest of South America
- 5.7.3 Europe
- 5.7.3.1 Germany
- 5.7.3.2 United Kingdom
- 5.7.3.3 France
- 5.7.3.4 Italy
- 5.7.3.5 Spain
- 5.7.3.6 Russia
- 5.7.3.7 Rest of Europe
- 5.7.4 Asia-Pacific
- 5.7.4.1 China
- 5.7.4.2 Japan
- 5.7.4.3 India
- 5.7.4.4 South Korea
- 5.7.4.5 Rest of Asia-Pacific
- 5.7.5 Middle East and Africa
- 5.7.5.1 Saudi Arabia
- 5.7.5.2 United Arab Emirates
- 5.7.5.3 South Africa
- 5.7.5.4 Rest of Middle East and Africa
- 5.7.1 North America
6 Competitive Landscape
- 6.1 Market Concentration
- 6.2 Strategic Moves
- 6.3 Market Share Analysis
- 6.4 Company Profiles (Includes Global level Overview, Market level overview, Core Segments, Financials as available, Strategic Information, Market Rank/Share for key companies, Products and Services, and Recent Developments)
- 6.4.1 Continental AG
- 6.4.2 Visteon Corporation
- 6.4.3 DENSO Corporation
- 6.4.4 Bosch GmbH
- 6.4.5 Valeo S.A.
- 6.4.6 Harman International (Samsung)
- 6.4.7 Panasonic Automotive
- 6.4.8 Aptiv plc
- 6.4.9 Synaptics Inc.
- 6.4.10 Luxoft (DXC Technology)
- 6.4.11 Alps Alpine
- 6.4.12 Magna International
- 6.4.13 Faurecia Clarion
- 6.4.14 Hyundai Mobis
- 6.4.15 Yazaki Corp.
- 6.4.16 Nippon Seiki
- 6.4.17 Pioneer Corp.
- 6.4.18 Tencent
- 6.4.19 Cerence Inc.
- 6.4.20 Elektrobit Automotive
7 Market Opportunities and Future Outlook
- 7.1 White-space and Unmet-Need Assessment

 汽車圖形顯示控制器市場規模、佔有率、成長率、全球產業分析、區域趨勢及2026年至2034年預測
 汽車人機互動市場報告:趨勢、預測及競爭分析(至2035年)
 汽車人機介面市場預測至2034年-全球分析(按介面類型、組件、顯示類型、技術、自動化程度、最終用戶和地區分類)
 汽車人機互動市場:依介面類型、技術、應用、通路和車輛類型分類-2026-2032年全球市場預測
 汽車人機介面市場分析及至2035年的預測:依類型、產品、服務、技術、組件、應用、設備、功能、安裝類型及解決方案汽車人機介面市場預測至2034年—按組件、介面類型、車輛類型、自動化程度、應用和地區分類的全球分析
 汽車人機互動市場報告:按產品類型、存取方式、技術、車輛類型和地區分類(2026-2034 年)車載資訊娛樂系統(IVI)市場預測至2034年-按組件、車輛類型、連接方式、最終用戶和地區分類的全球分析全球汽車人機介面市場規模、佔有率、趨勢和成長分析報告:2026-2034年
 2026年全球汽車人機介面市場報告