


 |
市場調查報告書
商品編碼
2115004
α-烯烴:市場佔有率分析、產業趨勢與統計、成長預測(2026-2031)Alpha Olefins - Market Share Analysis, Industry Trends & Statistics, Growth Forecasts (2026 - 2031) |
||||||

※ 本網頁內容可能與最新版本有所差異。詳細情況請與我們聯繫。
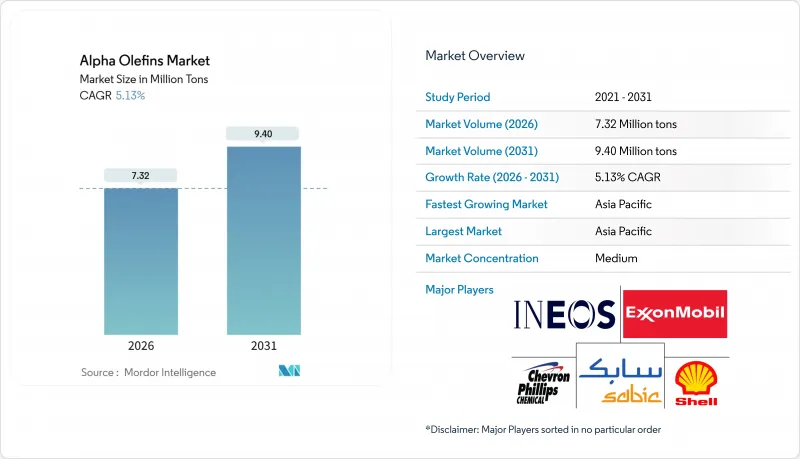
據 Mordor Intelligence 稱,2026 年 α-烯烴市場規模預計為 732 萬噸,預計在預測期(2026-2031 年)內將以 5.13% 的複合年成長率成長,到 2031 年將達到 940 萬噸。
本報告按類型(例如,C4(1-Butene)、C6(1-Hexene))、製造程序(乙烯寡聚物、FISCHER-TROPSCH法、生物衍生醇脫水)、應用(聚烯共聚物、潤滑劑、其他)、最終用途行業(包裝、汽車、石油和天然氣、其他)和地區(亞太地區、北美、歐洲、南美、中東和非洲)進行分類。
全球α-烯烴市場趨勢及洞察
對聚乙烯共聚單體的需求正在激增。
由於茂金屬基線性低密度聚乙烯(LLDPE)對分子量控制的精度要求不斷提高,市場對高純度1-Hexene和1-Octene共聚物的需求日益成長。雪佛龍菲利普斯化學公司已將其位於錫達巴尤的裂解裝置擴建至年乙烯產能150萬噸,並配套建設了一條α-烯烴生產線,以充分利用乙烯與C6/C8的價差。殼牌公司的莫納卡聯合裝置也採用了類似的整合模式,確保自身能夠獲得共聚單體,以滿足160萬噸聚乙烯的需求。電子商務物流的蓬勃發展加速了對拉伸膜的需求,而品牌商更青睞只有茂金屬LLDPE才能提供的輕薄且耐穿刺的薄膜。下游需求的增加使得共聚單體的需求對價格的小幅上漲也更加敏感。隨著亞洲新建LLDPE反應器從齊格勒-納塔催化劑轉向茂金屬催化劑,α-烯烴市場的交易量正經歷結構性成長。
合成潤滑油的成長
聚α烯烴(PAO)基料的黏度指數可達 130 或更高,流點可達 -50 度C或更低,從而能夠生產符合 API SP 和 ILSAC GF-6 標準的新一代機油。 2025 年 11 月,雪佛龍菲利普斯化學公司開始擴建位於比利時貝林根的 PAO 生產設施。此舉旨在為歐洲汽車製造商提供產品,以滿足其延長換油週期和引入混合動力傳動系統的需求。電動車 (EV) 的普及進一步推高了對 PAO 的需求,因為它們需要一種在 150 度C以上溫度下仍保持穩定且具有高介電強度的潤滑油,以便直接冷卻電池單元。同樣,工業齒輪箱和壓縮機也正在轉向使用 PAO,以延長使用壽命並減少停機時間。規模經濟正在縮小 PAO 與礦物油之間的成本差距,加速 PAO 在中檔潤滑油配方中的替代應用。
乙烯原料價格波動
2024年至2025年間,布蘭特原油價格在每桶70至90美元之間波動,擠壓了石腦油裂解裝置的利潤空間,並削弱了寡聚物的獲利能力。亞洲乙烯現貨價格在每噸800至1100美元之間波動,迫使共聚單體供應商透過期貨合約進行避險,導致盈利被稀釋。歐洲生產商在歐盟排放交易體系(EU ETS)下面臨不利因素,每噸碳排放成本增加了50至70歐元。因此,依賴商業乙烯的獨立低聚物氧化(LAO)裝置正在推遲產能擴張,而墨西哥灣沿岸地區的綜合性裝置則維持較高的運轉率。
細分市場分析
2025年,C4(1-Butene)產量佔總產量的35.23%,這主要得益於其成本優勢以及在傳統齊格勒-納塔製程線性低密度聚乙烯(LLDPE)中的應用。同時,C6(1-Hexene)的複合年成長率(CAGR)為5.88%,推動了α-烯烴市場向高附加價值產品方向的擴張。陶氏化學的「AFFINITY」系列塑性體採用C8(1-Octene)製備彈性體薄膜,其價格比C4基樹脂高出15-20%。
茂金屬催化劑需要1-Hexene或1-Octene來縮小分子量分佈,並提高抗衝擊性和抗應力開裂性。碳原子數較多的α-烯烴(C10至C20+)用於合成潤滑油和增塑醇,儘管生產集中在C4至C8,但仍能維持獲利能力的多樣性。FISCHER-TROPSCH法取的α-烯烴主要面向多餾分產品,但由於其高資本密集度,其產量僅佔總產量的不到10%。
預計到2025年,乙烯寡聚物將佔乙烯總產量的80.12%,並以5.67%的複合年成長率成長,這主要得益於催化劑對1-Hexene的選擇性超過95%。雪佛龍菲利普斯和英力士正在利用自身的乙烯生產能力來保護利潤率,使其免受原料價格波動的影響。儘管卡達的FISCHER-TROPSCH法過程有效利用了未充分利用的天然氣和南非的煤炭,但其小規模。歐洲一座生物醇脫水先導工廠的年產量預計不到1萬噸,直到催化劑壽命改善。
一體化帶來的經濟優勢有利於寡聚物反應。這是因為乙烯裂解裝置可以根據產率在低聚烯烴、聚乙烯和乙烯衍生物之間切換生產,從而無論處於哪個生產週期,都能在α-烯烴產業中保持競爭力。
區域分析
預計到2025年,亞太地區將佔全球需求的40.45%,年複合成長率(CAGR)為6.89%,主要成長動力來自中國投資100億美元的中石化-沙烏地阿美福建聯合裝置計畫以及印度石化消費量(年成長率達7%)。由於當地α-烯烴產能無法滿足需求,該地區從中東的進口量依然強勁,但隨著中國和沙烏地阿拉伯計劃運作新的產能,供應鏈正在東移。日本和韓國進口高純度C6/C8用於生產特種線性低密度聚乙烯(LLDPE),而東協對聚烯的需求正以超過6%的年成長率成長,吸收了α-烯烴市場的部分成長。
在北美,頁岩乙烷的價格優勢使得乙烯的現金成本比歐洲同等石腦油的成本低近50%。墨西哥灣沿岸地區的14套乙烯裂解裝置,總合達919萬噸,位置地區的線性α-烯烴(LAO)裝置提供支持,鞏固了該地區作為乙烯淨出口地區的地位。加拿大和墨西哥的供不應求確保了跨境物流的暢通,而北美原料的優勢則轉化為下游行業的競爭力。
歐洲面臨許多結構性挑戰,包括石腦油成本飆升、歐盟排放交易體系(EU ETS)下的碳定價機制,以及由於沙烏地阿拉伯基礎工業公司(SABIC)的Helen Olefin 3裝置和蒂斯賽德裂解裝置關閉而導致的50萬噸乙烯產能削減。相較之下,中東地區乙烷基能源的擴張正在加速,包括亞斯列夫公司計劃建造的年產180萬噸的裂解裝置,以滿足亞洲的需求。南美洲,以巴西布拉舍姆公司為核心,其成長潛力受到宏觀經濟波動和上游領域投資不足的限制。
其他好處:
- Excel格式的市場預測(ME)表
- 3個月的分析師支持
目錄
第1章:引言
- 研究假設和市場定義
- 調查範圍
第2章:調查方法
第3章執行摘要
第4章 市場狀況
- 市場概覽
- 市場促進因素
- 聚乙烯共聚物需求激增
- 合成潤滑油的成長
- 北美頁岩乙烷的成本優勢
- 加強新興國家的生產能力
- 電動汽車溫度控管液的要求
- 市場限制因素
- 乙烯原料價格波動
- 聚乙烯缺乏生物分解性
- 生物基LAO合成中的催化劑失活
- 價值鏈分析
- 波特五力模型
第5章 市場規模與成長預測
- 按類型
- C4(1-Butene)
- C6(1-Hexene)
- C8(1-Octene)
- 其他類型
- 透過生產過程
- 乙烯寡聚物
- FISCHER-TROPSCH法
- 生物基醇的脫水
- 透過使用
- 聚烯共聚物
- 潤滑劑
- 油田化學品
- 塑化劑
- 界面活性劑
- 其他用途
- 按最終用途行業分類
- 包裝
- 車
- 石油和天然氣
- 化妝品和個人護理
- 其他終端用戶產業
- 按地區
- 亞太地區
- 中國
- 印度
- 日本
- 韓國
- 東南亞國協
- 其他亞太國家
- 北美洲
- 美國
- 加拿大
- 墨西哥
- 歐洲
- 德國
- 英國
- 義大利
- 法國
- 北歐國家
- 其他歐洲國家
- 南美洲
- 巴西
- 阿根廷
- 其他南美國家
- 中東和非洲
- 沙烏地阿拉伯
- 南非
- 其他中東和非洲國家
- 亞太地區
第6章 競爭情勢
- 市場集中度
- 策略趨勢
- 市佔率和排名分析
- 公司簡介
- Braskem
- Chevron Phillips Chemical Company LLC
- China Petrochemical Corporation(Sinopec)
- CNOOC & Shell Petrochemicals Company Limited
- Dow
- Evonik Industries AG
- Exxon Mobil Corporation
- Idemitsu Kosan Co., Ltd.
- INEOS
- LG Chem
- Mitsui Chemicals, Inc.
- National Petrochemical Co.(Iran)
- PetroChina Company Limited
- Qatar Chemical Company Ltd
- SABIC
- Sasol Limited
- Shell plc
第7章 市場機會與未來展望
According to Mordor Intelligence, the alpha olefins market size is estimated at 7.32 Million tons in 2026, and is expected to reach 9.40 Million tons by 2031, at a CAGR of 5.13% during the forecast period (2026-2031).
This report is Segmented by Type (C4 (1-Butene), C6 (1-Hexene), and More), Production Process (Ethylene Oligomerization, Fischer-Tropsch Synthesis, and Bio-Based Alcohol Dehydration), Application (Polyolefin Comonomers, Lubricants, and More), End-Use Industry (Packaging, Automotive, Oil and Gas, and More), and Geography (Asia-Pacific, North America, Europe, South America, and Middle-East and Africa).
Global Alpha Olefins Market Trends and Insights
Surging Polyethylene Comonomer Demand
Metallocene LLDPE grades require tighter molecular-weight control, elevating consumption of high-purity 1-hexene and 1-octene comonomers. Chevron Phillips Chemical expanded its Cedar Bayou cracker to 1.5 million tons-per-year ethylene capacity and co-located alpha-olefin trains to monetize the ethylene-to-C6/C8 spread. Shell's Monaca complex follows a similar integration model, ensuring captive comonomer supply for 1.6 million tons of polyethylene demand. E-commerce logistics accelerate stretch-film uptake, and brand owners prefer downgauged yet puncture-resistant films that only metallocene LLDPE can deliver. This downstream pull renders comonomer demand inelastic to modest price spikes. As new Asian LLDPE reactors switch from Ziegler-Natta to metallocene catalysts, alpha olefins market volumes receive a structural uplift.
Growth in Synthetic Lubricants
Poly-alpha-olefin base stocks achieve viscosity indices above 130 and pour points below -50 °C, enabling next-generation engine oils that satisfy API SP and ILSAC GF-6 specifications. Chevron Phillips Chemical broke ground in November 2025 on a PAO expansion in Beringen, Belgium, to service European automakers pursuing longer drain intervals and hybrid powertrains. EVs further amplify PAO demand, as direct battery-cell cooling requires fluids stable above 150 °C with high dielectric strength. Industrial gearboxes and compressors similarly upgrade to PAO to extend service life and reduce downtime. Economies of scale are narrowing the PAO-to-mineral-oil cost delta, hastening substitution in mid-tier lubricant formulations.
Ethylene Feedstock Price Volatility
Brent crude oscillated between USD 70 and USD 90 per barrel during 2024-2025, compressing naphtha cracker margins and disrupting oligomerization economics. Asian ethylene spot prices fluctuated USD 800-1,100 per ton, forcing comonomer suppliers to hedge through futures contracts that dilute profitability. European producers face an additional EUR 50-70 per ton carbon-cost headwind under the EU ETS. Consequently, standalone LAO units reliant on merchant ethylene are deferring capacity expansions, while integrated Gulf Coast complexes run at elevated rates.
Other drivers and restraints analyzed in the detailed report include:
- Shale-Ethane Cost Advantage in North America
- Capacity Additions in Emerging Economies
- Non-Biodegradability of Polyethylene
For complete list of drivers and restraints, kindly check the Table Of Contents.
Segment Analysis
C4 (1-Butene) captured 35.23% of 2025 volume on cost advantage and legacy Ziegler-Natta LLDPE use. Conversely, C6 (1-Hexene) grew at a 5.88% CAGR, steering alpha olefins market size expansion toward higher-value streams. Dow's AFFINITY plastomers leverage C8 (1-octene) for elastomeric films, commanding premiums of 15-20% over C4-based resins.
Metallocene catalysts require 1-hexene or 1-octene for narrow molecular-weight distributions, improving dart impact and stress-crack resistance. Higher carbon-number alpha olefins (C10-C20+) serve synthetic lubricants and plasticizer alcohols, sustaining margin diversity even as volume concentrates in C4-C8. Fischer-Tropsch-derived alpha olefins target multi-cut portfolios but remain below 10% of output due to capital intensity.
Ethylene oligomerization delivered 80.12% of 2025 production and is projected to expand at 5.67% CAGR, underpinned by catalyst selectivity surpassing 95% for 1-hexene. Chevron Phillips and INEOS capitalize on captive ethylene, achieving margin insulation against feedstock volatility. Fischer-Tropsch synthesis monetizes stranded gas in Qatar and coal in South Africa, yet remains subscale. Bio-alcohol dehydration pilot plants in Europe stay below 10,000 tons-per-year until catalyst lifetimes improve.
Integration economics favor oligomerization, as ethylene crackers can swing between LAO, polyethylene, and ethylene derivatives depending on spreads, preserving alpha olefins industry competitiveness across cycles.
Complete Report Scope:
- By Type
- C4 (1-Butene)
- C6 (1-Hexene)
- C8 (1-Octene)
- Other Types
- By Production Process
- Ethylene Oligomerization
- Fischer-Tropsch Synthesis
- Bio-based Alcohol Dehydration
- By Application
- Polyolefin Comonomers
- Lubricants
- Oil Field Chemicals
- Plasticizers
- Surfactants
- Other Applications
- By End-use Industry
- Packaging
- Automotive
- Oil and Gas
- Cosmetics and Personal Care
- Other End-user Industries
- By Geography
- Asia-Pacific
- China
- India
- Japan
- South Korea
- ASEAN Countries
- Rest of Asia-Pacific
- North America
- United States
- Canada
- Mexico
- Europe
- Germany
- United Kingdom
- Italy
- France
- NORDIC Countries
- Rest of Europe
- South America
- Brazil
- Argentina
- Rest of South America
- Middle-East and Africa
- Saudi Arabia
- South Africa
- Rest of Middle-East and Africa
- Asia-Pacific
Geography Analysis
Asia-Pacific controlled 40.45% of 2025 demand and is set to grow at a 6.89% CAGR, driven by China's USD 10 billion Sinopec-Aramco Fujian complex and India's 7% annual petrochemical consumption uptick. With local alpha olefin capacity trailing demand, regional imports from the Middle-East remain robust, yet upcoming Chinese and Saudi capacities reposition supply chains eastward. Japan and South Korea import high-purity C6/C8 for specialty LLDPE, whereas ASEAN polyolefin demand expands above 6% annually, absorbing incremental alpha olefins market volumes.
North America leverages shale-ethane pricing, enabling ethylene cash costs nearly 50% lower than European naphtha equivalents. Fourteen Gulf Coast crackers totaling 9.19 million tons of ethylene will support co-located LAO units, reinforcing the region's role as a net exporter. Canadian and Mexican deficits ensure cross-border flows, consolidating the continent's feedstock advantage into downstream competitiveness.
Europe faces structural headwinds: high naphtha costs, EU ETS carbon pricing, and plant closures such as SABIC's Geleen Olefins 3 and Teesside crackers removing 500,000 tons of ethylene capacity. The Middle-East, conversely, accelerates ethane-fed expansions like Yasref's planned 1.8 million tons-per-year cracker, bridging Asian demand. South America remains anchored by Braskem in Brazil, but macroeconomic volatility and limited upstream investment restrain growth potential.
- Braskem
- Chevron Phillips Chemical Company LLC
- China Petrochemical Corporation (Sinopec)
- CNOOC & Shell Petrochemicals Company Limited
- Dow
- Evonik Industries AG
- Exxon Mobil Corporation
- Idemitsu Kosan Co., Ltd.
- INEOS
- LG Chem
- Mitsui Chemicals, Inc.
- National Petrochemical Co. (Iran)
- PetroChina Company Limited
- Qatar Chemical Company Ltd
- SABIC
- Sasol Limited
- Shell plc
Additional Benefits:
- The market estimate (ME) sheet in Excel format
- 3 months of analyst support
TABLE OF CONTENTS
1 Introduction
- 1.1 Study Assumptions and Market Definition
- 1.2 Scope of the Study
2 Research Methodology
3 Executive Summary
4 Market Landscape
- 4.1 Market Overview
- 4.2 Market Drivers
- 4.2.1 Surging Polyethylene Comonomer Demand
- 4.2.2 Growth in Synthetic Lubricants
- 4.2.3 Shale-Ethane Cost Advantage in North America
- 4.2.4 Capacity Additions in Emerging Economies
- 4.2.5 EV Thermal Management Fluid Requirements
- 4.3 Market Restraints
- 4.3.1 Ethylene Feedstock Price Volatility
- 4.3.2 Non-Biodegradability of Polyethylene
- 4.3.3 Catalyst Deactivation in Bio-Based LAO Synthesis
- 4.4 Value Chain Analysis
- 4.5 Porter's Five Forces
- 4.5.1 Bargaining Power of Suppliers
- 4.5.2 Bargaining Power of Buyers
- 4.5.3 Threat of New Entrants
- 4.5.4 Threat of Substitutes
- 4.5.5 Degree of Competition
5 Market Size and Growth Forecasts (Volume)
- 5.1 By Type
- 5.1.1 C4 (1-Butene)
- 5.1.2 C6 (1-Hexene)
- 5.1.3 C8 (1-Octene)
- 5.1.4 Other Types
- 5.2 By Production Process
- 5.2.1 Ethylene Oligomerization
- 5.2.2 Fischer-Tropsch Synthesis
- 5.2.3 Bio-based Alcohol Dehydration
- 5.3 By Application
- 5.3.1 Polyolefin Comonomers
- 5.3.2 Lubricants
- 5.3.3 Oil Field Chemicals
- 5.3.4 Plasticizers
- 5.3.5 Surfactants
- 5.3.6 Other Applications
- 5.4 By End-use Industry
- 5.4.1 Packaging
- 5.4.2 Automotive
- 5.4.3 Oil and Gas
- 5.4.4 Cosmetics and Personal Care
- 5.4.5 Other End-user Industries
- 5.5 By Geography
- 5.5.1 Asia-Pacific
- 5.5.1.1 China
- 5.5.1.2 India
- 5.5.1.3 Japan
- 5.5.1.4 South Korea
- 5.5.1.5 ASEAN Countries
- 5.5.1.6 Rest of Asia-Pacific
- 5.5.2 North America
- 5.5.2.1 United States
- 5.5.2.2 Canada
- 5.5.2.3 Mexico
- 5.5.3 Europe
- 5.5.3.1 Germany
- 5.5.3.2 United Kingdom
- 5.5.3.3 Italy
- 5.5.3.4 France
- 5.5.3.5 NORDIC Countries
- 5.5.3.6 Rest of Europe
- 5.5.4 South America
- 5.5.4.1 Brazil
- 5.5.4.2 Argentina
- 5.5.4.3 Rest of South America
- 5.5.5 Middle-East and Africa
- 5.5.5.1 Saudi Arabia
- 5.5.5.2 South Africa
- 5.5.5.3 Rest of Middle-East and Africa
- 5.5.1 Asia-Pacific
6 Competitive Landscape
- 6.1 Market Concentration
- 6.2 Strategic Moves
- 6.3 Market Share (%)/Ranking Analysis
- 6.4 Company Profiles (includes Global-level Overview, Market-level Overview, Core Segments, Financials as available, Strategic Information, Products and Services, and Recent Developments)
- 6.4.1 Braskem
- 6.4.2 Chevron Phillips Chemical Company LLC
- 6.4.3 China Petrochemical Corporation (Sinopec)
- 6.4.4 CNOOC & Shell Petrochemicals Company Limited
- 6.4.5 Dow
- 6.4.6 Evonik Industries AG
- 6.4.7 Exxon Mobil Corporation
- 6.4.8 Idemitsu Kosan Co., Ltd.
- 6.4.9 INEOS
- 6.4.10 LG Chem
- 6.4.11 Mitsui Chemicals, Inc.
- 6.4.12 National Petrochemical Co. (Iran)
- 6.4.13 PetroChina Company Limited
- 6.4.14 Qatar Chemical Company Ltd
- 6.4.15 SABIC
- 6.4.16 Sasol Limited
- 6.4.17 Shell plc
7 Market Opportunities and Future Outlook
- 7.1 Development of Sustainable and Bio-based Alternatives
- 7.2 White-space and Unmet-need Assessment

 聚α烯烴市場-2026-2032年全球市場預測
 1. 六角形化合物市場機會、成長要素、產業趨勢分析及2026-2035年預測
 2026年全球功能性聚烯熱熔膠黏合劑報告α-烯烴市場:依產品類型、製造流程、應用和分銷管道分類-2026-2032年全球市場預測聚α烯烴潤滑脂市場依產品類型、黏度等級、應用、終端用戶產業及銷售管道,全球預測,2026-2032年
 聚羥基烷酯酯 (PHA) 市場規模、佔有率和成長分析(按產品、PHA 類型、生產方法、應用和地區分類)—2026-2033 年產業預測
 α-烯烴市場規模、佔有率和成長分析(按類型、應用和地區分類):產業預測(2026-2033 年)
 阿爾法烯烴市場-全球產業規模、佔有率、趨勢、機會和預測(按類型、應用、地區和競爭細分,2020-2030 年)
 1-Hexene的全球市場全球非晶態α-烯烴共聚物市場