


 |
市場調查報告書
商品編碼
2114998
塑膠回收再利用:市場佔有率分析、產業趨勢與統計、成長預測(2026-2031)Engineering Plastic Recycling - Market Share Analysis, Industry Trends & Statistics, Growth Forecasts (2026 - 2031) |
||||||

※ 本網頁內容可能與最新版本有所差異。詳細情況請與我們聯繫。
據 Mordor Intelligence 稱,工程塑膠回收市場預計到 2026 年將達到 1,611 萬噸,預計到 2031 年將達到 2,206 萬噸,在預測期(2026-2031 年)內以 6.49% 的複合年成長率成長。
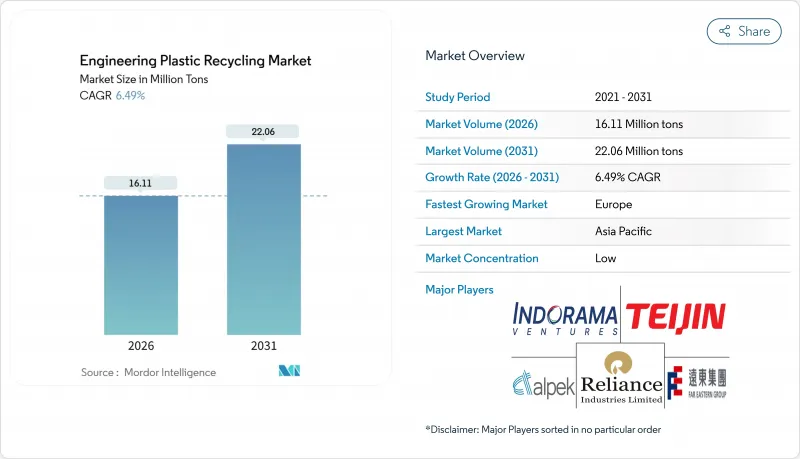
本報告按塑膠類型(PET、氟聚合物等)、終端用戶產業(工業紗線、包裝、建築、汽車、電氣電子及其他終端用戶產業)和地區(亞太、北美、歐洲、南美、中東和非洲)進行細分。市場預測以噸為單位。
全球工程塑膠塑膠回收再利用市場趨勢及洞察
從 2026 年起,政策規定的再生材料含量標準將更加嚴格。
歐盟在其《包裝和包裝廢棄物法規》中設定了具有法律約束力的目標,規定到2030年飲料瓶中再生材料的含量必須達到30%,到2040年達到65%。同時,法國的AGEC法案將此標準應用於汽車和電子元件。加州的SB 54法案規定,違規者每天將被處以5萬美元的罰款,這使得採購再生材料成為節約成本的措施。隨著供應量的增加,這些法規已促使再生塑膠的溢價從2024年的15-25%降至2025年底的5-10%。資金已流入機械回收和化學回收領域,加速了工程塑膠回收市場的擴張。從2026年起,隨著標準的日益嚴格,需求前景的改善和資金籌措風險的降低將進一步推動成長動能。
品牌所有者承諾在 2030 年將其 25-50% 的工程塑膠包裝轉換為再生材料。
聯合利華、寶潔和雀巢已在其全球採購合約中加入了關於再生材料含量的條款,要求從2027年起總合採購超過60萬噸食品級再生PET。長期採購協議為伊士曼田納西州工廠等大型解聚工廠提供了支持,使每個工廠的企劃案融資超過1.5億美元。來自品牌的壓力波及整個供應鏈,促使加工商在阻隔膜、瓶蓋和封口等領域重新認證再生等級。預計這種連鎖反應將在可預見的未來維持塑膠回收再利用市場兩位數的產能成長。
在許多司法管轄區,用於食品接觸用途的再生工程塑膠的批准受到限制。
美國食品藥物管理局 (FDA) 的「無異議函」核准流程費用高達 50 萬美元,每個等級的核准時間最長可達 24 個月,這限制了美國食品級再生聚碳酸酯和聚醯胺的供應。中國缺乏全面的指導方針,迫使品牌商在乳製品和飲料包裝中使用原生樹脂。食品接觸廢棄物分類會降低工廠運轉率,並使分類成本增加約 15%。在監管協調改善之前,這一障礙將阻礙塑膠回收再利用市場的短期成長。
細分市場分析
到2025年,PET將佔塑膠回收再利用市場的97.47%,預計到2031年將以6.51%的複合年成長率成長,這主要得益於飲料和紡織品應用領域回收量的成長。 PET工程塑膠塑膠回收再利用市場正在擴張,這得益於Indorama Ventures新增的40萬噸產能以及歐洲的押金返還機制。
汽車和電子產品原始設備製造商 (OEM) 對具有阻燃性能的機械級和化學回收級聚醯胺的需求不斷成長,推動了市場對聚醯胺的需求。 ChemCycling 生產的聚醯胺 (PA) 價格溢價高達 40%,為回收商提供了穩定的利潤空間。聚碳酸酯的回收正透過機器人分解測試不斷推進,純度已達 85%,從而降低了加工成本。 PMMA、ABS、SAN 和 PEEK 等小眾聚合物目前仍處於中試階段,但隨著溶劑型解聚技術的商業性成熟,預計將湧現出巨大的市場機會。
區域分析
亞太地區預計在2025年仍將佔據塑膠回收再利用市場56.39%的佔有率。這主要得益於中國「國劍行動」政策實施後PET回收產能新增1,200萬噸,以及印度近期產能激增50萬噸。浙江和古吉拉突邦的綜合紡織紡紗廠將PET碎片直接加工成紗線,最大限度地提高了供應鏈效率。日本Jeplan公司在2024年底獲得1.5億美元資金籌措,正在擴大其PET解聚工藝,這凸顯了該地區技術的多元化發展。
歐洲塑膠市場成長最快,複合年成長率達6.55%。每公斤0.80歐元的塑膠稅優惠政策鼓勵品牌商採購再生塑膠。由於押金返還機制,德國和荷蘭的PET回收率超過90%,為伊士曼公司即將在諾曼第投產的年產16萬噸分子運作綜合體提供乾淨的原料。政府補貼和低息綠色債券的發行,不僅簡化了工廠的資金籌措,也提升了該地區的競爭力。
儘管北美市佔率落後,但資本投資步伐正在加快。德克薩斯州、俄亥俄州和田納西州正在建造的八座化學回收工廠專注於為電動車和電子產品原始設備製造商 (OEM) 生產聚醯胺和聚碳酸酯。聯邦政府對清潔製造設施的稅額扣抵以及各州對再生材料含量的強制性規定,正在提高經濟效益,並為再生塑膠的利用創造有利環境。南美、中東和非洲的產量雖然較低,但新計畫的啟動,例如 Braschem Valoren 的聖保羅工廠和 ADNOC Loop 的阿布達先導工廠,反映了塑膠回收再利用市場的全球擴張。
其他好處:
- Excel格式的市場預測(ME)表
- 3個月的分析師支持
目錄
第1章:引言
- 研究假設和市場定義
- 調查範圍
第2章:調查方法
第3章執行摘要
第4章 市場狀況
- 市場概覽
- 市場促進因素
- 從 2026 年起,將收緊以政策為基礎的再生材料含量配額。
- 品牌所有者承諾在 2030 年將 25-50% 的工程塑膠包裝替換為再生材料。
- 電動車和電子設備的溫度控管組件對化學回收的PA和PC等級材料有原始設備製造商(OEM)的需求。
- 數位浮水印技術和人工智慧視覺分類線的出現正在提高混合流的產量。
- 創業投資投資支持的溶劑型解聚工廠減少了 30% 的資本支出 (Capex),並降低了每噸成本。
- 市場限制因素
- 在許多司法管轄區,用於食品接觸用途的R工程塑膠的核准受到限制。
- 捆包價格的波動使得回收商難以預測其投資報酬率。
- 廢棄電子電氣設備塑膠中溴化阻燃劑的濃度過高,導致加工成本上升。
- 價值鏈分析
- 波特五力模型
第5章 市場規模與成長預測
- 按塑膠類型
- PET
- 氟聚合物
- 聚碳酸酯
- 聚縮醛/聚甲醛
- 聚甲基丙烯酸甲酯(PMMA)
- 苯乙烯共聚物(ABS 和 SAN)
- 聚醚醚酮(PEEK)
- 聚醯胺
- 按最終用戶行業分類
- 工業紗線
- 包裝
- 建築/施工
- 車
- 電氣和電子設備
- 其他終端用戶產業
- 按地區
- 亞太地區
- 中國
- 印度
- 日本
- 韓國
- 東南亞國協
- 其他亞太國家
- 北美洲
- 美國
- 加拿大
- 墨西哥
- 歐洲
- 德國
- 英國
- 法國
- 義大利
- 西班牙
- 北歐國家
- 其他歐洲國家
- 南美洲
- 巴西
- 阿根廷
- 其他南美國家
- 中東和非洲
- 沙烏地阿拉伯
- 南非
- 其他中東和非洲國家
- 亞太地區
第6章 競爭情勢
- 市場集中度
- 策略趨勢
- 市佔率/排名分析
- 公司簡介
- Alpek SAB de CV
- Avro India Limited
- BASF
- Clean Tech UK Ltd
- EF Plastics UK Ltd
- Euresi Plastics SL
- Far Eastern Group
- Indorama Corporation
- JFC Group
- Krones AG
- Petco
- Placon
- PolyClean Technologies
- Reliance Industries Limited
- REPRO-PET
- TEIJIN LIMITED
- UltrePET LLC
第7章 市場機會與未來展望
According to Mordor Intelligence, the engineering plastic recycling market size is estimated at 16.11 Million tons in 2026, and is expected to reach 22.06 Million tons by 2031, at a CAGR of 6.49% during the forecast period (2026-2031).
This report is Segmented by Plastic Type (PET, Fluoropolymers, and More), End-User Industry (Industrial Yarn, Packaging, Building and Construction, Automotive, Electrical and Electronics, and Other End-User Industries), and Geography (Asia-Pacific, North America, Europe, South America, and Middle-East and Africa). The Market Forecasts are Provided in Volume (Tons).
Global Engineering Plastic Recycling Market Trends and Insights
Policy-Mandated Recycled-Content Quotas Tightening After 2026
Binding targets in the EU's Packaging and Packaging Waste Regulation compel 30% recycled content in beverage bottles by 2030, rising to 65% by 2040, while France's AGEC law extends quotas to automotive and electronics parts. California's SB 54 exacts fines of USD 50,000 per day for non-compliance, converting recycled-content sourcing into a cost-avoidance measure. These mandates compressed the recycled-resin premium from 15-25% in 2024 to 5-10% by late 2025 as supply scaled. Capital flowed toward both mechanical and chemical lines, accelerating the engineering plastic recycling market expansion. As thresholds tighten after 2026, demand visibility improves and financing risk declines, reinforcing growth momentum.
Brand-Owner Pledges to Shift 25-50% of Engineering-Plastic Packaging to Recycled Feedstock by 2030
Unilever, Procter & Gamble, and Nestle have embedded recycled-content clauses in global procurement contracts, collectively requiring more than 600,000 tons of food-grade recycled PET annually from 2027. Long-term offtake agreements underpin mega-scale depolymerization plants such as Eastman's Tennessee site, enabling project finance exceeding USD 150 million per facility. Brand pressure cascades down supply chains, incentivizing converters to re-qualify recycled grades across barrier film, caps, and closures. The ripple effect sustains double-digit capacity growth in the engineering plastic recycling market during the near term.
Limited Food-Contact Approvals for Recycled Engineering Plastics in Many Jurisdictions
The FDA's letter-of-no-objection process costs USD 500,000 and can last up to 24 months per grade, constraining U.S. supply of food-grade recycled polycarbonate and polyamide. China lacks comprehensive guidelines, pushing brand owners toward virgin resin for dairy and beverage packaging. Segregated food-contact streams lower plant utilization and raise sortation costs by around 15%. Until regulatory convergence improves, this hurdle tempers near-term uptake in the engineering plastic recycling market.
Other drivers and restraints analyzed in the detailed report include:
- OEM Demand for Chemically Recycled PA and PC Grades in EV and Electronics Thermal-Management Parts
- Emergence of Digital Watermarking and AI-Vision Sorting Lines Boosting Yield of Mixed Streams
- Volatility in Bale Pricing Making ROI Unpredictable for Recyclers
For complete list of drivers and restraints, kindly check the Table Of Contents.
Segment Analysis
PET held 97.47% of engineering plastic recycling market share in 2025, and the segment is on track for 6.51% CAGR through 2031 as beverage and textile applications absorb rising recycled volumes. The engineering plastic recycling market size for PET is growing, supported by Indorama Ventures' 400,000-ton capacity additions and Europe's deposit-return schemes.
Polyamide demand growth is propelled by automotive and electronics OEM specifications for mechanically and chemically recycled grades with flame-retardant performance. ChemCycling-sourced PA commands a 40% price premium, offering recyclers margin resilience. Polycarbonate recycling advances through robotic disassembly trials that attain 85% purity, reducing processing cost curves. PMMA, ABS, SAN, and niche polymers such as PEEK remain at pilot-scale but present white-space opportunities as solvent-based depolymerization reaches commercial maturity.
Complete Report Scope:
- By Plastic Type
- PET
- Fluoropolymers
- Polycarbonate
- Polyacetal/ Polyoxymethylene
- Polymethyl Methacrylate (PMMA)
- Styrene Copolymers (ABS and SAN)
- Polyether Ether Ketone (PEEK)
- Polyamide
- By End-user Industry
- Industrial Yarn
- Packaging
- Building and Construction
- Automotive
- Electrical and Electronics
- Other End-User Industries
- By Geography
- Asia-Pacific
- China
- India
- Japan
- South Korea
- ASEAN Countries
- Rest of Asia-Pacific
- North America
- United States
- Canada
- Mexico
- Europe
- Germany
- United Kingdom
- France
- Italy
- Spain
- NORDIC Countries
- Rest of Europe
- South America
- Brazil
- Argentina
- Rest of South America
- Middle-East and Africa
- Saudi Arabia
- South Africa
- Rest of Middle-East and Africa
- Asia-Pacific
Geography Analysis
Asia-Pacific retained 56.39% share of the engineering plastic recycling market in 2025, buttressed by China's 12 million-ton PET-recycling build-out after the National Sword policy and by India's recent 500,000-ton capacity surge. Integrated fiber-spinning sites in Zhejiang and Gujarat convert flake directly into yarn, maximizing supply-chain efficiency. Japan's Jeplan, funded with USD 150 million in late 2024, scales PET depolymerization, underscoring regional technology diversification.
Europe records the fastest growth at 6.55% CAGR as the EUR 0.80/kg plastic-tax differential incentivizes brand owners to source recycled grades. Deposit-return schemes push PET collection above 90% in Germany and the Netherlands, supplying clean feedstock to Eastman's forthcoming 160,000-ton Normandy molecular-recycling complex. Government grants and low-interest green bonds facilitate plant financing, strengthening regional competitive positions.
North America trails in share yet accelerates capital deployment. Eight chemical-recycling plants under construction in Texas, Ohio, and Tennessee focus on polyamide and polycarbonate grades for EV and electronics OEMs. Federal tax credits for clean-manufacturing equipment and state-level recycled-content mandates narrow economics in favor of recycled resin. South America and the Middle East and Africa account for smaller volumes but register new projects such as Braskem-Valoren's Sao Paulo plant and ADNOC-Loop's Abu Dhabi pilot, reflecting global proliferation of the engineering plastic recycling market.
- Alpek S.A.B. de C.V.
- Avro India Limited
- BASF
- Clean Tech UK Ltd
- EF Plastics UK Ltd
- Euresi Plastics SL
- Far Eastern Group
- Indorama Corporation
- JFC Group
- Krones AG
- Petco
- Placon
- PolyClean Technologies
- Reliance Industries Limited
- REPRO-PET
- TEIJIN LIMITED
- UltrePET LLC
Additional Benefits:
- The market estimate (ME) sheet in Excel format
- 3 months of analyst support
TABLE OF CONTENTS
1 Introduction
- 1.1 Study Assumptions and Market Definition
- 1.2 Scope of the Study
2 Research Methodology
3 Executive Summary
4 Market Landscape
- 4.1 Market Overview
- 4.2 Market Drivers
- 4.2.1 Policy-Mandated Recycled-Content Quotas Tightening After 2026
- 4.2.2 Brand-Owner Pledges to Shift 25-50 % of Engineering-Plastic Packaging to Recycled Feedstock by 2030
- 4.2.3 OEM Demand for Chemically Recycled PA and PC Grades in EV And Electronics Thermal-Management Parts
- 4.2.4 Emergence of Digital Water-Marking and AI-Vision Sorting Lines Boosting Yield of Mixed Streams
- 4.2.5 Venture-Backed Solvent-Based Depolymerisation Plants Achieving 30 % Capex/Ton Cost Reduction
- 4.3 Market Restraints
- 4.3.1 Limited Food-Contact Approvals For R-Engineering Plastics in Many Jurisdictions
- 4.3.2 Volatility In Bale Pricing Making ROI Unpredictable for Recyclers
- 4.3.3 High Brominated-Flame-Retardant Content in WEEE Plastics Raising Processing Cost
- 4.4 Value Chain Analysis
- 4.5 Porter's Five Forces
- 4.5.1 Bargaining Power of Suppliers
- 4.5.2 Bargaining Power of Consumers
- 4.5.3 Threat of New Entrants
- 4.5.4 Threat of Substitute Products and Services
- 4.5.5 Degree of Competition
5 Market Size and Growth Forecasts (Volume)
- 5.1 By Plastic Type
- 5.1.1 PET
- 5.1.2 Fluoropolymers
- 5.1.3 Polycarbonate
- 5.1.4 Polyacetal/ Polyoxymethylene
- 5.1.5 Polymethyl Methacrylate (PMMA)
- 5.1.6 Styrene Copolymers (ABS and SAN)
- 5.1.7 Polyether Ether Ketone (PEEK)
- 5.1.8 Polyamide
- 5.2 By End-user Industry
- 5.2.1 Industrial Yarn
- 5.2.2 Packaging
- 5.2.3 Building and Construction
- 5.2.4 Automotive
- 5.2.5 Electrical and Electronics
- 5.2.6 Other End-User Industries
- 5.3 By Geography
- 5.3.1 Asia-Pacific
- 5.3.1.1 China
- 5.3.1.2 India
- 5.3.1.3 Japan
- 5.3.1.4 South Korea
- 5.3.1.5 ASEAN Countries
- 5.3.1.6 Rest of Asia-Pacific
- 5.3.2 North America
- 5.3.2.1 United States
- 5.3.2.2 Canada
- 5.3.2.3 Mexico
- 5.3.3 Europe
- 5.3.3.1 Germany
- 5.3.3.2 United Kingdom
- 5.3.3.3 France
- 5.3.3.4 Italy
- 5.3.3.5 Spain
- 5.3.3.6 NORDIC Countries
- 5.3.3.7 Rest of Europe
- 5.3.4 South America
- 5.3.4.1 Brazil
- 5.3.4.2 Argentina
- 5.3.4.3 Rest of South America
- 5.3.5 Middle-East and Africa
- 5.3.5.1 Saudi Arabia
- 5.3.5.2 South Africa
- 5.3.5.3 Rest of Middle-East and Africa
- 5.3.1 Asia-Pacific
6 Competitive Landscape
- 6.1 Market Concentration
- 6.2 Strategic Moves
- 6.3 Market Share/Ranking Analysis
- 6.4 Company Profiles (includes Global level Overview, Market level overview, Core Segments, Financials as available, Strategic Information, Market Rank/Share for key companies, Products and Services, and Recent Developments)
- 6.4.1 Alpek S.A.B. de C.V.
- 6.4.2 Avro India Limited
- 6.4.3 BASF
- 6.4.4 Clean Tech UK Ltd
- 6.4.5 EF Plastics UK Ltd
- 6.4.6 Euresi Plastics SL
- 6.4.7 Far Eastern Group
- 6.4.8 Indorama Corporation
- 6.4.9 JFC Group
- 6.4.10 Krones AG
- 6.4.11 Petco
- 6.4.12 Placon
- 6.4.13 PolyClean Technologies
- 6.4.14 Reliance Industries Limited
- 6.4.15 REPRO-PET
- 6.4.16 TEIJIN LIMITED
- 6.4.17 UltrePET LLC
7 Market Opportunities and Future Outlook
- 7.1 White-space and Unmet-Need Assessment

 纖維增強塑膠(FRP)回收市場-2026-2032年全球市場預測溶劑型塑膠回收再利用市場-2026-2032年全球市場預測塑膠回收再利用市場:2026-2032年全球市場預測(依樹脂類型、技術、來源、產品產量、回收模式、最終用途及買家類型分類)
 循環經濟下的塑膠回收再利用市場預測——按塑膠類型、回收技術、循環經濟模式、最終用戶和地區分類的全球分析——2034年
 微塑膠市場規模、佔有率和趨勢分析報告:按來源、聚合物類型、最終用途、地區和細分市場預測(2026-2033 年)循環塑膠經濟市場預測至2034年—全球循環策略、塑膠類型、技術、應用、最終用戶和區域分析溶劑型塑膠回收再利用市場規模、佔有率和趨勢分析報告:按產品、應用、地區和細分市場預測(2026-2033 年)
 塑膠回收再利用:全球市場
 塑膠回收 - 技術和全球市場分析塑膠顆粒混合機市場:按機器類型、材料類型、產量、控制方式、最終用戶和銷售管道,全球預測(2026-2032年)