


 |
市場調查報告書
商品編碼
2114982
磁性材料:市場佔有率分析、產業趨勢與統計、成長預測(2026-2031)Magnetic Materials - Market Share Analysis, Industry Trends & Statistics, Growth Forecasts (2026 - 2031) |
||||||

※ 本網頁內容可能與最新版本有所差異。詳細情況請與我們聯繫。
根據 Mordor Intelligence 估計,2025 年磁性材料市場規模為 3,126 萬噸,預計到 2031 年將從 2026 年的 3,318 萬噸成長至 4,468 萬噸,預測期(2026-2031 年)複合年成長率為 6.13%。
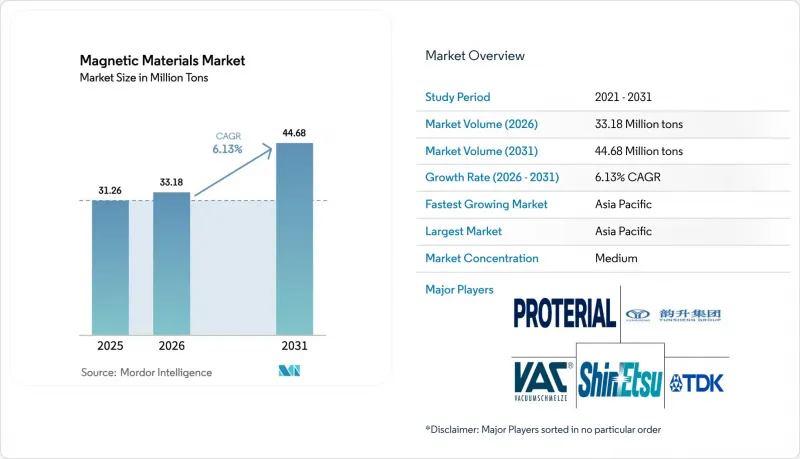
本報告按材料(釹、鐵、硼、鐵氧體、其他)、類型(硬/永磁材料、軟磁性材料、半硬磁性材料)、應用(電動機/發電機、變壓器/電感器、其他)、最終用戶行業(電子、汽車、其他)和地區(亞太地區、北美、歐洲、南美、中東和非洲)進行分類。
全球磁性材料市場趨勢與洞察
電動車的日益普及推動了對磁性材料的需求。
2024年,用於電池式電動車(BEV)的釹鐵硼磁鐵消耗量為2800噸,但隨著電動車年銷量接近3,000萬輛,預計到2030年這一數字將超過8,000噸。永磁同步馬達的尖峰效率已超過96%,汽車製造商正在投資稀土元素材料以在不增加電池容量的情況下延長續航里程。特斯拉的「4680電池」設計和比亞迪的「刀片電池組」均採用多馬達佈局,與單馬達汽車相比,每輛車的磁鐵用量加倍。預計中國將在2025年生產950萬輛電動車,這將消耗國內大部分燒結磁體產能,導致出口供應緊張。歐洲平台向800伏特架構過渡需要能夠承受熱退磁的高矯頑力磁體,這增加了磁性材料市場對鏑的需求。
採用無齒輪傳動發電機組進行併網風力發電機
直驅風力發電機無需齒輪箱,機械損耗降低2-3個百分點,維修週期從6個月延長至18個月。金風科技的16兆瓦離岸風電專案使用了約12噸釹鐵硼磁體,而2026年新增的40吉瓦離岸風力發電專案可能需要約3萬噸磁鐵。中國供應全球60%的風力發電機,因此即使是海外項目,磁體需求也主要來自國內。西門子歌美颯和維斯塔斯正在試行使用回收釹鐵硼磁體,但由於再加工會降低高達15%的磁通量,閉合迴路材料消耗量仍低於總量的5%。北海業者目前已將耐腐蝕塗層作為標準配置,雖然每公斤成本增加2-3美元,但可在25年的使用壽命週期內降低起重船的維修成本。
經合組織國家對稀土元素開採的環境、社會和治理(ESG)擔憂日益加劇。
在美國和澳大利亞,新建稀土元素礦的核准時間平均需要7到10年,是2015年的兩倍。這是因為監管機構要求對尾礦水的處理提供永久性保證。萊納斯公司(Linus Corporation)暫停了其位於卡爾古利(Kalgoorlie)提煉的擴建工程長達18個月,期間一直在就殘渣處置條款進行談判。這表明,即使是現有設施的維修項目,也可能因為社會認可問題而面臨延誤。環保組織已就芒廷帕斯(Mountain Pass)礦區的放射性核素排放問題起訴MP Materials公司,這提高了磁性材料市場的合規成本。歐盟的《基本材料法》規定,到2030年,在地採購率必須達到10%,但由於歐洲沒有新的礦場運作,歐盟不得不依賴在亞洲的合約提煉。由於這些不利因素,如果氧化釹的價格超過每公斤 80 美元,OEM 廠商將轉向「無磁鐵」馬達設計,以減少對稀土元素的依賴,即使這會犧牲 3-5% 的效率。
細分市場分析
釹鐵硼(NdFeB)在2025年的出貨量佔比高達44.21%。這反映了其無與倫比的能量密度,使其能夠在不影響扭矩的情況下將轉子尺寸縮小50%。儘管其佔據主導地位,價格也居高不下,但不斷上漲的鏑成本正促使原始設備製造商(OEM)繼續在磁性材料市場尋找替代品。預計到2031年,鐵氧體將以6.28%的複合年成長率成長,因為行動電話製造商將在觸覺反饋和充電模組中用注塑成型的鐵氧體取代射出成型釹鐵硼。這可以消除稀土元素風險,但代價是性能降低20%。鎬鈷用於航太和下行運輸工具等細分市場,在這些市場中,釹鐵硼在200°C以上的環境中會失去磁通量。儘管其產量仍低於3000噸,但由於其價格超過每公斤100美元,因此仍能保持盈利。鋁鎳鈷合金主要用於老式感測器和樂器拾音器,而電工鋼片則因變壓器和馬達層壓板的需求而備受青睞,這支撐了磁性材料市場的基礎。高品質奈米晶帶材在資料中心電源(PSU)等高頻應用領域佔據了一定的市場佔有率,使其成為量產通用產品中利潤尤為豐厚的一個細分市場。
到2025年,軟磁性材料將佔總出貨量的61.23%,這主要得益於變壓器鐵芯、電感器和定子疊片等每秒磁化數千次的元件。對取向電工鋼的新投資正推動電力公司努力降低配電變壓器的空載損耗。同時,硬磁材料/永久磁鐵市場正以6.98%的複合年成長率持續成長,直至2031年。這主要歸因於磁性材料市場的加速成長,電動車、風力發電機和工業機器人擴大採用多永磁電機。隨著設計人員轉向使用釹鐵硼材料實現永久偏置或重新使用鐵氧體材料實現可切換磁場,中等矯頑力的半硬磁體正逐步退出市場。全球能源效率法規(IE4/IE5)幾乎強制要求使用永久磁鐵以滿足監管標準,這進一步推動了向硬磁性材料的轉變。同時,USB Power Delivery (PD) 充電器進一步推動了消費性電子產品中高磁通量電感器對軟鐵氧體的需求。
區域分析
預計到2025年,亞太地區將佔全球總產量的67.23%,並在2031年之前以7.77%的複合年成長率成長。這主要得益於中國18萬噸釹鐵硼的產量、日本高矯頑力特種產品以及韓國不斷擴大的磁阻隨機存取記憶體(MRAM)產量。 2025年,中國將生產鐵氧體、電工鋼片和燒結釹鐵硼等關鍵磁性材料,大型垂直整合企業透過管理從氧化物生產到加工的各個環節,維持低成本和短交貨期。日本信越化學和TDK公司在矯頑力分別為50 MGOe以上和30 kOe以上的優質釹鐵硼市場佔據主導地位,其產品價格比通用型釹鐵硼磁塊高出30-40%。印度正在崛起成為國內智慧型手機和摩托車用鐵氧體的中心,但稀土元素氧化物仍依賴進口,並且容易受到中國政策變化的影響。
北美市佔率維持適中,MP Materials公司第二階段合金生產線預計到2027年將進口依賴度降至70%。然而,加拿大試點分離產能仍低於1000噸,甚至不足以滿足一家汽車製造商的需求。在歐洲,本地磁體產能僅能滿足5%的需求。 VACUUMSCHMELZE和Proterial公司為資料中心磁芯提供的材料仍然依賴中國製造的帶材,這表明將整個供應鏈恢復到國內生產仍然困難重重。南美洲、中東和非洲的市佔率成長主要得益於礦業設施和電網的升級改造,雖然巴西正在考慮從鐵礦石尾礦中提取稀土元素,但這項技術可能要到2028年才能商業化。
其他福利
- Excel格式的市場預測(ME)表
- 3個月的分析師支持
目錄
第1章:引言
- 研究假設和市場定義
- 調查範圍
第2章:調查方法
第3章執行摘要
第4章 市場狀況
- 市場概覽
- 市場促進因素
- 電動車的日益普及推動了對磁性材料的需求。
- 採用無齒輪傳動發電機組進行併網風力發電機
- 人工智慧驅動的工廠自動化正在推動對感測器用磁鐵的需求成長。
- 機器人和自動化技術的日益普及正在加速磁性材料的需求。
- 高頻電力電子裝置需要奈米晶體內核。
- 市場限制因素
- 經合組織國家對稀土元素開採的環境、社會和治理(ESG)擔憂日益加劇。
- 中國對釹和鏑氧化物的出口管制風險
- 封閉回路型釹鐵硼回收的擴張速度正在放緩。
- 價值鏈分析
- 監理展望
- 波特五力模型
第5章 市場規模與成長預測
- 材料
- 釹鐵硼(NdFeB)
- 鐵氧體
- 釤鈷(SmCo)
- 鋁鎳鈷合金(AlNiCo)
- 其他材料(電磁鋼片(GO 和 NGO)、奈米晶和非晶合金)
- 按類型
- 軟磁性材料
- 硬磁性/永久磁性材料
- 半硬磁性材料
- 透過使用
- 電動機和發電機
- 變壓器和電感器
- 感測器和執行器
- 磁性儲存(MRAM)
- 磁冷
- EMI/EMC元件
- 按最終用戶行業分類
- 電子設備
- 車
- 發電
- 產業
- 其他終端用戶產業(消費性電子、醫療、航太等)
- 按地區
- 亞太地區
- 中國
- 印度
- 日本
- 韓國
- ASEAN
- 其他亞太國家
- 北美洲
- 美國
- 加拿大
- 墨西哥
- 歐洲
- 德國
- 英國
- 義大利
- 法國
- 北歐國家
- 其他歐洲國家
- 南美洲
- 巴西
- 阿根廷
- 其他南美國家
- 中東和非洲
- 沙烏地阿拉伯
- 南非
- 其他中東和非洲國家
- 亞太地區
第6章 競爭情勢
- 市場集中度
- 策略趨勢
- 市佔率和排名分析
- 公司簡介
- Adams Magnetic Products
- ArcelorMittal
- Arnold Magnetic Technologies
- Daido Steel Co., Ltd.
- Dexter Magnetic Technologies
- DMEGC Magnetics Co., Ltd.
- Electron Energy Corporation
- GKN Powder Metallurgy
- Hengdian Group Holdings Limited
- Lynas Rare Earths Ltd.
- MP Materials Corp.
- NEO
- Ningbo Yunsheng Co., Ltd.
- Niterra Materials Co., Ltd.
- Proterial, Ltd.
- Quadrant
- Shin-Etsu Chemical Co., Ltd.
- Steward Advanced Materials LLC
- TDK Corporation
- VACUUMSCHMELZE GmbH & Co. KG
第7章 市場機會與未來展望
According to Mordor Intelligence, the magnetic materials market size was valued at 31.26 Million tons in 2025 and is estimated to grow from 33.18 Million tons in 2026 to reach 44.68 Million tons by 2031, at a CAGR of 6.13% during the forecast period (2026-2031).
This report is Segmented by Material (Neodymium-Iron-Boron, Ferrite, and More), Type (Hard/Permanent Magnetic Materials, Soft Magnetic Materials, and Semi-Hard Magnetic Materials), Application (Motors and Generators, Transformers and Inductors, and More), End-User Industry (Electronics, Automotive, and More), and Geography (Asia-Pacific, North America, Europe, South America, and Middle-East and Africa).
Global Magnetic Materials Market Trends and Insights
Rising Electric Vehicle Adoption Fuels Demand for Magnetic Materials
Battery-electric vehicles consumed 2,800 tons of NdFeB magnets in 2024 and are projected to exceed 8,000 tons by 2030 as annual EV sales approach 30 million units. Permanent-magnet synchronous motors achieve peak efficiencies above 96%, prompting OEMs to spend on rare-earth grades to extend driving range without larger batteries. Tesla's 4680-cell design and BYD's Blade pack both use multi-motor layouts that double magnet content per vehicle versus single-motor cars. China built 9.5 million EVs in 2025, absorbing most domestic sintered-magnet output and tightening export supply. European platforms moving to 800-volt architectures require high-coercivity magnets able to withstand thermal demagnetization, which lifts dysprosium demand in the magnetic materials market.
Grid-Scale Wind-Turbine Gearless Generators Adoption
Direct-drive turbines remove gearboxes and cut mechanical losses by 2-3 percentage points, extending service intervals from six to eighteen months. Goldwind's 16 MW offshore unit contains about 12 tons of NdFeB, and 2026 offshore additions of 40 GW could draw roughly 30,000 tons of magnets. China supplies 60% of global turbines, so most magnet demand originates domestically even for projects installed abroad. Siemens Gamesa and Vestas trial recycled NdFeB, yet closed-loop material remains under 5% of consumption because reprocessing degrades flux up to 15%. North Sea operators now specify corrosion-resistant coatings that add USD 2-3 per kilogram but cut crane-vessel repair costs over 25-year lifecycles.
REE Mining ESG Backlash Intensifies in OECD Nations
Permitting for new rare-earth mines in the United States and Australia now averages 7-10 years, double the 2015 timeline, because regulators require perpetual tailings-water treatment bonds. Lynas paused its Kalgoorlie refinery expansion for 18 months while negotiating residue-disposal terms, proving even brownfield projects face social-license delays. Environmental groups have sued MP Materials over radionuclide discharge at Mountain Pass, elevating compliance costs in the magnetic materials market. The EU's Critical Raw Materials Act demands 10% local supply by 2030, yet no new European mine is online, forcing the bloc to rely on toll refining in Asia. These headwinds are nudging OEMs toward magnet-free motor designs that trade 3-5% efficiency for rare-earth independence when neodymium oxide tops USD 80/kg.
Other drivers and restraints analyzed in the detailed report include:
- AI-Enabled Factory Automation Boosts Sensor Magnets
- High-Frequency Power Electronics Need Nanocrystalline Cores
- China Export-Control Risk on Nd and Dy Oxides
For complete list of drivers and restraints, kindly check the Table Of Contents.
Segment Analysis
Neodymium-Iron-Boron (NdFeB) commanded 44.21% of 2025 volume, reflecting its unmatched energy product that lets motor makers halve rotor size without losing torque. That dominance locks in premium pricing, yet rising dysprosium cost keeps OEMs searching for alternatives in the magnetic materials market. Ferrite is slated to grow at a 6.28% CAGR through 2031 as handset makers replace bonded NdFeB with injection-molded ferrite in haptic and charging modules, trading 20% performance for zero rare-earth risk. Samarium-cobalt serves niche aerospace and downhole-tool markets above 200 °C, where NdFeB loses flux; volumes stay under 3,000 tons, but prices above USD 100/kg keep profitability intact. AlNiCo is useful mainly in legacy sensors and musical pickups, while electrical steel drives high demand thanks to transformers and motor laminations, anchoring the magnetic materials market. Premium nanocrystalline ribbons win high-frequency slots in data-center PSUs, a pocket of outsized margin amid commodity tonnage.
Soft magnetic materials held 61.23% tonnage in 2025, buoyed by transformer cores, inductors, and stator laminations that cycle magnetization thousands of times per second. Grain-oriented electrical steel is enjoying fresh investment because utilities target lower no-load losses in distribution transformers. Hard/permanent magnets, however, are expanding at a 6.98% CAGR through 2031, because each electric vehicle, wind turbine, or industrial robot adds multiple permanent-magnet motors, accelerating growth in the magnetic materials market. Semi-hard grades, with intermediate coercivity, are being squeezed out as designers either jump to NdFeB for permanent bias or retreat to ferrite for switchable fields. Global efficiency rules (IE4/IE5) almost require permanent magnets to meet regulatory thresholds, reinforcing the tilt toward hard materials. Meanwhile, USB Power Delivery chargers drive more soft-ferrite demand for high-flux inductors in consumer electronics.
Complete Report Scope:
- By Material
- Neodymium-Iron-Boron (NdFeB)
- Ferrite
- Samarium-Cobalt (SmCo)
- Aluminum-Nickel-Cobalt (AlNiCo)
- Other Materials (Electrical Steel (GO and NGO), Nanocrystalline and Amorphous Alloys)
- By Type
- Soft Magnetic Materials
- Hard/Permanent Magnetic Materials
- Semi-Hard Magnetic Materials
- By Application
- Electric Motors and Generators
- Transformers and Inductors
- Sensors and Actuators
- Magnetic Storage and MRAM
- Magnetic Refrigeration
- EMI / EMC Components
- By End-user Industry
- Electronics
- Automotive
- Power Generation
- Industrial
- Other End-user Industries (Home Appliances, Healthcare, Aerospace, etc.)
- By Geography
- Asia-Pacific
- China
- India
- Japan
- South Korea
- ASEAN Countries
- Rest of Asia-Pacific
- North America
- United States
- Canada
- Mexico
- Europe
- Germany
- United Kingdom
- Italy
- France
- NORDIC Countries
- Rest of Europe
- South America
- Brazil
- Argentina
- Rest of South America
- Middle-East and Africa
- Saudi Arabia
- South Africa
- Rest of Middle-East and Africa
- Asia-Pacific
Geography Analysis
Asia-Pacific captured 67.23% of 2025 tonnage and is on track for a 7.77% CAGR to 2031, reflecting China's 180,000-ton NdFeB output, Japan's high-coercivity specialties, and South Korea's MRAM scale-up. China produced major magnetic materials in 2025 across ferrite, electrical steel, and sintered NdFeB, with vertically integrated majors controlling oxide through machining, which sustains low cost and rapid lead times. Japan's Shin-Etsu and TDK dominate premium grades above 50 MGOe and 30 kOe coercivity, securing 30-40% price premiums over commodity blocks. India is emerging as a ferrite hub for domestic smartphones and two-wheelers, but still imports 95% of rare-earth oxides, exposing it to Chinese policy shifts.
North America held a moderate share, and MP Materials' Stage II alloy line will shave import dependence to 70% by 2027, yet Canada's pilot separation capacity remains under 1,000 tons, insufficient for even one automaker. In Europe, local magnet capacity covers barely 5% of need; VACUUMSCHMELZE and Proterial feed data-center cores yet rely on Chinese ribbon, showing the difficulty of onshoring full supply chains. South America and the Middle East and Africa's shares are driven by mining equipment and grid upgrades, with Brazil exploring rare-earth extraction from iron-ore tailings that may not commercialize before 2028.
- Adams Magnetic Products
- ArcelorMittal
- Arnold Magnetic Technologies
- Daido Steel Co., Ltd.
- Dexter Magnetic Technologies
- DMEGC Magnetics Co., Ltd.
- Electron Energy Corporation
- GKN Powder Metallurgy
- Hengdian Group Holdings Limited
- Lynas Rare Earths Ltd.
- MP Materials Corp.
- NEO
- Ningbo Yunsheng Co., Ltd.
- Niterra Materials Co., Ltd.
- Proterial, Ltd.
- Quadrant
- Shin-Etsu Chemical Co., Ltd.
- Steward Advanced Materials LLC
- TDK Corporation
- VACUUMSCHMELZE GmbH & Co. KG
Additional Benefits:
- The market estimate (ME) sheet in Excel format
- 3 months of analyst support
TABLE OF CONTENTS
1 Introduction
- 1.1 Study Assumptions and Market Definition
- 1.2 Scope of the Study
2 Research Methodology
3 Executive Summary
4 Market Landscape
- 4.1 Market Overview
- 4.2 Market Drivers
- 4.2.1 Rising Electric Vehicle Adoption Fuels Demand for Magnetic Materials
- 4.2.2 Grid-Scale Wind-Turbine Gearless Generators Adoption
- 4.2.3 AI-Enabled Factory Automation Boosts Sensor Magnets
- 4.2.4 Growing Robotics and Automation Usage Accelerates Magnetic Materials Demand
- 4.2.5 High-Frequency Power Electronics Need Nanocrystalline Cores
- 4.3 Market Restraints
- 4.3.1 REE Mining ESG Backlash Intensifies in OECD Nations
- 4.3.2 China Export-Control Risk on Nd and Dy Oxides
- 4.3.3 Slow Scale-Up Of Closed-Loop NdFeB Recycling
- 4.4 Value Chain Analysis
- 4.5 Regulatory Outlook
- 4.6 Porter's Five Forces
- 4.6.1 Bargaining Power of Suppliers
- 4.6.2 Bargaining Power of Buyers
- 4.6.3 Threat of New Entrants
- 4.6.4 Threat of Substitutes
- 4.6.5 Degree of Competition
5 Market Size and Growth Forecasts (Volume)
- 5.1 By Material
- 5.1.1 Neodymium-Iron-Boron (NdFeB)
- 5.1.2 Ferrite
- 5.1.3 Samarium-Cobalt (SmCo)
- 5.1.4 Aluminum-Nickel-Cobalt (AlNiCo)
- 5.1.5 Other Materials (Electrical Steel (GO and NGO), Nanocrystalline and Amorphous Alloys)
- 5.2 By Type
- 5.2.1 Soft Magnetic Materials
- 5.2.2 Hard/Permanent Magnetic Materials
- 5.2.3 Semi-Hard Magnetic Materials
- 5.3 By Application
- 5.3.1 Electric Motors and Generators
- 5.3.2 Transformers and Inductors
- 5.3.3 Sensors and Actuators
- 5.3.4 Magnetic Storage and MRAM
- 5.3.5 Magnetic Refrigeration
- 5.3.6 EMI / EMC Components
- 5.4 By End-user Industry
- 5.4.1 Electronics
- 5.4.2 Automotive
- 5.4.3 Power Generation
- 5.4.4 Industrial
- 5.4.5 Other End-user Industries (Home Appliances, Healthcare, Aerospace, etc.)
- 5.5 By Geography
- 5.5.1 Asia-Pacific
- 5.5.1.1 China
- 5.5.1.2 India
- 5.5.1.3 Japan
- 5.5.1.4 South Korea
- 5.5.1.5 ASEAN Countries
- 5.5.1.6 Rest of Asia-Pacific
- 5.5.2 North America
- 5.5.2.1 United States
- 5.5.2.2 Canada
- 5.5.2.3 Mexico
- 5.5.3 Europe
- 5.5.3.1 Germany
- 5.5.3.2 United Kingdom
- 5.5.3.3 Italy
- 5.5.3.4 France
- 5.5.3.5 NORDIC Countries
- 5.5.3.6 Rest of Europe
- 5.5.4 South America
- 5.5.4.1 Brazil
- 5.5.4.2 Argentina
- 5.5.4.3 Rest of South America
- 5.5.5 Middle-East and Africa
- 5.5.5.1 Saudi Arabia
- 5.5.5.2 South Africa
- 5.5.5.3 Rest of Middle-East and Africa
- 5.5.1 Asia-Pacific
6 Competitive Landscape
- 6.1 Market Concentration
- 6.2 Strategic Moves
- 6.3 Market Share(%)/Ranking Analysis
- 6.4 Company Profiles (includes Global level Overview, Market level overview, Core Segments, Financials as available, Strategic Information, Products and Services, and Recent Developments)
- 6.4.1 Adams Magnetic Products
- 6.4.2 ArcelorMittal
- 6.4.3 Arnold Magnetic Technologies
- 6.4.4 Daido Steel Co., Ltd.
- 6.4.5 Dexter Magnetic Technologies
- 6.4.6 DMEGC Magnetics Co., Ltd.
- 6.4.7 Electron Energy Corporation
- 6.4.8 GKN Powder Metallurgy
- 6.4.9 Hengdian Group Holdings Limited
- 6.4.10 Lynas Rare Earths Ltd.
- 6.4.11 MP Materials Corp.
- 6.4.12 NEO
- 6.4.13 Ningbo Yunsheng Co., Ltd.
- 6.4.14 Niterra Materials Co., Ltd.
- 6.4.15 Proterial, Ltd.
- 6.4.16 Quadrant
- 6.4.17 Shin-Etsu Chemical Co., Ltd.
- 6.4.18 Steward Advanced Materials LLC
- 6.4.19 TDK Corporation
- 6.4.20 VACUUMSCHMELZE GmbH & Co. KG
7 Market Opportunities and Future Outlook
- 7.1 White-space and Unmet-Need Assessment

 磁性材料市場預測至2034年-全球材料類型、材料組、產品形式、製造流程、應用、終端用戶產業和地區分析
 磁性材料市場-2026-2032年全球市場預測先進磁性材料市場預測至2034年-按材料類型、磁性、加工技術、磁通密度、分銷管道、最終用戶和地區分類的全球分析
 2026-2030年全球磁性材料市場
 磁性材料市場:按產品類型、應用和地區分類先進磁性材料市場:按材料類型、應用和最終用戶分類 - 2026-2032年全球市場預測
 全球電動車磁鐵市場(到 2030 年):按磁鐵類型(釹鐵硼、釤鈷、鋁鎳鈷、鐵氧體)、車輛類型(搭乘用電動車、電動巴士和卡車)、額定功率、應用和地區分類。
 磁光材料:全球市佔率及排名、總收入及需求預測(2026-2032年)
 2026年全球磁性材料市場報告SmFeN稀土元素永磁材料市場按產品類型、製造程序、應用、等級和最終用途行業分類,全球預測(2026-2032年)