


 |
市場調查報告書
商品編碼
2114974
食品級潤滑劑:市場佔有率分析、行業趨勢和統計數據以及成長預測(2026-2031 年)Food Grade Lubricants - Market Share Analysis, Industry Trends & Statistics, Growth Forecasts (2026 - 2031) |
||||||

※ 本網頁內容可能與最新版本有所差異。詳細情況請與我們聯繫。
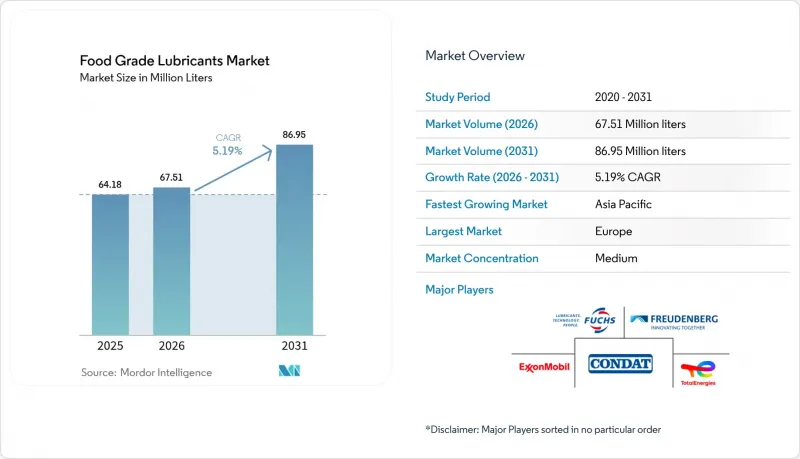
據 Mordor Intelligence 稱,2025 年食品級潤滑油市場價值為 6,418 萬公升,預計到 2031 年將達到 8,695 萬公升,而 2026 年為 6,751 萬公升,預測期(2026-2031 年)的複合年成長率為 5.19%。
本報告按分類(H1、H2、H3)、基礎油(礦物油、合成油、生物基油)、產品類型(潤滑脂、液壓油、齒輪油、其他產品)、最終用戶產業(食品飲料、化妝品、食用油、其他)和地區(亞太地區、北美、歐洲、南美、中東和非洲)進行分類。
全球食品級潤滑油市場趨勢及洞察
全球食品安全法規日趨嚴格。
世界各國政府正攜手收緊食品接觸潤滑油的監管,迫使潤滑油供應商改進配方,否則將面臨被吊銷註冊資格的風險。中國修訂後的GB 2760-2024擴大了該國的正面表列,並堵住了加工助劑方面的漏洞,從而導致對符合NSF和ISO 21469審核標準且文件齊全的H1級潤滑油的需求增加。在歐洲,繼EFSA的MOSH和MOAH評估之後,加工業者越來越傾向於使用不含微量礦物油的合成潤滑油。 ISO 21469認證也代表比基本的NSF註冊更高的保證等級。美國FDA持續加強對21 CFR 178.3570的監管,超過30個州已頒布PFAS禁令,間接影響了潤滑油的化學成分。擁有全球法規合規團隊的供應商正在將這種複雜性轉化為增值諮詢服務,以幫助那些缺乏內部專業知識的客戶。這些協同效應降低了食品潤滑油市場的進入門檻,鞏固了長期契約,並促進了該市場的整體銷售成長。
對需要食品級潤滑劑的加工食品和即食食品的需求正在激增。
消費者的飲食習慣正朝著簡便食品、單份包裝和依賴高吞吐量機械的全通路食品銷售模式轉變。 「食品工業5.0」的概念,例如人工智慧驅動的預測性維護,正在縮小可接受的停機時間範圍。因此,潤滑油必須具備更長的更換週期和更強的抗污染能力才能被市場接受。隨著產品SKU數量的增加,換型頻率也隨之提高,這就要求潤滑油能夠承受不斷變化的負載和溫度。簡便食品的成長和工廠自動化之間的這種協同作用,不僅推動了對潤滑油需求的成長,也提高了整個食品潤滑油市場對其性能的期望。
與傳統工業油相比,價格溢價較高
合成H1潤滑油的價格仍比傳統礦物油高出25%,這對利潤微薄的小規模加工商構成了重大障礙。生物基潤滑脂雖然具有生物分解優勢,但其價格溢價較高,而生物基潤滑脂的銷售量僅佔總量的1-5%。在人事費用低廉且設備更換週期長的地區,經營團隊通常會延後潤滑油升級,直到審計要求或大型零售客戶提出要求。隨著本地調配、基礎油產量提高以及競爭加劇,食品級潤滑油市場的整體利潤空間將進一步收窄,預計此價格障礙將逐漸消失。
細分市場分析
預計到2025年,H1級潤滑油將佔食品級潤滑油總銷量的64.70%,並預計以5.52%的複合年成長率持續成長至2031年,鞏固其在食品級潤滑油市場中佔據主導地位和成長最快佔有率的雙重地位。加工商即使對於非接觸式設備也傾向於選擇H1級認證產品,以降低維護和零件故障期間的污染風險。因此,隨著ISO 21469審核標準的日益嚴格(該標準目前對生物和化學危害進行嚴格審查),H1級產品所佔的食品級潤滑油市場規模預計將會擴大。
H2潤滑油曾一度在密封系統中廣受歡迎,但如今由於採購部門優先考慮全面合規性而非理論接觸評估,其市場地位依然處於防禦性的小眾水平。 H3可溶性潤滑油的應用仍然局限於一些特殊領域,例如肉類加工廠的鉤形潤滑,在這些領域,水洗性至關重要。即將實施的PFAS禁令間接增強了H1潤滑油的需求,因為重組合成潤滑油在更寬的動作溫度範圍內具有更高的承載能力,進一步縮小了其與H2潤滑油之間的性能差距。因此,預計在預測期內,潤滑油的分類結構將更加傾向於H1,而認證專業知識將成為食品潤滑油市場競爭的關鍵支柱。
預計2025年,礦物油混合物將維持52.08%的市場佔有率,鞏固其在食品潤滑油市場的主導地位。這一地位得益於成熟的供應鏈、可預測的添加劑反應以及適合大規模生產型烘焙企業和乳製品製造商的成本效益。然而,生物基替代品的採用率遠高於合成潤滑油,其複合年成長率達5.86%,高於整體市場水準。因此,儘管生物基食品潤滑油的市場規模仍然較小,但在企業碳排放目標和零售商選擇「環保」採購方式的壓力推動下,該市場正在快速成長。
儘管合成基礎油價格昂貴,但對於全天候運作的運作工廠而言,其優勢顯而易見,因為停機風險遠高於潤滑油的成本。合成基礎油優異的溫度範圍和耐強清潔劑性能可延長換油週期,從而在許多工廠中將與潤滑油相關的維護工作量減少兩位數。
區域分析
歐洲預計到2025年將佔據38.80%的市場佔有率,這得益於數十年來健全的監管體系、完善的加工基礎設施以及以高品質配方為先的持續改進文化。歐洲食品安全局(EFSA)對MOSH和MOAH的嚴格審查迫使加工商轉向全合成、低芳烴混合物,這推高了價格,並促使消費者儘早採用不含PFAS的產品。
儘管亞太地區規模仍相對較小,但其成長速度最快,年複合成長率達5.74%,這主要得益於工業化、飲食習慣的改變以及更嚴格的監管。中國修訂後的GB 2760-2024標準提高了合規標準,有利於熟悉多層認證的跨國供應商。東協食品出口商正在採用國際標準以進入歐盟和美國市場,從而擴大了H1液體的目標市場。
在北美,成熟且充滿活力的需求依然存在,這得益於FDA對意外接觸的監管以及各州對PFAS的禁令加速了配方改進。墨西哥的加工基地利用北美自由貿易組織(NAFTA)的供應鏈,並需要雙重認證的潤滑劑以滿足跨境審核要求。
儘管南美、中東和非洲仍處於起步階段,但基礎設施投資和超級市場擴張正在加速從通用工業用油向認證產品的轉變。 Univer Solutions與Alxada在巴西的經銷合作凸顯了在假冒偽劣風險較高的地區,建立可靠供應鏈的競爭日益激烈。
其他福利
- Excel格式的市場預測(ME)表
- 3個月的分析師支持
目錄
第1章:引言
- 研究假設和市場定義
- 調查範圍
第2章:調查方法
第3章執行摘要
第4章 市場狀況
- 市場概覽
- 市場促進因素
- 全球食品安全法規日趨嚴格。
- 對需要食品級潤滑劑的加工食品和即食食品的需求正在激增。
- 由於食品飲料工廠自動化程度的快速提高,潤滑油的運作週期要求更加嚴格。
- 發展中地區食品加工基礎建設的擴建
- PFAS化學品的逐步淘汰導致對產品配方修訂的需求增加。
- 市場限制因素
- 與傳統工業油相比,價格溢價較高
- 新興市場用戶意識和培訓不足
- 仿冒品和未經認證的H1產品的氾濫
- 價值鏈分析
- 波特五力模型
第5章 市場規模與成長預測
- 按分類
- H1(意外接觸)
- H2(非接觸式)
- H3(可溶性脂肪)
- 基礎油
- 礦物油
- 合成油
- 生物基油
- 依產品類型
- 潤滑脂
- 油壓
- 齒輪油
- 其他產品類型(壓縮機油、鏈條油等)
- 按最終用戶行業分類
- 飲食
- 化妝品
- 食用油
- 其他終端用戶產業(包裝及物流設備等)
- 按地區
- 亞太地區
- 中國
- 日本
- 印度
- 韓國
- ASEAN
- 其他亞太國家
- 北美洲
- 美國
- 加拿大
- 墨西哥
- 歐洲
- 德國
- 英國
- 法國
- 義大利
- 西班牙
- 俄羅斯
- 北歐國家
- 其他歐洲國家
- 南美洲
- 巴西
- 阿根廷
- 其他南美國家
- 中東和非洲
- 沙烏地阿拉伯
- 南非
- 其他中東和非洲國家
- 亞太地區
第6章 競爭情勢
- 市場集中度
- 策略趨勢
- 市佔率和排名分析
- 公司簡介
- CITGO Petroleum Corporation
- Condat
- Dow
- DuPont
- Exxon Mobil Corporation
- Freudenberg SE
- FUCHS
- Interflon Belgium NV
- Lubrication Engineers
- Lubriplate Lubricants Company.
- Matrix Specialty Lubricants
- Petro - Canada,潤滑油公司
- Renewable Lubricants, Inc.
- Schaeffer Manufacturing Co.
- TotalEnergies
- UMW GRANTT International Sdn Bhd.
第7章 市場機會與未來展望
According to Mordor Intelligence, the food grade lubricants market size was valued at 64.18 Million liters in 2025 and estimated to grow from 67.51 Million liters in 2026 to reach 86.95 Million liters by 2031, at a CAGR of 5.19% during the forecast period (2026-2031).
This report is Segmented by Classification (H1, H2, and H3), Base Oil (Mineral Oil, Synthetic Oil, and Bio-Based Oil), Product Type (Grease, Hydraulic Fluid, Gear Oil, and Other Products), End-User Industry (Food and Beverage, Cosmetics, Edible Oil, and Others), and Geography (Asia-Pacific, North America, Europe, South America, and Middle-East and Africa).
Global Food Grade Lubricants Market Trends and Insights
Increasing Food-Safety Regulations Tightening Globally
Governments are converging toward more rigorous food-contact rules, forcing lubricant suppliers to upgrade formulations or risk delisting. China's updated GB 2760-2024 extends the country's positive list and closes loopholes around processing aids, triggering demand for fully documented H1 fluids that align with NSF and ISO 21469 audits. In Europe, the EFSA evaluation of MOSH and MOAH has led processors to favor synthetic fluids that eliminate mineral-oil traces, while ISO 21469 certification now signals a higher assurance level than basic NSF registration. The U.S. FDA continues to police 21 CFR 178.3570, and more than 30 individual states have enacted PFAS bans that indirectly shape lubricant chemistry. Suppliers with global regulatory teams convert this complexity into value-added consulting for customers who lack in-house expertise. The cumulative effect lifts entry barriers and cements long-term contracts, fueling volume expansion across the food grade lubricants market.
Surge in Demand for Processed and Ready-To-Eat Foods Requiring Food-Grade Lubricants
Dietary patterns are pivoting to convenience meals, single-serve packages, and omnichannel grocery models that rely on high-throughput machinery. Food Industry 5.0 concepts, such as AI-enabled predictive maintenance, shorten acceptable downtime windows; lubricants, therefore, must deliver longer drain intervals and contamination immunity to justify their selection. As product SKU counts rise, changeover frequency increases, pushing lubricants to tolerate variable loads and temperatures. This synergy between convenience food growth and factory automation amplifies lubricant demand volume as well as performance expectations across the food-grade lubricants market.
High Price Premium Vs. Conventional Industrial Oils
Synthetic H1 fluids still carry a 25% surcharge relative to ordinary mineral oils, deterring small processors that operate on razor-thin margins. Bio-based greases, which make up only 1-5% of total volume, face steeper premiums despite biodegradability advantages. In regions with lower labor costs and longer equipment replacement cycles, management often delays lubricant upgrades until compelled by audits or large retail clients. The price hurdle is expected to erode gradually as local blending, higher base-oil yields, and competition compress margins across the food grade lubricants market.
Other drivers and restraints analyzed in the detailed report include:
- Rapid Automation of Food and Beverage Plants Intensifying Lubricant Duty Cycles
- Phase-Out of PFAS Chemicals Driving Reformulation Demand
- Proliferation of Counterfeit/Non-Certified "H1" Products
For complete list of drivers and restraints, kindly check the Table Of Contents.
Segment Analysis
H1 lubricants captured 64.70% of 2025 volume and are projected to widen their lead at 5.52% CAGR to 2031, cementing a dual role as dominant and fastest-growing segment in the food grade lubricants market share landscape. Processors favor H1 registration even for equipment deemed non-contact to offset contamination risk during maintenance or component failure. The food grade lubricants market size attributed to H1 products will therefore advance alongside more demanding ISO 21469 audits that now scrutinize biological as well as chemical hazards.
H2 fluids, once popular for sealed systems, now occupy a defensive niche as procurement teams prioritize universal compliance over theoretical exposure assessments. H3 soluble oils remain confined to specialized areas such as hook lubrication in meat plants where water-washability is paramount. The impending PFAS ban is indirectly reinforcing H1 loyalty because reformulated synthetics offer strong load capacity at wider operating temperatures, further eroding any perceived performance gap with H2 grades. As a result the classification mix is expected to tilt more heavily toward H1 throughout the forecast horizon, making certification expertise an indispensable pillar of competition within the food grade lubricants market.
Mineral oil blends retained 52.08% share in 2025, securing their role as the volume anchor of the food grade lubricants market. The position rests on well-established supply chains, predictable additive response, and unit costs that suit high-volume bakeries and dairies. Even so, adoption of bio-based alternatives is running ahead of synthetics in percentage terms, clocking a 5.86% CAGR that outpaces the broader market. The food grade lubricants market size linked to bio-based products therefore remains small but is scaling quickly, propelled by corporate carbon targets and retailer pressure for "planet-friendly" sourcing.
Synthetic base stocks, though premium priced, attract processors running 24/7 automation where downtime risks dwarf fluid costs. Superior thermal range and resistance to aggressive cleaners extend drain intervals, slicing total lubricant-related maintenance tasks by double-digit margins in many plants.
Complete Report Scope:
- By Classification
- H1 (Incidental contact)
- H2 (No contact)
- H3 (Soluble oils)
- By Base Oil
- Mineral Oil
- Synthetic Oil
- Bio-based Oil
- By Product Type
- Grease
- Hydraulic Fluid
- Gear Oil
- Other Products Types (Compressor Oil, Chain Oil, etc.)
- By End-user Industry
- Food and Beverage
- Cosmetics
- Edible Oil
- Other End-user Industries (Packaging and Logistics Equipment, etc.)
- By Geography
- Asia-Pacific
- China
- Japan
- India
- South Korea
- ASEAN Countries
- Rest of Asia-Pacific
- North America
- United States
- Canada
- Mexico
- Europe
- Germany
- United Kingdom
- France
- Italy
- Spain
- Russia
- NORDIC Countries
- Rest of Europe
- South America
- Brazil
- Argentina
- Rest of South America
- Middle-East and Africa
- Saudi Arabia
- South Africa
- Rest of Middle-East and Africa
- Asia-Pacific
Geography Analysis
Europe's 38.80% share in 2025 stems from decades-old regulatory depth, dense processing infrastructure, and continuous improvement cultures that reward premium formulations. EFSA scrutiny of MOSH and MOAH pushes processors toward fully synthetic, low-aromatic blends, driving above-average unit prices and early adoption of PFAS-free options.
Asia-Pacific, though smaller today, registers the fastest pace at 5.74% CAGR, fueled by industrialization, dietary shifts, and tightening standards. China's revised GB 2760-2024 elevates baseline compliance and favors multinational suppliers versed in multilayer certification. ASEAN food exporters are adopting international standards to gain EU and U.S. market access, broadening the addressable base for H1 fluids.
North America commands mature yet still dynamic demand, underpinned by FDA enforcement of incidental-contact rules and state-level PFAS bans that expedite formulation changeovers. Mexico's processor base leverages NAFTA supply chains and requires dual-certified lubricants to satisfy cross-border audits.
South America, and the Middle-East and Africa remain early-stage, yet infrastructure spending and supermarket expansion are catalyzing upgrades from generic industrial oils to certified products. Brazil's distribution partnership between Univar Solutions and Arxada underscores the race to establish credible supply in jurisdictions where counterfeit risk runs high.
- CITGO Petroleum Corporation
- Condat
- Dow
- DuPont
- Exxon Mobil Corporation
- Freudenberg SE
- FUCHS
- Interflon Belgium NV
- Lubrication Engineers
- Lubriplate Lubricants Company.
- Matrix Specialty Lubricants
- Petro-Canada Lubricants Inc.
- Renewable Lubricants, Inc.
- Schaeffer Manufacturing Co.,
- TotalEnergies
- UMW GRANTT International Sdn Bhd.
Additional Benefits:
- The market estimate (ME) sheet in Excel format
- 3 months of analyst support
TABLE OF CONTENTS
1 Introduction
- 1.1 Study Assumptions and Market Definition
- 1.2 Scope of the Study
2 Research Methodology
3 Executive Summary
4 Market Landscape
- 4.1 Market Overview
- 4.2 Market Drivers
- 4.2.1 Increasing Food-Safety Regulations Tightening Globally
- 4.2.2 Surge in Demand for Processed and Ready-to-Eat Foods Requiring Food-Grade Lubricants
- 4.2.3 Rapid Automation of Food and Beverage Plants Intensifying Lubricant Duty Cycles
- 4.2.4 Expanding Food Processing Infrastructure in Developing Regions
- 4.2.5 Phase-out of PFAS Chemicals Driving Reformulation Demand
- 4.3 Market Restraints
- 4.3.1 High Price Premium Vs. Conventional Industrial Oils
- 4.3.2 Limited User Awareness and Training in Emerging Economies
- 4.3.3 Proliferation of Counterfeit/Non-Certified H1 Products
- 4.4 Value Chain Analysis
- 4.5 Porter's Five Forces
- 4.5.1 Bargaining Power of Suppliers
- 4.5.2 Bargaining Power of Buyers
- 4.5.3 Threat of New Entrants
- 4.5.4 Threat of Substitutes
- 4.5.5 Competitive Rivalry
5 Market Size and Growth Forecasts (Volume)
- 5.1 By Classification
- 5.1.1 H1 (Incidental contact)
- 5.1.2 H2 (No contact)
- 5.1.3 H3 (Soluble oils)
- 5.2 By Base Oil
- 5.2.1 Mineral Oil
- 5.2.2 Synthetic Oil
- 5.2.3 Bio-based Oil
- 5.3 By Product Type
- 5.3.1 Grease
- 5.3.2 Hydraulic Fluid
- 5.3.3 Gear Oil
- 5.3.4 Other Products Types (Compressor Oil, Chain Oil, etc.)
- 5.4 By End-user Industry
- 5.4.1 Food and Beverage
- 5.4.2 Cosmetics
- 5.4.3 Edible Oil
- 5.4.4 Other End-user Industries (Packaging and Logistics Equipment, etc.)
- 5.5 By Geography
- 5.5.1 Asia-Pacific
- 5.5.1.1 China
- 5.5.1.2 Japan
- 5.5.1.3 India
- 5.5.1.4 South Korea
- 5.5.1.5 ASEAN Countries
- 5.5.1.6 Rest of Asia-Pacific
- 5.5.2 North America
- 5.5.2.1 United States
- 5.5.2.2 Canada
- 5.5.2.3 Mexico
- 5.5.3 Europe
- 5.5.3.1 Germany
- 5.5.3.2 United Kingdom
- 5.5.3.3 France
- 5.5.3.4 Italy
- 5.5.3.5 Spain
- 5.5.3.6 Russia
- 5.5.3.7 NORDIC Countries
- 5.5.3.8 Rest of Europe
- 5.5.4 South America
- 5.5.4.1 Brazil
- 5.5.4.2 Argentina
- 5.5.4.3 Rest of South America
- 5.5.5 Middle-East and Africa
- 5.5.5.1 Saudi Arabia
- 5.5.5.2 South Africa
- 5.5.5.3 Rest of Middle-East and Africa
- 5.5.1 Asia-Pacific
6 Competitive Landscape
- 6.1 Market Concentration
- 6.2 Strategic Moves
- 6.3 Market Share(%)/Ranking Analysis
- 6.4 Company Profiles (includes Global level Overview, Market level overview, Core Segments, Financials as available, Strategic Information, Market Rank/Share for key companies, Products and Services, Recent Developments)
- 6.4.1 CITGO Petroleum Corporation
- 6.4.2 Condat
- 6.4.3 Dow
- 6.4.4 DuPont
- 6.4.5 Exxon Mobil Corporation
- 6.4.6 Freudenberg SE
- 6.4.7 FUCHS
- 6.4.8 Interflon Belgium NV
- 6.4.9 Lubrication Engineers
- 6.4.10 Lubriplate Lubricants Company.
- 6.4.11 Matrix Specialty Lubricants
- 6.4.12 Petro-Canada Lubricants Inc.
- 6.4.13 Renewable Lubricants, Inc.
- 6.4.14 Schaeffer Manufacturing Co.,
- 6.4.15 TotalEnergies
- 6.4.16 UMW GRANTT International Sdn Bhd.
7 Market Opportunities and Future Outlook
- 7.1 White-space and Unmet-need Assessment


