


 |
市場調查報告書
商品編碼
2114910
冰晶石:市場佔有率分析、行業趨勢和統計數據、成長預測(2026-2031 年)Cryolite - Market Share Analysis, Industry Trends & Statistics, Growth Forecasts (2026 - 2031) |
||||||

※ 本網頁內容可能與最新版本有所差異。詳細情況請與我們聯繫。
根據 Mordor Intelligence 預測,冰晶石市場規模將從 2025 年的 3.1461 億美元成長到 2026 年的 3.276 億美元,然後在 2031 年達到 4.0108 億美元,2026 年至 2031 年的複合年成長率為 4.13%。
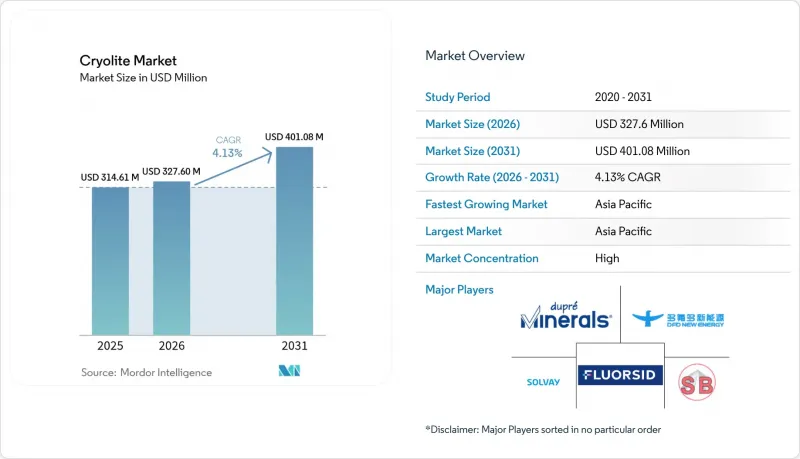
本報告按等級(天然、合成、再生)、形態(粉末、顆粒)、應用(鋁提煉、磨料製造、金屬表面處理、搪瓷和玻璃熔塊、焊劑及其他應用)和地區(亞太、北美、歐洲、南美、中東和非洲)進行細分。市場預測以美元計價。
全球冰晶石市場趨勢與洞察
原生鋁產量增加
電動車和可再生能源設備對鋁的強勁需求正推動冶煉廠產能穩定擴張,並提振冰晶石的基準需求。國際鋁業協會(IAI)預測,全球冰晶石消費量將從2020年的8,620萬噸增加到2030年的1.195億噸。在中國,儘管面臨能源供應限制,預計2023年冰晶石產量仍將達到4,159萬噸,將進一步增強該地區對冰晶石的需求。隨著冶煉廠透過使用可再生能源來減少碳排放,在惰性陽極材料實用化維修之前,冰晶石仍將是一種經濟高效的電解液。一家顧問公司的研究表明,到2030年,鋁供不應求,這將刺激價值600億至900億美元的新電解槽建設,並相應地增加對熔池容量的需求。因此,預計中期內需求將有所改善,但這種勢頭可能會受到長期技術替代風險的一定程度的抑制。
黏結和塗層磨料產業的擴張
工業4.0時代機械加工技術的進步正迫使製造商採用發熱量更低、使用壽命更長的高精度研磨。冰晶石可作為酚醛樹脂磨料的性能增強劑,提高切削效率和耐磨性。這一點已在以往的專利中得到證實,並得到了美國地質調查局(USGS)近期製造業統計數據的支持。航太和汽車OEM廠商目前對錶面光潔度公差的要求越來越嚴格,這推動了對利潤率更高的優質研磨的需求。北美和西歐等地區的生產回流正在將需求從亞洲中心轉移,從而提高了供應鏈的穩定性。從長遠來看,即使每個砂輪的冰晶石用量仍然很小,隨著自動化研磨單元加工能力的提高和砂輪更換頻率的增加,對冰晶石的需求仍將持續穩定成長。
氟化物的職業和環境毒性
監管機構正在收緊氟化物化合物的暴露限值。儘管美國環保署 (EPA) 的重新註冊決定降低了殘留閾值,但歐盟的 REACH 法規要求進行全面的風險評估。遵守法規需要對廢氣淨化、工人監測和污水處理進行投資,這導致小規模生產商的成本增加。雖然與老舊工廠相比,現代冶煉廠的職業健康審計已取得顯著進展,但公眾的認知仍然迫使最終用戶考慮含氟量更低或不含氟的替代品。日益嚴格的審查可能會導致新生產線的許可證核准延遲,並增加文件負擔,尤其是在已開發市場。因此,成長潛力正轉向那些擁有完善的環境管理系統和透明報告結構的供應商。
細分市場分析
2025年,合成材料將主導冰晶石市場,佔比高達77.68%。這反映了格陵蘭伊維古特礦的關閉以及全面轉向以螢石為原料的生產。預計到2025年,合成級冰晶石市場規模將達到2.444億美元,並將繼續保持中等個位數的穩定成長,因為鋁冶煉廠優先考慮化學成分可預測的產品。天然級冰晶石市場正以5.39%的複合年成長率穩定成長,為高品位熔塊、磨料和研究等對微量金屬容差要求嚴格的細分市場提供產品。從廢棄電解槽襯裡回收的再生級冰晶石市場規模仍然較小,但由於廢棄物管理法規鼓勵循環利用,已在較低基數的基礎上實現了兩位數的成長。
合成級冰晶石生產商受益於成熟的間歇式反應器網路和一體化的螢石供應契約,從而確保價格穩定,並與主要鋁生產商建立穩定的供應關係。天然級冰晶石供應商則利用其稀缺性,在特種玻璃和磨料等領域獲得溢價,因為這些領域對雜質含量的增加是不可接受的。再生級冰晶石的創新,得益於膜分離和奈米過濾技術的進步,能夠從廢棄物中回收87-90%的有用冰晶石,從而降低處置成本和碳足跡。隨著這些技術的成熟,回收量可望抵消相當一部分新產量,從而在未來十年內緩解投入成本的波動。
區域分析
亞太地區受中國龐大冶煉基地的驅動,並受惠於印度產能的提升,預計2025年將以43.12%的市佔率引領冰晶石市場。隨著印度納文氟業公司(Navin Fluorine)投資140億印度盧比建設上游氫氟酸工廠以降低原料供應風險,該地區的需求將進一步成長。日本和韓國對精密磨料和電子級玻璃的需求將保持穩定,而東南亞國協對鋁材軋延和鑄造的投資也將支撐需求的逐步成長。在政府對電動車供應鏈和可再生能源電網的獎勵策略的推動下,該地區預計5.18%的複合年成長率仍位居全球最高之列。
北美市場日趨成熟,但同時也是一個創新至關重要的地區。 2024年第四季度,美國進口了3,850噸冰晶石,其中大部分來自墨西哥的螢石礦,佔酸級冰晶石進口總量的74%。 Chemoars和Energy Fuels等公司的策略合作旨在重組國內氟價值鏈,並降低地緣政治風險。加拿大的水力冶煉廠正在推動脫碳進程,力拓集團位於Alvida綜合設施的ELYSIS先導計畫預計將於2027年開始首次商業化生產。從長遠來看,這些項目可能會將需求趨勢轉向高純度、在某些情況下甚至是小批量生產的電解系統。
在歐洲,重點在於合規性和資源效率。索爾維公司2024年46.86億歐元的銷售額清晰地展現了該地區化學工業的實力,該行業正在建立強大的市場地位,但仍然保持著高度的競爭力。歐盟的REACH法規鼓勵實施閉合迴路回收方案,為麻省理工學院(MIT)設計的奈米過濾裝置的引入奠定了基礎。該裝置能夠以99.1%的效率從廢電解中分離並回收鋁。德國、法國和斯堪地那維亞國家對用於航太計畫和包裝鋁材的高純度冰晶石的需求量很大。雖然長期消費成長較為緩慢,但隨著特種應用在產品組合中佔據越來越重要的地位,每噸價值不斷提高。此外,碳邊境調節(CBA)機制對高隱含排放量的進口產品進行懲罰。
其他好處:
- Excel格式的市場預測(ME)表
- 3個月的分析師支持
目錄
第1章:引言
- 研究假設和市場定義
- 調查範圍
第2章:調查方法
第3章執行摘要
第4章 市場狀況
- 市場概覽
- 市場促進因素
- 原生鋁產量成長
- 粘合劑和塗料推動磨料產業的擴張
- 焊條助焊劑需求增加
- 玻璃和搪瓷熔塊產量增加
- 鈉離子電池正極添加劑的應用
- 市場限制因素
- 職業性及環境性氟化物中毒
- 天然礦石蘊藏量有限,且有供應風險
- 過渡到無氟惰性陽極氧化
- 價值鏈分析
- 波特五力模型
第5章 市場規模與成長預測
- 按年級
- 自然的
- 合成
- 翻新產品(源自舊鍋內襯)
- 按形式
- 粉末
- 顆粒狀
- 透過使用
- 鋁提煉
- 磨料生產
- 金屬表面處理
- 琺瑯和玻璃熔塊
- 焊接劑
- 其他用途(例如作為鈉離子電池的添加劑)
- 按地區
- 亞太地區
- 中國
- 日本
- 印度
- 韓國
- 東南亞國協
- 其他亞太國家
- 北美洲
- 美國
- 加拿大
- 墨西哥
- 歐洲
- 德國
- 英國
- 法國
- 義大利
- 西班牙
- 俄羅斯
- 北歐國家
- 其他歐洲國家
- 南美洲
- 巴西
- 阿根廷
- 其他南美國家
- 中東和非洲
- 沙烏地阿拉伯
- 南非
- 其他中東和非洲國家
- 亞太地區
第6章 競爭情勢
- 市場集中度
- 策略趨勢
- 市佔率和排名分析
- 公司簡介
- DO-FLUORIDE NEW ENERGY TECHNOLOGY CO.LTD
- Dupre Minerals Limited
- Eclipse Metals Ltd.
- Fluorsid
- Harshil Industries
- HENAN JINHE INDUSTRY CO.,LTD
- JINZHOU SATA FUSED FLUXES AND NEW MATERIALS FACTORY
- Navin Fluorine International Limited
- SB Chemicals
- Sanyo Corporation of America
- Skyline Chemical Corporation
- Solvay
第7章 市場機會與未來展望
According to Mordor Intelligence, the cryolite market size is expected to grow from USD 314.61 million in 2025 to USD 327.6 million in 2026 and is forecast to reach USD 401.08 million by 2031 at 4.13% CAGR over 2026-2031.
This report is Segmented by Grade (Natural, Synthetic, Recycled), Form (Powder, Granular), Application (Aluminium Smelting, Abrasive Production, Metal Surface Treatment, Enamel and Glass Frits, Welding Flux, Other Applications), and Geography (Asia-Pacific, North America, Europe, South America, Middle East and Africa). The Market Forecasts are Provided in Terms of Value (USD).
Global Cryolite Market Trends and Insights
Growth in Primary Aluminum Output
Robust aluminum consumption for electric vehicles and renewable-energy hardware underpins steady growth in smelter capacity additions, lifting baseline cryolite demand. The International Aluminium Institute projects global usage climbing from 86.2 million t in 2020 to 119.5 million t by 2030. China's 2023 production hit 41.59 million t despite energy caps, reinforcing the region's pull on cryolite supply. As smelters seek lighter carbon footprints with renewable electricity, cryolite remains a cost-effective electrolyte until inert-anode retrofits become commercial. Consulting studies flag a potential 16 million t aluminum supply gap by 2030, spurring USD 60-90 billion in new cell construction that would require proportional molten-bath volumes. The net effect is a positive mid-term demand signal, tempered only by longer-range technology substitution risk.
Expansion of Bonded and Coated Abrasives Industry
Industry 4.0 machining pushes manufacturers toward high-precision grinding wheels that run cooler and last longer. Cryolite acts as a performance filler in phenolic-resin abrasives, boosting cutting efficiency and wear resistance, as documented in legacy patents and corroborated by recent USGS manufacturing statistics. Aerospace and automotive OEMs now specify tighter surface-finish tolerances, encouraging premium wheel grades that command higher margins. Regional reshoring in North America and Western Europe diversifies demand away from Asian hubs, adding stability to supply chains. Over the long term, automated grinding cells amplify throughput and increase abrasive-wheel change-out frequency, sustaining incremental cryolite volumes even when per-wheel dosage remains small.
Occupational and Environmental Fluoride Toxicity
Regulators are tightening exposure limits for fluoride compounds. The US EPA's reregistration decisions set lower residue thresholds, while EU REACH frameworks demand comprehensive risk assessments. Compliance requires investments in exhaust scrubbing, worker monitoring, and waste-water treatment, adding cost for smaller producers. Occupational-health audits in modern smelters confirm significant progress versus legacy plants, yet public perception still pressures end users to explore lower-fluoride or fluoride-free alternatives. Heightened scrutiny can slow permitting for new production lines and increases documentation burdens, mainly in developed markets. Consequently, growth potential shifts toward suppliers with advanced environmental-management systems and transparent reporting.
Other drivers and restraints analyzed in the detailed report include:
- Rising Demand for Fluxes in Welding Electrodes
- Increasing Glass and Enamel Frits Production
- Shift Toward Fluoride-Free Inert-Anode Smelting
For complete list of drivers and restraints, kindly check the Table Of Contents.
Segment Analysis
Synthetic material dominated with 77.68% cryolite market share in 2025, reflecting the closure of Greenland's Ivigtut mine and the comprehensive shift to fluorspar-based production. The cryolite market size for synthetic grades reached USD 244.4 million in 2025 and is projected to register steady mid-single-digit growth as aluminum smelters favor predictable chemical compositions. Natural grade edges forward at a 5.39% CAGR, serving premium frits, abrasives, and research niches where trace-metal thresholds are exacting. Recycled grade, reclaimed from spent pot-lining, remains small but achieved double-digit growth from a low base because waste-management regulations encourage circular routes.
Synthetic producers benefit from established batch-reactor networks and integrated fluorspar supply contracts, ensuring stable pricing and volume commitments with aluminum majors. Natural suppliers capitalize on scarcity value, commanding price premiums in specialist glass and abrasive segments that cannot tolerate impurity spikes. Recycled-grade innovation leans on membrane separation and nanofiltration advances that recover 87-90% usable cryolite from cell waste, trimming disposal fees while shrinking carbon footprints. As these technologies mature, recycled tonnage could offset a notable share of new production, moderating input-cost volatility over the next decade.
Complete Report Scope:
- By Grade
- Natural
- Synthetic
- Recycled (from spent pot-lining)
- By Form
- Powder
- Granular
- By Application
- Aluminium Smelting
- Abrasive Production
- Metal Surface Treatment
- Enamel and Glass Frits
- Welding Flux
- Other Applications (Sodium Ion Battery Additive, etc.)
- By Geography
- Asia-Pacific
- China
- Japan
- India
- South Korea
- ASEAN Countries
- Rest of Asia-Pacific
- North America
- United States
- Canada
- Mexico
- Europe
- Germany
- United Kingdom
- France
- Italy
- Spain
- Russia
- NORDIC Countries
- Rest of Europe
- South America
- Brazil
- Argentina
- Rest of South America
- Middle East and Africa
- Saudi Arabia
- South Africa
- Rest of Middle East and Africa
- Asia-Pacific
Geography Analysis
Asia-Pacific led the cryolite market with a 43.12% revenue share in 2025, driven by China's mammoth smelting base and reinforced by Indian capacity additions. Regional demand expanded further after India's Navin Fluorine committed INR 14 billion to upstream hydrogen-fluoride plants that de-risk raw-material supply. Japan and South Korea consumed steady tonnage for precision abrasives and electronic-grade glass, while ASEAN investments in aluminum rolling and casting supported incremental gains. The region's forecast 5.18% CAGR remains the highest globally, underpinned by government stimulus for electric-vehicle supply chains and renewable-energy grids.
North America represents a mature but innovation-centric arena. The United States imported 3,850 t of cryolite in Q4 2024, most of it routed from Mexican fluorspar mines that delivered 74% of acid-grade imports. Strategic alliances such as the Chemours-Energy Fuels partnership aim to rebuild domestic fluorine value chains and reduce geopolitical exposure. Canada's hydro-powered smelters advance decarbonization initiatives, most notably Rio Tinto's ELYSIS pilot at the Arvida complex scheduled for first commercial output in 2027. These projects could shift demand profiles toward higher-purity and possibly lower-volume electrolyte systems over the long term.
Europe focuses on regulatory compliance and resource efficiency. Solvay's EUR 4.686 billion sales in 2024 underscore the region's entrenched yet competitive chemical sector. EU REACH mandates incentivize the adoption of closed-loop recovery schemes, setting the stage for MIT-inspired nanofiltration plants that strip aluminum from spent electrolytes at 99.1% efficiency. Germany, France, and the Scandinavian countries demand high-purity cryolite for aerospace programs and packaging-grade aluminum. Long-term consumption growth is modest, yet value per ton climbs as specialty applications climb the product mix and carbon-border-adjustment mechanisms penalize imports with higher embedded emissions.
- DO-FLUORIDE NEW ENERGY TECHNOLOGY CO.LTD
- Dupre Minerals Limited
- Eclipse Metals Ltd.
- Fluorsid
- Harshil Industries
- HENAN JINHE INDUSTRY CO.,LTD
- JINZHOU SATA FUSED FLUXES AND NEW MATERIALS FACTORY
- Navin Fluorine International Limited
- S.B. Chemicals
- Sanyo Corporation of America
- Skyline Chemical Corporation
- Solvay
Additional Benefits:
- The market estimate (ME) sheet in Excel format
- 3 months of analyst support
TABLE OF CONTENTS
1 Introduction
- 1.1 Study Assumptions and Market Definition
- 1.2 Scope of the Study
2 Research Methodology
3 Executive Summary
4 Market Landscape
- 4.1 Market Overview
- 4.2 Market Drivers
- 4.2.1 Growth in primary aluminium output
- 4.2.2 Expansion of bonded and coated abrasives industry
- 4.2.3 Rising demand for fluxes in welding electrodes
- 4.2.4 Increasing glass and enamel frits production
- 4.2.5 Sodium-ion battery cathode additive adoption
- 4.3 Market Restraints
- 4.3.1 Occupational and environmental fluoride toxicity
- 4.3.2 Limited natural ore deposits and supply risk
- 4.3.3 Shift toward fluoride-free inert-anode smelting
- 4.4 Value Chain Analysis
- 4.5 Porter's Five Forces
- 4.5.1 Bargaining Power of Suppliers
- 4.5.2 Bargaining Power of Buyers
- 4.5.3 Threat of New Entrants
- 4.5.4 Threat of Substitute Products
- 4.5.5 Degree of Competition
5 Market Size and Growth Forecasts (Value)
- 5.1 By Grade
- 5.1.1 Natural
- 5.1.2 Synthetic
- 5.1.3 Recycled (from spent pot-lining)
- 5.2 By Form
- 5.2.1 Powder
- 5.2.2 Granular
- 5.3 By Application
- 5.3.1 Aluminium Smelting
- 5.3.2 Abrasive Production
- 5.3.3 Metal Surface Treatment
- 5.3.4 Enamel and Glass Frits
- 5.3.5 Welding Flux
- 5.3.6 Other Applications (Sodium Ion Battery Additive, etc.)
- 5.4 By Geography
- 5.4.1 Asia-Pacific
- 5.4.1.1 China
- 5.4.1.2 Japan
- 5.4.1.3 India
- 5.4.1.4 South Korea
- 5.4.1.5 ASEAN Countries
- 5.4.1.6 Rest of Asia-Pacific
- 5.4.2 North America
- 5.4.2.1 United States
- 5.4.2.2 Canada
- 5.4.2.3 Mexico
- 5.4.3 Europe
- 5.4.3.1 Germany
- 5.4.3.2 United Kingdom
- 5.4.3.3 France
- 5.4.3.4 Italy
- 5.4.3.5 Spain
- 5.4.3.6 Russia
- 5.4.3.7 NORDIC Countries
- 5.4.3.8 Rest of Europe
- 5.4.4 South America
- 5.4.4.1 Brazil
- 5.4.4.2 Argentina
- 5.4.4.3 Rest of South America
- 5.4.5 Middle East and Africa
- 5.4.5.1 Saudi Arabia
- 5.4.5.2 South Africa
- 5.4.5.3 Rest of Middle East and Africa
- 5.4.1 Asia-Pacific
6 Competitive Landscape
- 6.1 Market Concentration
- 6.2 Strategic Moves
- 6.3 Market Share(%)/Ranking Analysis
- 6.4 Company Profiles (includes Global level Overview, Market level overview, Core Segments, Financials as available, Strategic Information, Market Rank/Share for key companies, Products and Services, and Recent Developments)
- 6.4.1 DO-FLUORIDE NEW ENERGY TECHNOLOGY CO.LTD
- 6.4.2 Dupre Minerals Limited
- 6.4.3 Eclipse Metals Ltd.
- 6.4.4 Fluorsid
- 6.4.5 Harshil Industries
- 6.4.6 HENAN JINHE INDUSTRY CO.,LTD
- 6.4.7 JINZHOU SATA FUSED FLUXES AND NEW MATERIALS FACTORY
- 6.4.8 Navin Fluorine International Limited
- 6.4.9 S.B. Chemicals
- 6.4.10 Sanyo Corporation of America
- 6.4.11 Skyline Chemical Corporation
- 6.4.12 Solvay
7 Market Opportunities and Future Outlook
- 7.1 White-space and Unmet-need Assessment

 冰晶石市場規模、佔有率及成長分析(按應用、形態、最終用途及地區分類)-2026-2033年產業預測
 冰晶石市場報告:2031 年趨勢、預測與競爭分析
 全球冰晶石市場規模研究與預測(依應用和區域分類)2025-2035 年