


 |
市場調查報告書
商品編碼
2114908
有線介面:市場佔有率分析、產業趨勢與統計資料、成長預測(2026-2031 年)Wired Interface - Market Share Analysis, Industry Trends & Statistics, Growth Forecasts (2026 - 2031) |
||||||

※ 本網頁內容可能與最新版本有所差異。詳細情況請與我們聯繫。
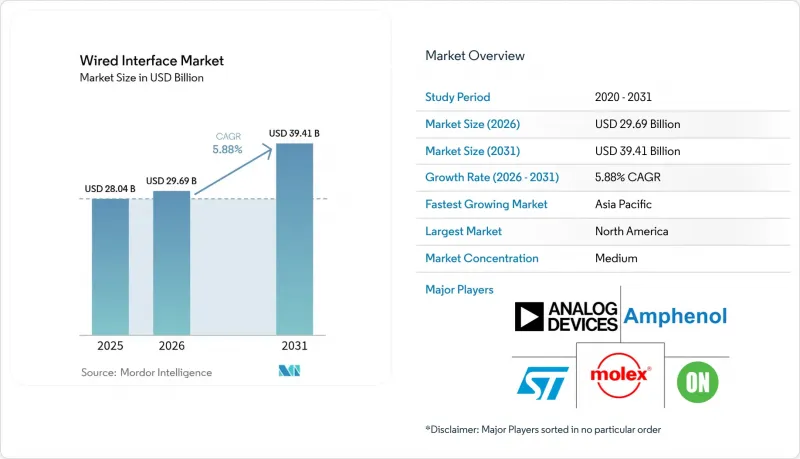
據 Mordor Intelligence 稱,2025 年有線介面市場價值為 280.4 億美元,預計到 2031 年將達到 394.1 億美元,而 2026 年為 296.9 億美元,預測期(2026-2031 年)的複合年成長率為 5.8%。
本報告按組件類型(USB、HDMI、DisplayPort、Thunderbolt、其他)、數據速率等級(低於5 Gbps、5–20 Gbps、20–40 Gbps、其他)、應用領域(智慧型手機和平板電腦、PC和遊戲機、電視和數位電子看板、家用電子電器市場預測以美元(USD)為單位。
全球有線介面市場趨勢及洞察
USB-C/USB4 在各種裝置中的應用日益廣泛
隨著 USB-C 從高階介面演變為標準介面,OEM 廠商正在降低組件成本並簡化庫存管理。歐盟的《通用充電器指令》將於 2024 年 12 月生效,該指令強制要求重新設計行動電話、筆記型電腦甚至電池充電器,這將加速全球範圍內的合規浪潮,因為製造商們都在努力避免增加區域 SKU 的複雜性。強制性標識進一步增強了消費者的信心,並加速了 USB-C 集線器和電源線的普及。控制器供應商已經報告訂單增加,其中 ASMedia 特別指出,與 AMD 桌面平台相關的 USB 4.0 銷售量激增。印度和加州也在製定類似的監管提案,這將產生連鎖反應,推動 USB-C 在消費和工業終端的普及。
8K/16K遊戲和影片頻寬需求激增
高刷新率 8K 遊戲對總吞吐量的要求遠超 HDMI 2.1 的 48 Gbps 限制,迫使顯示器製造商開發吞吐量超過 80 Gbps 的全新物理層。由 VESA 標準化的 DisplayPort 2.x 透過增強VR頭戴裝置和內容創作顯示器的自我調整同步功能解決了這個問題。遊戲產業中基於 AI 的超採樣技術的快速普及,使得 GPU 和麵板之間的資料突發傳輸量翻倍,凸顯了對能夠保證訊號完整性、吞吐量超過 40 Gbps 的優質線材組件的需求。由中國國內支持的 GPMI 規範引入了 192 Gbps 的傳輸能力,這表明區域主權問題如何催生出並行的介面生態系統。
個人電腦和平板電腦出貨量的下降正在降低對傳統連接埠的需求。
主流PC的銷售一直低迷,尤其是在對價格敏感的亞太地區銷售管道,導致VGA和USB 2.0介面的需求下降。儘管IDC數據顯示,2024年出貨量將回升1.3%,但目前市場趨勢正轉向以人工智慧為中心的筆記型電腦,這類筆記型機殼的單機實體介面數量較少。企業正在實施選擇性更新計劃,以配合Windows 11的遷移和人工智慧推理工作負載,這使得傳統介面更加實用且使用壽命更長,僅限於特定應用場景。
細分市場分析
預計到2025年,USB仍將佔據32.40%的銷售額,凸顯其作為消費和企業設備事實上的通用介面的地位。隨著旗艦筆記型電腦引入USB4.0 V2,USB連接器和控制器的有線介面市場預計將進一步擴大。 Thunderbolt雖然市場規模較小,但預計到2031年將以7.05%的複合年成長率成長,因為內容創作者和工作站玩家都青睞其80Gbps的吞吐量和菊鏈連接的柔軟性。 HDMI憑藉其在電視面板領域的強大應用基礎,保持著中等個位數的成長,但追求更高頻寬的發燒友可能會轉向DisplayPort 2.x,因為它具有自我調整同步功能。
標準融合的趨勢顯而易見。英特爾的「楓樹嶺」(Maple Ridge)重定時器整合了USB4和Thunderbolt的隧道功能,而蘋果最新的MacBook Pro則透過合併USB4和「Thunderbolt 4」這兩個品牌名稱,模糊了產品類別的界線。同時,諸如MIPI A-PHY之類的細分標準正在滿足主流PC介面無法滿足的汽車安全要求。對於供應商而言,隨著客戶要求從單一供應商獲得多重通訊協定連接,涵蓋銅纜、光纖和主動電纜產品的廣泛產品組合變得至關重要。
主流筆記型電腦、擴充座和嵌入式主機板仍然採用 5-20 Gbps 的通道,因此預計到 2025 年,此類產品將佔據 39.05% 的市場佔有率。然而,人工智慧伺服器、邊緣加速器和 8K 廣播攝影機正朝著 40 Gbps 及以上速度發展,使其成為成長最快的細分市場,複合年成長率 (CAGR) 為 7.62%。 PCIe Gen5 交換器和乙太網路 800G 可插拔產品的日益普及,推動了對額定頻率高於 42 GHz 的低損耗線纜組件的需求。
這一轉變是由材料科學的創新所驅動的。 TOPPAN 展示的無芯有機中介層可最大限度地減少寄生短截線和過孔污染,從而在 112 Gbps PAM4 SerDes 中實現更短的走線長度和更純淨的訊號。 Ayar Labs 的光電共封裝模組可提供 16 Tbps 的雙向頻寬,預示著未來將出現超越當前銅線技術極限的新一代產品。在光技術成熟之前,有源銅線和雙軸電纜解決方案將繼續滿足超大規模營運商在成本和功耗目標之間尋求平衡的需求。
區域分析
預計北美地區將佔2025年銷售額的35.15%,這主要得益於超大規模資料中心的升級以及消費級桌上型電腦中GPU搭載率的創紀錄成長。美國企業在關稅政策調整前加快了向Windows 11的過渡,推動2025年第一季個人電腦出貨量達到1,600萬台。半導體供應商也反映了這一需求,德克薩斯(TI)報告稱,2025年第一季銷售額為40.7億美元,模擬介面IC銷量成長13%。加拿大光纖到戶(FTTP)的部署以及墨西哥OEM組裝叢集的建立,正在穩定該地區的連接器需求。總部位於加州、華盛頓州和德克薩斯州的遊戲周邊設備品牌主導,推出適用於8K和VR應用的優質USB-C轉DisplayPort線纜,從而提升了每個連接埠的價值。
歐洲有線介面市場受政策驅動。歐洲強制採用 USB-C 介面,推動了智慧型手機、筆記型電腦和獨立充電器等產品因合規性要求而主導的更新換代。德國持續推動其「工業 4.0」維修,對高可靠性介面的需求日益成長;法國和荷蘭則投資建造電動車充電走廊,這些走廊依賴於屏蔽式大電流耦合器。汽車產業向網域控制器的轉型,推動了 MIPI A-PHY 和 800Mbps 乙太網路連結的普及,從而催生了對電磁相容性 (EMC) 最佳化型連接器的需求。永續發展框架也促使人們對採用模組化外殼和可回收合金的循環經濟相容型連接器產生濃厚興趣。
亞太地區預計將以6.78%的複合年成長率成長,受益於PCB、線纜和晶片組生產的垂直整合。中國國內的GPMI舉措在主要顯示器製造商的支持下,正在引入192Gbps介面,這可能導致全球標準兩極分化。同時,日本OEM廠商正在推動Chromebook在教育和現場服務領域的應用,預計2025年第一季出貨量將成長15.6%。印度的生產連結獎勵計畫計畫正促使連接器壓接和線纜組裝線向內陸轉移,從而縮短全球筆記型電腦品牌的物流前置作業時間。韓國的記憶體工廠和代工廠正在加快國產控制器的設計,加劇了本地供應競爭。同時,澳洲的礦業自動化計畫需要能夠在惡劣環境下使用的銅芯混合線纜。
其他好處:
- Excel格式的市場預測(ME)表
- 3個月的分析師支持
目錄
第1章:引言
- 研究假設和市場定義
- 調查範圍
第2章:調查方法
第3章執行摘要
第4章 市場狀況
- 市場概覽
- 市場促進因素
- USB-C/USB4 在各種裝置中廣泛應用
- 8K/16K 遊戲和影片的頻寬需求激增。
- 汽車集中式資訊娛樂和ADAS資料鏈路
- 歐盟關於充電器的法規正在加速 USB-C 的普及。
- 中國的GPMI標準正在促進區域更新。
- 有源長距離電纜技術可應用於醫療和工業領域。
- 市場限制因素
- 個人電腦和平板電腦出貨量的下降導致傳統連接埠的處理量下降。
- 對無線顯示器和充電的需求
- 此生態系對 DP 2.1 和 HDMI 2.2 的支援還不夠完善。
- 規範激增帶來的互通性風險
- 價值鏈分析
- 監理情勢
- 技術展望
- 波特五力分析
- 評估宏觀經濟趨勢對市場的影響
第5章 市場規模與成長預測
- 依組件類型
- USB
- HDMI
- DisplayPort
- Thunderbolt
- 其他
- 按數據速率等級
- 小於 5 Gbps
- 5~20 Gbps
- 20~40 Gbps
- 40 Gbps 或更高
- 透過使用
- 智慧型手機和平板電腦
- 個人電腦和遊戲機
- 電視數位電子看板
- VR/AR 和穿戴式裝置
- 其他用途
- 按最終用戶行業分類
- 家用電子產品
- 車
- 產業
- 衛生保健
- 資訊科技/通訊
- 其他終端用戶產業
- 按地區
- 北美洲
- 美國
- 加拿大
- 墨西哥
- 歐洲
- 德國
- 英國
- 法國
- 義大利
- 西班牙
- 其他歐洲國家
- 亞太地區
- 中國
- 日本
- 印度
- 韓國
- 澳洲
- 其他亞太國家
- 南美洲
- 巴西
- 阿根廷
- 其他南美國家
- 中東和非洲
- 中東
- 沙烏地阿拉伯
- 阿拉伯聯合大公國
- 土耳其
- 其他中東國家
- 非洲
- 南非
- 埃及
- 奈及利亞
- 其他非洲國家
- 中東
- 北美洲
第6章 競爭情勢
- 市場集中度
- 策略趨勢
- 市佔率分析
- 公司簡介
- TE Connectivity
- Molex
- Amphenol
- Japan Aviation Electronics
- Luxshare Precision
- Foxconn Interconnect Technology
- Texas Instruments
- STMicroelectronics
- ON Semiconductor
- Analog Devices
- Microchip Technology
- Infineon Technologies
- NXP Semiconductors
- Renesas Electronics
- ASMedia Technology
- Parade Technologies
- Analogix Semiconductor
- Lattice Semiconductor
- ROHM
- Samtec
- Hirose Electric
第7章 市場機會與未來展望
According to Mordor Intelligence, the wired interface market size was valued at USD 28.04 billion in 2025 and estimated to grow from USD 29.69 billion in 2026 to reach USD 39.41 billion by 2031, at a CAGR of 5.88% during the forecast period (2026-2031).
This report is Segmented by Component Type (USB, HDMI, Displayport, Thunderbolt, and Others), Data-Rate Class (Below 5 Gbps, 5-20 Gbps, 20-40 Gbps, and More), Application (Smartphones and Tablets, Pcs and Gaming Consoles, Tvs and Digital Signage, and More), End-User Industry (Consumer Electronics, Automotive, Industrial, and More), and Geography. The Market Forecasts are Provided in Terms of Value (USD).
Global Wired Interface Market Trends and Insights
Growing adoption of USB-C / USB4 across devices
USB-C's evolution from premium connector to default port is compressing bill-of-materials costs and streamlining inventory for OEMs. The European Union's common-charger directive, effective December 2024, forces handset, laptop, and even battery-charger redesigns, catalyzing a global compliance ripple as manufacturers avoid regional SKU complexity. Mandatory logo labeling further promotes consumer confidence, accelerating attach rates for USB-C hubs and power-delivery cables. Controller suppliers already note order upticks; ASMedia highlighted a USB 4.0 revenue surge linked to AMD desktop platforms. With India and California drafting aligned regulations, the regulatory domino effect supports USB-C ubiquity across consumer and industrial endpoints.
Surge in 8K / 16K gaming and video bandwidth needs
High-refresh 8K gaming demands aggregate throughputs far exceeding HDMI 2.1's 48 Gbps ceiling, pushing display makers toward emergent >80 Gbps physical layers. DisplayPort 2.x, standardized by VESA, responds with adaptive-sync enhancements for VR headsets and content-creation monitors. The gaming sector's aggressive AI-based supersampling multiplies data bursts between GPUs and panels, validating premium cable assemblies that guarantee signal integrity above 40 Gbps. China's locally backed GPMI specification introduces 192 Gbps capability, illustrating how regional sovereignty agendas can spawn parallel interface ecosystems.
Shrinking PC and tablet shipments cut legacy-port volumes
Mainstream PC volume softness, especially in cost-sensitive Asia-Pacific channels, is eroding demand for VGA and USB 2.0 connectors. IDC recorded a 1.3% unit rebound in 2024, but the mix now tilts to AI-centric laptops with fewer physical ports per chassis. Enterprises engage in selective refresh cycles aligned with Windows 11 migration and AI inference workloads, prolonging legacy port relevance only for specific use cases.
Other drivers and restraints analyzed in the detailed report include:
- Automotive centralized infotainment and ADAS data links
- EU charger mandate accelerates USB-C deployments
- Preference for wireless display / charging
For complete list of drivers and restraints, kindly check the Table Of Contents.
Segment Analysis
USB maintained 32.40% of 2025 revenue, underlining its role as the de facto general-purpose link across consumer and enterprise gear. The wired interface market size for USB connectors and controllers is slated to rise alongside USB4 V2 rollouts in flagship laptops. Thunderbolt, though representing a smaller base, is forecast at a 7.05% CAGR through 2031 as content creators and workstation gamers adopt its 80 Gbps throughput and daisy-chain flexibility. HDMI's strong installed base in television panels preserves mid-single-digit growth, yet high-bandwidth enthusiasts may pivot to DisplayPort 2.x for adaptive-sync performance.
Convergence trends are evident. Intel's Maple Ridge re-timers integrate both USB4 and Thunderbolt tunnelling, while Apple's latest MacBook Pro combines USB4 with "Thunderbolt 4" branding, blurring category boundaries. In parallel, niche standards such as MIPI A-PHY address automotive safety requirements that mainstream PC interfaces cannot meet. For suppliers, portfolio breadth across copper, optical, and active-cable products becomes crucial as customers demand a single source for multi-protocol connectivity.
Mainstream notebooks, docks, and embedded motherboards continue to favour 5-20 Gbps lanes, explaining the 39.05% share held by this class in 2025. Nevertheless, AI servers, edge accelerators, and 8K broadcast cameras are migrating above 40 Gbps, the fastest-growing slice at an 7.62% CAGR. Rising adoption of PCIe Gen5 switches and Ethernet 800G pluggables amplifies demand for low-loss cable assemblies rated beyond 42 GHz.
Materials science innovations drive the shift. Coreless organic interposers demonstrated by TOPPAN minimize stubs and via parasitics, enabling shorter trace lengths and cleaner signals for SerDes at 112 Gbps PAM4. Optical-electrical co-packaged modules from Ayar Labs showcase 16 Tbps bidirectional bandwidth, foreshadowing a future class that could eclipse today's copper ceilings. Until optical matures, active copper and twin-ax solutions will bridge the gap for hyperscale operators balancing cost and power targets.
Complete Report Scope:
- By Component Type
- USB
- HDMI
- DisplayPort
- Thunderbolt
- Others
- By Data-Rate Class
- Below 5 Gbps
- 5-20 Gbps
- 20-40 Gbps
- Above 40 Gbps
- By Application
- Smartphones and Tablets
- PCs and Gaming Consoles
- TVs and Digital Signage
- VR/AR and Wearables
- Other Applications
- By End-User Industry
- Consumer Electronics
- Automotive
- Industrial
- Healthcare
- IT and Telecom
- Other End-User Industries
- By Geography
- North America
- United States
- Canada
- Mexico
- Europe
- Germany
- United Kingdom
- France
- Italy
- Spain
- Rest of Europe
- Asia-Pacific
- China
- Japan
- India
- South Korea
- Australia
- Rest of Asia-Pacific
- South America
- Brazil
- Argentina
- Rest of South America
- Middle East and Africa
- Middle East
- Saudi Arabia
- United Arab Emirates
- Turkey
- Rest of Middle East
- Africa
- South Africa
- Egypt
- Nigeria
- Rest of Africa
- Middle East
- North America
Geography Analysis
North America held a 35.15% slice of 2025 revenue, buoyed by hyperscale datacenter refreshes and record GPU attach rates in consumer desktops. United States enterprises accelerated Windows 11 migrations ahead of potential tariff shifts, pushing Q1 2025 PC volumes to 16 million units. Semiconductor vendors mirrored demand; Texas Instruments posted USD 4.07 billion Q1 2025 revenue with analog interface ICs up 13%. Canada's fiber-to-the-premise rollouts and Mexico's OEM assembly clusters stabilize regional connector demand. Gaming peripheral brands headquartered in California, Washington, and Texas champion premium USB-C-to-DisplayPort cables suited for 8K and VR usage, reinforcing value per port metrics.
Europe's wired interface story pivots on policy. The continent's USB-C mandate energizes a compliance-driven refresh cycle spanning smartphones, laptops, and standalone chargers. Germany continues to anchor ruggedized interface demand for Industrie 4.0 retrofits, while France and the Netherlands invest in EV charging corridors that rely on shielded high-current couplers. The automotive belt's shift to domain controllers drives adoption of MIPI A-PHY and Ethernet 800Mbps links, creating volume for EMC-optimized connector variants. Sustainability frameworks catalyze interest in circular-economy rated connectors featuring modular shells and recyclable alloys.
Asia-Pacific, projected at a 6.78% CAGR, benefits from the vertical integration of PCB, cable, and chipset production. China's domestic GPMI initiative, backed by display majors, introduces a 192 Gbps interface that could bifurcate global standards. Simultaneously, Japanese OEMs embrace Chromebook deployment in education and field-service sectors, recording 15.6% shipment growth in Q1 2025. India's production-linked incentive scheme draws connector stamping and cable assembly lines inland, compressing logistics lead times for global notebook brands. South Korea's memory fabs and foundries foster home-grown controller designs, intensifying local supply competition, while Australia's mining automation projects demand harsh-environment copper-fiber hybrids.
- TE Connectivity
- Molex
- Amphenol
- Japan Aviation Electronics
- Luxshare Precision
- Foxconn Interconnect Technology
- Texas Instruments
- STMicroelectronics
- ON Semiconductor
- Analog Devices
- Microchip Technology
- Infineon Technologies
- NXP Semiconductors
- Renesas Electronics
- ASMedia Technology
- Parade Technologies
- Analogix Semiconductor
- Lattice Semiconductor
- ROHM
- Samtec
- Hirose Electric
Additional Benefits:
- The market estimate (ME) sheet in Excel format
- 3 months of analyst support
TABLE OF CONTENTS
1 INTRODUCTION
- 1.1 Study Assumptions and Market Definition
- 1.2 Scope of the Study
2 RESEARCH METHODOLOGY
3 EXECUTIVE SUMMARY
4 MARKET LANDSCAPE
- 4.1 Market Overview
- 4.2 Market Drivers
- 4.2.1 Growing adoption of USB-C / USB4 across devices
- 4.2.2 Surge in 8K/16K gaming and video bandwidth needs
- 4.2.3 Automotive centralized infotainment and ADAS data links
- 4.2.4 EU charger mandate accelerates USB-C deployments
- 4.2.5 China's GPMI standard drives regional refresh
- 4.2.6 Active long-reach cable tech opens medical and industrial use
- 4.3 Market Restraints
- 4.3.1 Shrinking PC and tablet shipments cut legacy-port volumes
- 4.3.2 Preference for wireless display / charging
- 4.3.3 Slow ecosystem readiness for DP 2.1 and HDMI 2.2
- 4.3.4 Interoperability risks from proliferating specs
- 4.4 Value Chain Analysis
- 4.5 Regulatory Landscape
- 4.6 Technological Outlook
- 4.7 Porter's Five Forces Analysis
- 4.7.1 Bargaining Power of Suppliers
- 4.7.2 Bargaining Power of Buyers
- 4.7.3 Threat of New Entrants
- 4.7.4 Threat of Substitutes
- 4.7.5 Intensity of Competitive Rivalry
- 4.8 Assessment of the Impact of Macroeconomic Trends on the Market
5 MARKET SIZE AND GROWTH FORECASTS (VALUE)
- 5.1 By Component Type
- 5.1.1 USB
- 5.1.2 HDMI
- 5.1.3 DisplayPort
- 5.1.4 Thunderbolt
- 5.1.5 Others
- 5.2 By Data-Rate Class
- 5.2.1 Below 5 Gbps
- 5.2.2 5-20 Gbps
- 5.2.3 20-40 Gbps
- 5.2.4 Above 40 Gbps
- 5.3 By Application
- 5.3.1 Smartphones and Tablets
- 5.3.2 PCs and Gaming Consoles
- 5.3.3 TVs and Digital Signage
- 5.3.4 VR/AR and Wearables
- 5.3.5 Other Applications
- 5.4 By End-User Industry
- 5.4.1 Consumer Electronics
- 5.4.2 Automotive
- 5.4.3 Industrial
- 5.4.4 Healthcare
- 5.4.5 IT and Telecom
- 5.4.6 Other End-User Industries
- 5.5 By Geography
- 5.5.1 North America
- 5.5.1.1 United States
- 5.5.1.2 Canada
- 5.5.1.3 Mexico
- 5.5.2 Europe
- 5.5.2.1 Germany
- 5.5.2.2 United Kingdom
- 5.5.2.3 France
- 5.5.2.4 Italy
- 5.5.2.5 Spain
- 5.5.2.6 Rest of Europe
- 5.5.3 Asia-Pacific
- 5.5.3.1 China
- 5.5.3.2 Japan
- 5.5.3.3 India
- 5.5.3.4 South Korea
- 5.5.3.5 Australia
- 5.5.3.6 Rest of Asia-Pacific
- 5.5.4 South America
- 5.5.4.1 Brazil
- 5.5.4.2 Argentina
- 5.5.4.3 Rest of South America
- 5.5.5 Middle East and Africa
- 5.5.5.1 Middle East
- 5.5.5.1.1 Saudi Arabia
- 5.5.5.1.2 United Arab Emirates
- 5.5.5.1.3 Turkey
- 5.5.5.1.4 Rest of Middle East
- 5.5.5.2 Africa
- 5.5.5.2.1 South Africa
- 5.5.5.2.2 Egypt
- 5.5.5.2.3 Nigeria
- 5.5.5.2.4 Rest of Africa
- 5.5.5.1 Middle East
- 5.5.1 North America
6 COMPETITIVE LANDSCAPE
- 6.1 Market Concentration
- 6.2 Strategic Moves
- 6.3 Market Share Analysis
- 6.4 Company Profiles (includes Global level Overview, Market level overview, Core Segments, Financials as available, Strategic Information, Market Rank/Share for key companies, Products and Services, and Recent Developments)
- 6.4.1 TE Connectivity
- 6.4.2 Molex
- 6.4.3 Amphenol
- 6.4.4 Japan Aviation Electronics
- 6.4.5 Luxshare Precision
- 6.4.6 Foxconn Interconnect Technology
- 6.4.7 Texas Instruments
- 6.4.8 STMicroelectronics
- 6.4.9 ON Semiconductor
- 6.4.10 Analog Devices
- 6.4.11 Microchip Technology
- 6.4.12 Infineon Technologies
- 6.4.13 NXP Semiconductors
- 6.4.14 Renesas Electronics
- 6.4.15 ASMedia Technology
- 6.4.16 Parade Technologies
- 6.4.17 Analogix Semiconductor
- 6.4.18 Lattice Semiconductor
- 6.4.19 ROHM
- 6.4.20 Samtec
- 6.4.21 Hirose Electric
7 MARKET OPPORTUNITIES AND FUTURE OUTLOOK
- 7.1 White-space and Unmet-Need Assessment

 有線介面IP市場分析及至2035年預測:類型、產品類型、服務、技術、組件、應用、最終用戶、功能、安裝配置
 AS介面市場-2026-2032年全球市場預測有線介面市場-2026-2032年全球市場預測
 2026年全球有線介面市場報告互容晶片市場按產品類型、面板尺寸、晶片結構、應用、最終用戶和銷售管道分類-2026-2032年全球預測
 有線介面市場規模、佔有率和成長分析(按組件類型、資料速率等級、應用、最終用戶產業和地區分類)-2026-2033年產業預測
 全球有線介面市場規模(按組件、設備、地區和預測)
 有線介面市場報告:2031 年趨勢、預測與競爭分析全球As-Interface市場規模(按行業、組件、應用、地區、範圍和預測)