


 |
市場調查報告書
商品編碼
2114849
淨煤技術:市場佔有率分析、行業趨勢和統計數據、成長預測(2026-2031 年)Clean Coal Technology - Market Share Analysis, Industry Trends & Statistics, Growth Forecasts (2026 - 2031) |
||||||

※ 本網頁內容可能與最新版本有所差異。詳細情況請與我們聯繫。
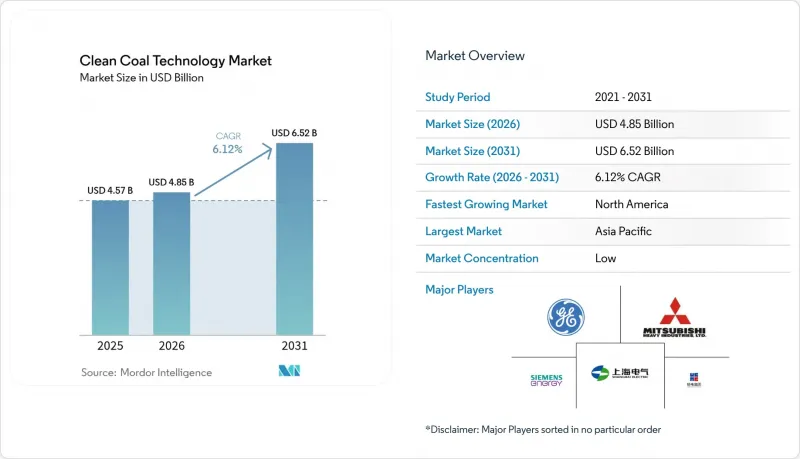
據 Mordor Intelligence 稱,淨煤技術市場預計到 2026 年價值 48.5 億美元,高於 2025 年的 45.7 億美元,預計到 2031 年將達到 65.2 億美元。
預計從 2026 年到 2031 年,其複合年成長率將達到 6.12%。
本報告按技術(亞臨界、超臨界、超超臨界、迴圈流化床、氧氣燃燒等)、組件(設備和服務)、最終用戶產業(電力、鋼鐵、水泥、化學和化肥、區域供熱)和地區(北美、歐洲、亞太、南美、中東和非洲)進行分類。
全球清潔煤技術市場趨勢及洞察
更嚴格的排放法規正在加速高能量低排放電廠的推廣應用。
目前,全球監管機構正強制要求現有燃煤發電廠實現顯著的二氧化碳減排目標,即時需要超臨界和超超臨界維修。美國環保署 (EPA) 2024 年的法規要求,到 2032 年實現 90% 的二氧化碳捕集率,或在 2039 年之前退役,這實際上優先考慮了高效低排放 (HELE) 升級改造而非傳統維修。中國 2024 年 9 月的指令強調採用先進的燃燒和管理技術來控制污染物,同時確保電網可靠性。在歐洲,高效低排放被視為一種過渡性資產類別,旨在將短期電力供應穩定與 2050 年淨零排放目標連結起來。因此,電力公司正在優先投資那些僅靠可再生能源尚無法保證全天候穩定供電的領域,以提高能源效率。因此,無論是在成熟電網還是在發展中電網,高效鍋爐、汽輪機及相關碳捕集、利用與封存 (CCUS) 一體化項目的儲備都在不斷增加。
政府對碳捕獲、利用與封存(CCUS)維修的激勵措施和稅額扣抵。
公部門的資金投入正在重塑捕碳封存(CCUS)的商業性獲利能力。在美國,政府透過45Q計畫提供每噸高達85美元的補貼,能源部已撥款13億美元用於2024年的工廠規模碳捕獲計畫。加拿大承諾在2025年投入2,150萬加元(約1,580萬美元)用於在亞伯達建造一個運輸和儲存中心。歐盟創新基金已撥款2.2億歐元用於水泥產業的碳捕獲舉措,顯示該技術的影響範圍已超越發電產業。隨著內部報酬率(IRR)的提高,私人投資者正在增加對維修專案的資本投入,從而加快商業化進程。這些獎勵共同降低了財務風險,並鼓勵開發商將先導工廠規模擴大到全面商業運作。
快速降低結合太陽能發電和儲能的替代方案的成本。
太陽能和儲能成本的下降正對某些燃煤電廠升級改造計畫的價值提案構成壓力。根據拉札德2024年的平準化能源成本(LCOE)調查,可再生能源的成本優勢正在擴大,但由於基本負載需求,燃煤電廠在電網穩定方面仍具有競爭力。利率上升正在減緩部分可再生能源的部署速度。然而,正如發表在《自然能源》雜誌上的一項同行評審研究表明,在發展中市場,資金籌措成本仍然是技術選擇的決定性因素。用水需求也是一個需要考慮的因素。二氧化碳捕集、利用和儲存(CCUS)技術的整合可能會增加電廠的用水量,這在乾旱地區是一個不利因素。儘管如此,燃煤發電廠仍能提供可調節的電力和高溫製程熱,在可再生能源發展勢頭強勁的情況下,它們的重要性仍然不減。
細分市場分析
由於其效率超過45%且每千瓦時燃料消耗量更低,超臨界系統實現了最快的普及速度,預計到2031年將以17.26%的複合年成長率成長。憑藉成熟的供應鏈和較低的整合風險,超臨界平台保持了其主導地位,在2025年佔據了清潔煤技術市場44.02%的佔有率。迴圈式流體化床(IGCC)和氧燃燒清潔煤技術的市場規模預計將逐步擴大。 GE Vernova的愛德華茲波特IGCC電廠因其運作可行性和穩定的排放性能而脫穎而出。燃燒後維修組件,特別是模組化固體吸附劑和胺系統,能夠加快鍋爐維修工期緊張的電廠的部署速度。
亞臨界技術效率維持在35%左右,市佔率持續下滑。然而,在對建設複雜性要求極高的地區,300兆瓦以下的發電裝置仍然很受歡迎。燃料運輸物流和區域排放法規也影響技術格局,促使許多業者採用迴圈流化床以實現靈活的燃料組合。富氧燃燒和化學鏈燃燒的先導計畫凸顯了其面向未來的潛力,但仍需在成本方面進行更廣泛的改進。整體而言,高溫材料和數位孿生預測模型的創新不斷推動淨煤技術市場的發展,在不影響電網可靠性的前提下,延長電廠壽命並分階段減少排放。
區域分析
預計到2025年,亞太地區將佔全球銷售額的38.85%。這主要得益於中國和印度的大規模現代化改造項目,這些項目在滿足最新能源效率要求的同時,也支持了工業的快速成長。各國政策鼓勵維修而非退役,這使得營運商能夠推動超臨界和超超臨界技術的轉型,並進行初步的二氧化碳捕集、利用與儲存(CCUS)試點計畫。政府在授權和電價調整方面的支持,進一步加速了淨煤技術市場對先進設備的應用。
北美地區是成長最快的地區,預計到2031年複合年成長率將達到8.12%。這主要得益於美國慷慨的45Q稅額扣抵、13億美元的聯邦資金投入,以及加拿大各省對再生能源回收和儲存基礎設施的激勵措施。路易斯安那州耗資45億美元的清潔能源綜合體等示範項目,清楚地展現了在有利的政策框架下,私人資本願意進行聯合投資的規模。這些措施降低了風險溢價,並促進了穩健的工程總承包(EPC)和服務生態系統的形成。
歐洲的前景喜憂參半。雖然一些西歐市場正朝著全面淘汰煤炭的方向發展,但其他國家則在現有設施中選擇性地整合碳捕獲、利用與封存(CCUS)技術,以平衡對供應安全的擔憂。歐盟創新基金向多個計畫撥款2.2億歐元,凸顯了其致力於在水泥、垃圾焚化發電和現有煤炭資產等領域推廣CCUS技術的承諾。由於資金短缺和政策環境的變化,南美洲、中東和非洲市場採取了更謹慎的態度。然而,在碳邊境調節措施加強的背景下,巴西和南非的工業用戶正在考慮將CCUS技術整合到鋼鐵和化學產業。整體而言,區域差異造就了多元化的機遇,供應商必須透過靈活的提案來應對這些機會。
其他好處:
- Excel格式的市場預測(ME)表
- 3個月的分析師支持
目錄
第1章:引言
- 研究假設和市場定義
- 調查範圍
第2章:調查方法
第3章執行摘要
第4章 市場狀況
- 市場概覽
- 市場促進因素
- 更嚴格的排放氣體法規正在加速高能量低排放電廠的推廣應用。
- 政府對碳捕獲、利用與封存(CCUS)維修的獎勵和稅額扣抵。
- 亞洲新興國家基本負載需求的激增,使得燃煤電廠設施的現代化改造勢在必行。
- 超超臨界鍋爐的氫相容維修
- 日本和韓國強制要求合成燃料混燒
- 先進的製程控制軟體,用於提高工廠的熱效率。
- 市場限制因素
- 結合太陽能發電和儲能的替代能源方案的成本正在迅速下降。
- 環境、社會及公司治理(ESG)相關的資金籌措限制對新建煤炭專案的影響
- 全球範圍內,用於AUSC工廠的鎳基合金供不應求。
- 主要產煤區面臨水資源短缺問題
- 供應鏈分析
- 監理情勢
- 技術展望
- 波特五力模型
第5章 市場規模與成長預測
- 透過技術
- 亞臨界
- 超臨界
- 超臨界
- 迴圈流化床(CFB)
- 氣化複迴圈發電(IGCC)
- 氧燃料燃燒
- 維修燃燒後回收
- 按組件
- 裝置
- 鍋爐和熔爐
- 蒸氣渦輪和發電機
- 污染控制系統(煙氣脫硫、選擇性催化還原等)
- 碳捕獲系統
- 控制與儀器
- 服務
- 工程、採購和施工 (EPC)
- 運作和維護(O&M)
- 裝置
- 按最終用戶行業分類
- 電力公司
- 鋼
- 水泥
- 化學品/肥料
- 區域供熱
- 按地區
- 北美洲
- 美國
- 加拿大
- 墨西哥
- 歐洲
- 德國
- 英國
- 法國
- 義大利
- 北歐國家
- 俄羅斯
- 其他歐洲國家
- 亞太地區
- 中國
- 印度
- 日本
- 韓國
- 東南亞國協
- 其他亞太國家
- 南美洲
- 巴西
- 阿根廷
- 其他南美國家
- 中東和非洲
- 沙烏地阿拉伯
- 阿拉伯聯合大公國
- 南非
- 埃及
- 其他中東和非洲國家
- 北美洲
第6章 競爭情勢
- 市場集中度
- 策略趨勢(併購、聯盟、購電協議)
- 市場佔有率分析(主要公司的市場排名和佔有率)
- 公司簡介
- General Electric Company
- Siemens Energy AG
- Mitsubishi Heavy Industries Ltd
- Harbin Electric Co Ltd
- Shanghai Electric Group Co Ltd
- Dongfang Electric Corporation
- Babcock & Wilcox Enterprises Inc
- Alstom SA
- KBR Inc
- Shell PLC
- Doosan Enerbility Co Ltd
- Fluor Corporation
- Exxon Mobil Corporation
- Andritz AG
- Bharat Heavy Electricals Ltd(BHEL)
- Sumitomo SHI FW
- Hitachi Zosen Corporation
- NET Power LLC
- Linde plc
第7章 市場機會與未來展望
According to Mordor Intelligence, clean coal technology market size in 2026 is estimated at USD 4.85 billion, growing from 2025 value of USD 4.57 billion with 2031 projections showing USD 6.52 billion, growing at 6.12% CAGR over 2026-2031.
This report is Segmented by Technology (Subcritical, Supercritical, Ultra-Supercritical, Circulating Fluidized Bed Combustion, Oxy-Fuel Combustion, and More), Component (Equipment and Services), End-User Industry (Power Utilities, Iron and Steel, Cement, Chemicals and Fertilizers, and District Heating), and Geography (North America, Europe, Asia-Pacific, South America, and Middle East and Africa).
Global Clean Coal Technology Market Trends and Insights
Stricter Emission Norms Accelerating Adoption of HELE Plants
Global regulators now require existing coal units to achieve significant CO2 reduction milestones, triggering immediate demand for supercritical and ultra-supercritical retrofits. The U.S. Environmental Protection Agency's 2024 rule requires 90% capture by 2032 or retirement by 2039, effectively prioritizing HELE upgrades over conventional refurbishments. China's September 2024 directive emphasizes advanced combustion and management practices to curb pollutants while maintaining grid reliability. Europe treats HELE as a transitional asset class that bridges near-term security needs and 2050 net-zero targets. Utilities thus favor efficiency-centric investments where renewables alone cannot yet guarantee 24/7 service. The result is a growing project pipeline for high-efficiency boilers, turbines, and associated CCUS integration across mature and developing grids.
Government Incentives & Tax Credits for CCUS Retrofits
Public-sector funding is reshaping the commercial calculus for carbon capture and storage. The United States offers up to USD 85 per ton via 45Q, while the Department of Energy earmarked USD 1.3 billion for plant-scale capture projects in 2024. Canada committed CAD 21.5 million (USD 15.8 million) in 2025 to develop transport and storage hubs in Alberta. The European Union's Innovation Fund allocated EUR 220 million to cement-sector capture initiatives, indicating technology spillovers beyond power generation. With improved internal rates of return, private investors are allocating increasing capital to retrofit programs, thereby accelerating commercialization timelines. These incentives jointly lower financial risk and encourage developers to scale pilot plants into full commercial operations.
Rapid Cost Declines of Solar-Plus-Storage Alternatives
Falling costs in solar photovoltaics and battery storage squeeze the value proposition of certain coal upgrades. Lazard's 2024 LCOE study shows that renewables are widening their cost advantage, although baseload needs keep coal competitive in grid stability roles. Higher interest rates have slowed some renewable energy buildouts; however, financing costs in developing markets remain a pivotal determinant of technology choice, as evidenced by peer-reviewed research in Nature Energy. Water requirements also factor in: CCUS integration can raise plant water consumption, a disadvantage in arid regions. Nonetheless, coal facilities continue to deliver dispatchable power and high-temperature process heat, maintaining their relevance despite the momentum of renewable energy.
Other drivers and restraints analyzed in the detailed report include:
- Surging Baseload Demand in Emerging Asia Requiring Coal Fleet Upgrades
- Hydrogen-Ready Retrofits of USC Boilers
- ESG-Driven Financing Constraints for New Coal Projects
For complete list of drivers and restraints, kindly check the Table Of Contents.
Segment Analysis
Ultra-supercritical systems registered the quickest uptake at an 17.26% CAGR through 2031, benefiting from efficiencies that surpass 45% and cut fuel consumption per kilowatt-hour. Supercritical platforms maintained their leadership position with a 44.02% share of the Clean Coal Technology market in 2025, supported by proven supply chains and lower integration risk. Circulating fluidized bed units remain popular in markets handling variable coal grades, offering intrinsic sulfur capture that eases environmental compliance. The Clean Coal Technology market size for IGCC and oxy-fuel configurations is poised for gradual acceleration as carbon capture mandates ramp up, with GE Vernova's Edwardsport IGCC plant highlighting operational viability and steady emissions performance. Post-combustion retrofit packages, especially modular solid-sorbent and amine systems, offer faster deployment for plants constrained by boiler refurbish windows.
Subcritical technology, constrained by efficiencies of around 35%, continues to cede ground; yet, units under 300 MW still find acceptance in emerging areas that require low-complexity builds. The technology mix is also shaped by fuel transport logistics and local emission norms, prompting many operators to adopt circulating fluidized bed combustion for flexible fuel portfolios. Oxy-fuel and chemical looping pilots underscore future-readiness but await broader cost improvements. Overall, innovation in high-temperature materials and digital-twin predictive models continues to enhance the Clean Coal Technology market, enabling life-extension pathways and incremental emission reductions without compromising grid reliability.
Complete Report Scope:
- By Technology
- Subcritical
- Supercritical
- Ultra-supercritical
- Circulating Fluidized Bed Combustion (CFB)
- Integrated Gasification Combined Cycle (IGCC)
- Oxy-fuel Combustion
- Post-combustion Capture Retrofits
- By Component
- Equipment
- Boilers and Furnaces
- Steam Turbines and Generators
- Pollution-control Systems (FGD, SCR, etc.)
- Carbon-capture Systems
- Control and Instrumentation
- Services
- Engineering, Procurement and Construction (EPC)
- Operations and Maintenance (OandM)
- Equipment
- By End-User Industry
- Power Utilities
- Iron and Steel
- Cement
- Chemicals and Fertilizers
- District Heating
- By Geography
- North America
- United States
- Canada
- Mexico
- Europe
- Germany
- United Kingdom
- France
- Italy
- NORDIC Countries
- Russia
- Rest of Europe
- Asia-Pacific
- China
- India
- Japan
- South Korea
- ASEAN Countries
- Rest of Asia-Pacific
- South America
- Brazil
- Argentina
- Rest of South America
- Middle East and Africa
- Saudi Arabia
- United Arab Emirates
- South Africa
- Egypt
- Rest of Middle East and Africa
- North America
Geography Analysis
The Asia-Pacific region commanded 38.85% of 2025 revenue, thanks to extensive modernization programs in China and India that support rapid industrial growth while aligning with updated efficiency mandates. National policies encourage retrofit over retirement, so operators pursue supercritical and ultra-supercritical conversions alongside first-wave CCUS pilots. Government facilitation in permitting and grid tariff adjustments further accelerates the adoption of advanced equipment within the Clean Coal Technology market.
North America ranks as the fastest-growing region, with an 8.12% projected CAGR through 2031, driven by the United States' generous 45Q credit, USD 1.3 billion in federal funding, and Canadian provincial incentives for capture and storage infrastructure. Demonstration projects such as Louisiana's USD 4.5 billion clean-energy complex illustrate the scale of private capital willing to co-invest under supportive policy frameworks. These measures reduce risk premiums and catalyze a robust EPC and services ecosystem.
Europe presents a mixed outlook: outright coal phase-outs proceed in some Western markets, yet selective CCUS retrofits emerge in nations balancing security-of-supply concerns. The EU Innovation Fund's EUR 220 million disbursement to multiple projects underscores its commitment to capturing technology across cement, waste-to-energy, and legacy coal assets. South American, Middle Eastern, and African markets are adopting a more cautious stance due to capital scarcity and evolving policy environments, although industrial users in Brazil and South Africa are evaluating CCUS for steel and chemicals applications amid tightening carbon-border measures. Overall, regional divergences create a mosaic of opportunity sets that vendors must address via flexible offerings.
- General Electric Company
- Siemens Energy AG
- Mitsubishi Heavy Industries Ltd
- Harbin Electric Co Ltd
- Shanghai Electric Group Co Ltd
- Dongfang Electric Corporation
- Babcock & Wilcox Enterprises Inc
- Alstom SA
- KBR Inc
- Shell PLC
- Doosan Enerbility Co Ltd
- Fluor Corporation
- Exxon Mobil Corporation
- Andritz AG
- Bharat Heavy Electricals Ltd (BHEL)
- Sumitomo SHI FW
- Hitachi Zosen Corporation
- NET Power LLC
- Linde plc
Additional Benefits:
- The market estimate (ME) sheet in Excel format
- 3 months of analyst support
TABLE OF CONTENTS
1 Introduction
- 1.1 Study Assumptions & Market Definition
- 1.2 Scope of the Study
2 Research Methodology
3 Executive Summary
4 Market Landscape
- 4.1 Market Overview
- 4.2 Market Drivers
- 4.2.1 Stricter emission norms accelerating adoption of HELE plants
- 4.2.2 Government incentives & tax credits for CCUS retrofits
- 4.2.3 Surging baseload demand in emerging Asia requiring coal fleet upgrades
- 4.2.4 Hydrogen-ready retrofits of USC boilers
- 4.2.5 Synthetic fuel co-firing mandates in Japan & South Korea
- 4.2.6 Advanced process-control software boosting plant thermal efficiency
- 4.3 Market Restraints
- 4.3.1 Rapid cost declines of solar-plus-storage alternatives
- 4.3.2 ESG-driven financing constraints for new coal projects
- 4.3.3 Global shortage of nickel-based alloys for AUSC plants
- 4.3.4 Water-stress limits in key coal basins
- 4.4 Supply-Chain Analysis
- 4.5 Regulatory Landscape
- 4.6 Technological Outlook
- 4.7 Porter's Five Forces
- 4.7.1 Bargaining Power of Suppliers
- 4.7.2 Bargaining Power of Consumers
- 4.7.3 Threat of New Entrants
- 4.7.4 Threat of Substitutes
- 4.7.5 Intensity of Competitive Rivalry
5 Market Size & Growth Forecasts
- 5.1 By Technology
- 5.1.1 Subcritical
- 5.1.2 Supercritical
- 5.1.3 Ultra-supercritical
- 5.1.4 Circulating Fluidized Bed Combustion (CFB)
- 5.1.5 Integrated Gasification Combined Cycle (IGCC)
- 5.1.6 Oxy-fuel Combustion
- 5.1.7 Post-combustion Capture Retrofits
- 5.2 By Component
- 5.2.1 Equipment
- 5.2.1.1 Boilers and Furnaces
- 5.2.1.2 Steam Turbines and Generators
- 5.2.1.3 Pollution-control Systems (FGD, SCR, etc.)
- 5.2.1.4 Carbon-capture Systems
- 5.2.1.5 Control and Instrumentation
- 5.2.2 Services
- 5.2.2.1 Engineering, Procurement and Construction (EPC)
- 5.2.2.2 Operations and Maintenance (OandM)
- 5.2.1 Equipment
- 5.3 By End-User Industry
- 5.3.1 Power Utilities
- 5.3.2 Iron and Steel
- 5.3.3 Cement
- 5.3.4 Chemicals and Fertilizers
- 5.3.5 District Heating
- 5.4 By Geography
- 5.4.1 North America
- 5.4.1.1 United States
- 5.4.1.2 Canada
- 5.4.1.3 Mexico
- 5.4.2 Europe
- 5.4.2.1 Germany
- 5.4.2.2 United Kingdom
- 5.4.2.3 France
- 5.4.2.4 Italy
- 5.4.2.5 NORDIC Countries
- 5.4.2.6 Russia
- 5.4.2.7 Rest of Europe
- 5.4.3 Asia-Pacific
- 5.4.3.1 China
- 5.4.3.2 India
- 5.4.3.3 Japan
- 5.4.3.4 South Korea
- 5.4.3.5 ASEAN Countries
- 5.4.3.6 Rest of Asia-Pacific
- 5.4.4 South America
- 5.4.4.1 Brazil
- 5.4.4.2 Argentina
- 5.4.4.3 Rest of South America
- 5.4.5 Middle East and Africa
- 5.4.5.1 Saudi Arabia
- 5.4.5.2 United Arab Emirates
- 5.4.5.3 South Africa
- 5.4.5.4 Egypt
- 5.4.5.5 Rest of Middle East and Africa
- 5.4.1 North America
6 Competitive Landscape
- 6.1 Market Concentration
- 6.2 Strategic Moves (M&A, Partnerships, PPAs)
- 6.3 Market Share Analysis (Market Rank/Share for key companies)
- 6.4 Company Profiles (includes Global level Overview, Market level overview, Core Segments, Financials as available, Strategic Information, Products & Services, and Recent Developments)
- 6.4.1 General Electric Company
- 6.4.2 Siemens Energy AG
- 6.4.3 Mitsubishi Heavy Industries Ltd
- 6.4.4 Harbin Electric Co Ltd
- 6.4.5 Shanghai Electric Group Co Ltd
- 6.4.6 Dongfang Electric Corporation
- 6.4.7 Babcock & Wilcox Enterprises Inc
- 6.4.8 Alstom SA
- 6.4.9 KBR Inc
- 6.4.10 Shell PLC
- 6.4.11 Doosan Enerbility Co Ltd
- 6.4.12 Fluor Corporation
- 6.4.13 Exxon Mobil Corporation
- 6.4.14 Andritz AG
- 6.4.15 Bharat Heavy Electricals Ltd (BHEL)
- 6.4.16 Sumitomo SHI FW
- 6.4.17 Hitachi Zosen Corporation
- 6.4.18 NET Power LLC
- 6.4.19 Linde plc
7 Market Opportunities & Future Outlook
- 7.1 White-space & Unmet-need Assessment

 淨煤技術市場-2026-2032年全球市場預測
 淨煤技術市場:按組件、煤種、技術、燃燒方法、終端用戶產業、國家和地區分類-全球產業分析、市場規模、市場佔有率和預測(2026-2033 年)
 淨煤技術市場規模、佔有率和成長分析:按技術類型、應用、煤炭類型、最終用戶和地區分類-2026-2033年產業預測
 全球淨煤技術市場:機會與策略展望(至2035年)煤基合成氣市場:按氣化技術、煤炭類型、壓力、運作模式和應用分類的全球預測(2026-2032年)
 全球煤炭液化市場規模、佔有率、趨勢和成長分析報告(2026-2034年)煤氣化市場規模、佔有率、成長及全球產業分析:依類型、應用和地區劃分的洞察與預測(2026-2034)
 日本煤液化(CTL)市場:規模、佔有率、趨勢和預測:按技術、材料、產品原料、應用和地區分類(2026-2034 年)
 2026-2030年全球煤製油(CTL)市場工業甲烷化技術市場(依反應器類型、催化劑類型、原料類型、操作模式、工廠產能和應用分類)-全球預測,2026-2032年