


 |
市場調查報告書
商品編碼
2114752
光催化劑:市場佔有率分析、產業趨勢與統計、成長預測(2026-2031)Photocatalyst - Market Share Analysis, Industry Trends & Statistics, Growth Forecasts (2026 - 2031) |
||||||

※ 本網頁內容可能與最新版本有所差異。詳細情況請與我們聯繫。
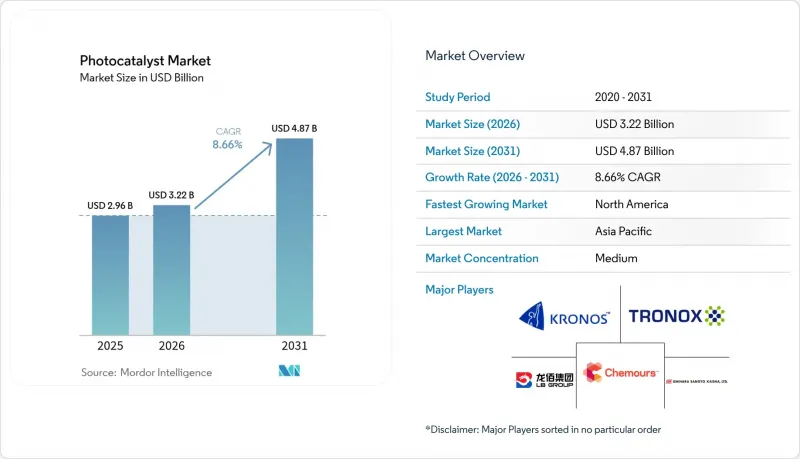
根據 Mordor Intelligence 預測,光催化劑市場規模將從 2025 年的 29.6 億美元成長到 2026 年的 32.2 億美元,到 2031 年將達到 48.7 億美元,2026 年至 2031 年的複合年成長率為 8.66%。
本報告按類型(二氧化鈦、氧化鋅及其他)、應用(自清潔、空氣淨化、水處理、防霧及其他)和地區(亞太、北美、歐洲、南美、中東和非洲)進行細分。報告針對以上所有細分市場,提供了光催化劑市場的規模和預測(價值:百萬美元)。
全球光催化劑市場趨勢及洞察
自清潔建築材料對二氧化鈦(TiO2)光催化劑的需求正在激增。
目前,建築業主正在指定使用奈米紋理二氧化鈦(TiO2)塗層,這種塗層可在建築物的整個使用壽命期間降低高達40%的外觀清潔成本。最新的配方實現了95%的透光率,滿足了引人注目的玻璃建築的美學需求。此外,這種光催化表面在陽光照射下可去除空氣中63%的甲苯,緩解了人們對城市空氣品質的擔憂。由於繩索作業清潔高成本且會阻礙施工,這些塗層正被應用於高層建築專案中。同時,新開發的Bi@Bi4Ti3O12/TiO2薄膜即使在可見光範圍內也有效,從而拓展了遮陽外牆的設計自由度。
在市政供水和污水處理設施中擴大應用
供水事業正利用太陽光進行光催化三級處理,以去除2,4-D、MCPP和麥草畏等農藥,無需外部電源即可達到高達99.8%的分解率。光催化膜反應器因其能夠精確控制出水水質並能應對污染物濃度的突然升高而備受關注。積層製造(AM)複合材料結構可透過客製化表面積和光分佈形狀來降低成本,並使其能夠在沒有電網的偏遠地區安裝。
工業規模的光催化反應器需要大量資金投入。
經濟模型顯示,當反應速率常數低於0.1 min⁻¹時,處理成本會急遽上升,迫使開發商降低催化劑成本,而不是過度設計反應器。紫外線燈陣列、精確的流量控制和防結垢措施會進一步增加資本投入,通常會導致專案成本達到初始預算的3到5倍。模組化裝置和混合光生物反應器正逐漸成為切實可行的解決方案,在能源價格和水質法規相協調的前提下,它們能夠實現長期投資多元化,並在5到15年的可接受時間內收回投資。
細分市場分析
到2025年,憑藉成熟的生產規模和數十年的配方經驗,二氧化鈦(TiO2)將佔據光催化劑市場61.45%的佔有率。同時,三乙醇胺自摻雜Ti3+等技術進步,正在拓展其在可見光波段的應用,並進一步鞏固其性能優勢,即便反傾銷關稅改變了供應鏈的物流。此外,氧化鋅(ZnO)由於其表面反應路徑非常適合製氫,預計將在亞太地區和北美地區實現9.55%的最高複合年成長率,而這些地區對綠色燃料的投資也相當可觀。
然而,發展勢頭正轉向多成分體系。氧化鉍、石墨烯複合材料和金屬有機框架(MOF)衍生的結構展現超過10%的量子產率,其應用目標包括二氧化碳轉化和特種化學品的合成。市場選擇預計將更加重視應用特性而非通用指標,這意味著儘管二氧化鈦仍將在光催化劑市場的整體銷售量中保持領先地位,但它可能會放棄一些高利潤的細分市場。
區域分析
亞太地區在2025年仍將維持66.15%的市佔率。這主要得益於日本在研發領域的領先地位以及中國低成本的二氧化鈦生產,後者支撐了從實驗室到工廠的垂直整合叢集。福島第一核能發電廠事故後提供的研發津貼推動了可見光領域的技術創新,而中國2017年採用硫酸法生產的265萬噸二氧化鈦,即使在環境法規日益嚴格的情況下,也保持了價格競爭力。快速的都市化和季節性霧霾進一步增加了市政對光催化空氣淨化外牆和地鐵站的需求。
北美正以9.62%的複合年成長率(CAGR)以最快的速度擴張,這主要得益於美國環保署(EPA)的揮發性有機化合物(VOC)法規,該法規加速了暖通空調(HVAC)系統的維修以及對車輛燃油蒸氣的控制。地方政府公共產業正在實施被動式太陽能三級處理技術,以滿足微量污染物的排放許可標準;同時,聯邦政府的清潔氫能信用計畫正在加速推進使用氧化鋅(ZnO)進行水電電解的示範計畫。加拿大的綠色建築標準和墨西哥不斷擴大的工業基礎也推動了美國以外地區的生產。
在歐洲,綠色新政的循環經濟條款正在推動相關發展,政府對永續建築和農光互補(農業光伏)試點計畫提供補貼,農光互補將光催化玻璃與透明太陽能板結合。對中國二氧化鈦徵收反傾銷稅,加速了當地顏料生產商向利潤更高的催化劑等級轉型,從而縮短了供應鏈。南美洲、中東和非洲是處於早期階段的市場,在這些地區,現場水處理和太陽能板塗層技術可以顯著超越傳統解決方案,尤其是在偏遠的農業和礦區。
其他好處:
- Excel格式的市場預測(ME)表
- 3個月的分析師支持
目錄
第1章:引言
- 研究假設和市場定義
- 調查範圍
第2章:調查方法
第3章執行摘要
第4章 市場狀況
- 市場概覽
- 市場促進因素
- 自清潔建築材料對二氧化鈦光催化劑的需求正在激增。
- 該技術正在市政供水和污水處理設施中逐步應用。
- 對室內空氣中揮發性有機化合物 (VOC) 的更嚴格監管正在推動對光催化空氣清淨機的需求。
- 可見光等離子體奈米複合材料可用於室內消費性電子產品的塗層。
- 透過對玻璃進行光催化塗層處理,降低生物黏附性,實現農光互補。
- 市場限制因素
- 工業規模光催化反應設備需要大量資金投入。
- 催化劑因表面污染和電子-電洞複合而失活。
- 奈米顆粒釋放和處置方面的監管不確定性
- 價值鏈分析
- 波特五力模型
第5章 市場規模與成長預測
- 按光催化劑類型
- 二氧化鈦
- 氧化鋅
- 其他類型
- 透過使用
- 自清潔
- 空氣淨化
- 水處理
- 防霧
- 其他用途
- 按最終用途行業分類
- 建築和基礎設施
- 汽車和運輸業
- 家用電子電器和家用電器
- 能源與公共產業(太陽能、氫能)
- 其他終端用戶產業(醫療保健和衛生、農業和水產養殖)
- 按地區
- 北美洲
- 美國
- 加拿大
- 墨西哥
- 南美洲
- 巴西
- 阿根廷
- 其他南美國家
- 歐洲
- 德國
- 英國
- 法國
- 義大利
- 其他歐洲國家
- 亞太地區
- 中國
- 印度
- 日本
- 韓國
- 其他亞太國家
- 中東和非洲
- 沙烏地阿拉伯
- 南非
- 其他中東和非洲國家
- 北美洲
第6章 競爭情勢
- 市場集中度
- 策略趨勢
- 市佔率分析
- 公司簡介
- BASF
- Daicel Miraizu Ltd.
- Green Millennium, Inc.
- ISHIHARA SANGYO KAISHA, LTD.
- KRONOS Worldwide Inc.
- LB Group
- Nanoptek Corp.
- NIPPON SODA CO., LTD.
- Resonac Holdings Corporation
- TAYCA Co., Ltd.
- The Chemours Company
- TitanPE Technologies, Inc.
- Tronox Holdings PLC
- Venator Materials PLC
第7章 市場機會與未來展望
According to Mordor Intelligence, the photocatalyst market size is expected to grow from USD 2.96 billion in 2025 to USD 3.22 billion in 2026 and is forecast to reach USD 4.87 billion by 2031 at 8.66% CAGR over 2026-2031.
This report is Segmented by Type (Titanium Dioxide, Zinc Oxide, and Other Types), Application (Self-Cleaning, Air Purification, Water Treatment, Anti-Fogging, and Other Applications), and Geography (Asia-Pacific, North America, Europe, South America, and Middle-East and Africa). The Report Offers Market Size and Forecast for Photocatalyst in Value (USD Million) for all the Above Segments.
Global Photocatalyst Market Trends and Insights
Surging Demand for TiO2 Photocatalysts in Self-Cleaning Construction Materials
Building owners now specify nano-textured TiO2 coatings that cut facade washing expenses by as much as 40% across a building's life. Recent formulations achieve 95% optical transmittance, meeting the aesthetic needs of high-profile glass architecture. Photocatalytic surfaces also remove 63% of airborne toluene under daylight, easing urban air-quality concerns. High-rise projects adopt these coatings because rope-access cleaning is expensive and disruptive, while novel Bi@Bi4Ti3O12/TiO2 films extend the benefit to visible light, broadening design freedom for shaded elevations.
Rising Adoption in Municipal Water & Wastewater Treatment Plants
Utilities turn to solar-driven photocatalytic tertiary treatment to tackle pesticides such as 2,4-D, MCPP and dicamba, achieving up to 99.8% degradation without external power. Photocatalytic membrane reactors gain traction for their precise effluent quality control and resilience to contaminant peaks. Additive-manufactured composite structures push costs down by customizing surface area and light-distribution geometry, making remote installations viable where grid electricity is scarce.
High Capital Expenditure for Industrial-Scale Photocatalytic Reactors
Economic modeling shows treatment costs spike when reaction rate constants fall below 0.1 min-1, pushing developers to cut catalyst price rather than over-engineer reactors. UV-lamp arrays, precision flow control and fouling mitigation further inflate capex, often pushing projects 3-5 times above initial budgets. Modular units and hybrid photo-bioreactors emerge as workable answers, spreading investment over time and keeping payback within acceptable 5-15 year windows where energy prices and water-quality mandates align.
Other drivers and restraints analyzed in the detailed report include:
- Stricter Indoor-Air VOC Regulations Boosting Photocatalytic Air Purifiers
- Visible-Light Plasmonic Nanocomposites Enabling Indoor Consumer-Electronics Coatings
- Catalyst Deactivation from Surface Fouling & Electron-Hole Recombination
For complete list of drivers and restraints, kindly check the Table Of Contents.
Segment Analysis
In 2025, TiO2 held 61.45% of photocatalyst market share owing to mature production scale and decades of formulation know-how. Concurrent advances such as Ti3+ self-doping via triethanolamine routes widen its visible-light window, reinforcing performance leadership even as antidumping duties change supply logistics. ZnO meanwhile posts the fastest 9.55% CAGR because its surface reaction pathway favors hydrogen generation, an area receiving generous green-fuel funding across Asia-Pacific and North America.
Momentum is nonetheless shifting toward multi-component systems. Bismuth-oxides, graphene composites and MOF-derived structures demonstrate quantum yields above 10%, targeting CO2 conversion and specialty chemical synthesis. Market selection is expected to tilt on application specificity more than on universal metrics, suggesting TiO2 might relinquish some high-margin niches even while retaining overall volume leadership in the photocatalyst market.
Complete Report Scope:
- By Photocatalyst Type
- Titanium Dioxide
- Zinc Oxide
- Other Types
- By Application
- Self-Cleaning
- Air Purification
- Water Treatment
- Anti-Fogging
- Other Applications
- By End-Use Industry
- Construction and Infrastructure
- Automotive and Transportation
- Consumer Electronics and Appliances
- Energy and Utilities (Solar, Hydrogen)
- Other End-user Industries (Healthcare and Hygiene, Agriculture and Aquaculture)
- By Geography
- North America
- United States
- Canada
- Mexico
- South America
- Brazil
- Argentina
- Rest of South America
- Europe
- Germany
- United Kingdom
- France
- Italy
- Rest of Europe
- Asia-Pacific
- China
- India
- Japan
- South Korea
- Rest of Asia-Pacific
- Middle East and Africa
- Saudi Arabia
- South Africa
- Rest of Middle East and Africa
- North America
Geography Analysis
Asia-Pacific maintained 66.15% share in 2025 as Japan's research leadership and China's low-cost TiO2 output anchor a vertically integrated cluster from laboratory to factory floor. Post-Fukushima R&D grants propel visible-light innovation, and China's scale-2.65 million tons TiO2 via the sulphate route in 2017-supports price competitiveness even amid tightening environmental rules. Rapid urbanisation and seasonal smog further drive municipal demand for photocatalytic air-scrubbed facades and subway stations.
North America expands fastest at a 9.62% CAGR thanks to EPA VOC limits that accelerate HVAC retrofits and automotive fuel-vapor controls. Municipal utilities implement passive solar tertiary treatment to meet trace-contaminant discharge permits, while federal clean-hydrogen credits stimulate ZnO-based water-splitting demonstrations. Canadian green building codes and Mexico's expanding industrial base add regional volume beyond the United States.
Europe benefits from the Green Deal's circular-economy clauses, channelling subsidies into sustainable construction and agrivoltaic pilots that pair photocatalytic glazing with transparent PV. Antidumping tariffs on Chinese TiO2 galvanise local pigment makers to diversify into higher-margin catalyst grades, thereby shortening supply chains. South America and Middle East & Africa represent early-stage arenas where point-of-use water treatment and solar-panel coatings can leapfrog conventional solutions, especially in remote agriculture and mining camps.
- BASF
- Daicel Miraizu Ltd.
- Green Millennium, Inc.
- ISHIHARA SANGYO KAISHA, LTD.
- KRONOS Worldwide Inc.
- LB Group
- Nanoptek Corp.
- NIPPON SODA CO., LTD.
- Resonac Holdings Corporation
- TAYCA Co., Ltd.
- The Chemours Company
- TitanPE Technologies, Inc.
- Tronox Holdings PLC
- Venator Materials PLC
Additional Benefits:
- The market estimate (ME) sheet in Excel format
- 3 months of analyst support
TABLE OF CONTENTS
1 Introduction
- 1.1 Study Assumptions & Market Definition
- 1.2 Scope of the Study
2 Research Methodology
3 Executive Summary
4 Market Landscape
- 4.1 Market Overview
- 4.2 Market Drivers
- 4.2.1 Surging demand for titanium dioxide photocatalysts in self-cleaning construction materials
- 4.2.2 Rising adoption in municipal water & wastewater treatment plants
- 4.2.3 Stricter indoor-air VOC regulations boosting photocatalytic air purifiers
- 4.2.4 Visible-light plasmonic nanocomposites enabling indoor consumer-electronics coatings
- 4.2.5 Photocatalytic coatings for agrivoltaic glass reducing bio-fouling
- 4.3 Market Restraints
- 4.3.1 High capital expenditure for industrial-scale photocatalytic reactors
- 4.3.2 Catalyst deactivation from surface fouling & electron-hole recombination
- 4.3.3 Regulatory uncertainty on nanoparticle release & disposal
- 4.4 Value Chain Analysis
- 4.5 Porter's Five Forces
- 4.5.1 Threat of New Entrants
- 4.5.2 Bargaining Power of Buyers
- 4.5.3 Bargaining Power of Suppliers
- 4.5.4 Threat of Substitutes
- 4.5.5 Degree of Competition
5 Market Size & Growth Forecasts (Value)
- 5.1 By Photocatalyst Type
- 5.1.1 Titanium Dioxide
- 5.1.2 Zinc Oxide
- 5.1.3 Other Types
- 5.2 By Application
- 5.2.1 Self-Cleaning
- 5.2.2 Air Purification
- 5.2.3 Water Treatment
- 5.2.4 Anti-Fogging
- 5.2.5 Other Applications
- 5.3 By End-Use Industry
- 5.3.1 Construction and Infrastructure
- 5.3.2 Automotive and Transportation
- 5.3.3 Consumer Electronics and Appliances
- 5.3.4 Energy and Utilities (Solar, Hydrogen)
- 5.3.5 Other End-user Industries (Healthcare and Hygiene, Agriculture and Aquaculture)
- 5.4 By Geography
- 5.4.1 North America
- 5.4.1.1 United States
- 5.4.1.2 Canada
- 5.4.1.3 Mexico
- 5.4.2 South America
- 5.4.2.1 Brazil
- 5.4.2.2 Argentina
- 5.4.2.3 Rest of South America
- 5.4.3 Europe
- 5.4.3.1 Germany
- 5.4.3.2 United Kingdom
- 5.4.3.3 France
- 5.4.3.4 Italy
- 5.4.3.5 Rest of Europe
- 5.4.4 Asia-Pacific
- 5.4.4.1 China
- 5.4.4.2 India
- 5.4.4.3 Japan
- 5.4.4.4 South Korea
- 5.4.4.5 Rest of Asia-Pacific
- 5.4.5 Middle East and Africa
- 5.4.5.1 Saudi Arabia
- 5.4.5.2 South Africa
- 5.4.5.3 Rest of Middle East and Africa
- 5.4.1 North America
6 Competitive Landscape
- 6.1 Market Concentration
- 6.2 Strategic Moves
- 6.3 Market Share Analysis
- 6.4 Company Profiles (includes Global level Overview, Market level overview, Core Segments, Financials as available, Strategic Information, Market Rank/Share for key companies, Products & Services, and Recent Developments)
- 6.4.1 BASF
- 6.4.2 Daicel Miraizu Ltd.
- 6.4.3 Green Millennium, Inc.
- 6.4.4 ISHIHARA SANGYO KAISHA, LTD.
- 6.4.5 KRONOS Worldwide Inc.
- 6.4.6 LB Group
- 6.4.7 Nanoptek Corp.
- 6.4.8 NIPPON SODA CO., LTD.
- 6.4.9 Resonac Holdings Corporation
- 6.4.10 TAYCA Co., Ltd.
- 6.4.11 The Chemours Company
- 6.4.12 TitanPE Technologies, Inc.
- 6.4.13 Tronox Holdings PLC
- 6.4.14 Venator Materials PLC
7 Market Opportunities & Future Outlook
- 7.1 White-Space & Unmet-Need Assessment


