


 |
市場調查報告書
商品編碼
2114606
熱成型包裝:市場佔有率分析、產業趨勢與統計、成長預測(2026-2031)Thermoform Packaging - Market Share Analysis, Industry Trends & Statistics, Growth Forecasts (2026 - 2031) |
||||||

※ 本網頁內容可能與最新版本有所差異。詳細情況請與我們聯繫。
據 Mordor Intelligence 稱,熱成型包裝市場預計到 2026 年價值 495.5 億美元,高於 2025 年的 474.1 億美元,預計到 2031 年將達到 617.7 億美元。
預計從 2026 年到 2031 年,其複合年成長率將達到 4.51%。
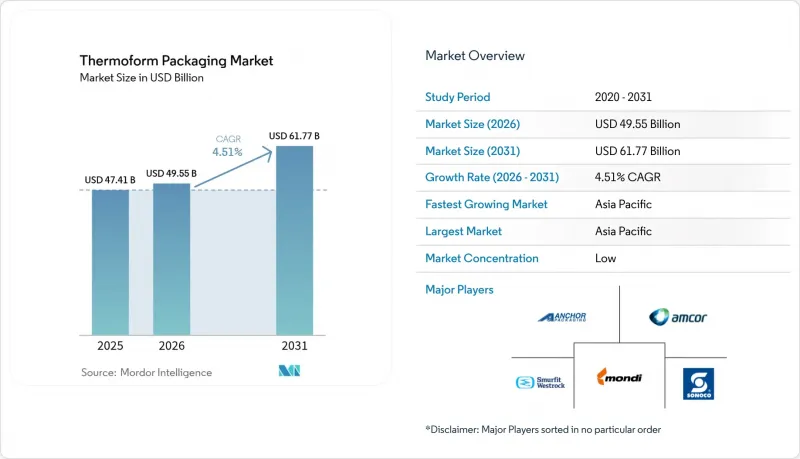
本報告依材料(塑膠、紙/紙板、鋁、生物基聚合物)、產品類型(吸塑包裝、翻蓋包裝、托盤、杯裝)、包裝厚度(200毫米以下、200-500毫米、500毫米以上)、終端用戶行業(食品、醫藥、個人護理、消費電子)、技術(真空成型、加壓成型、機械成型、插入成型)和地區進行細分。市場預測以美元計價。
全球熱成型包裝市場趨勢及洞察
對單一材料可回收托盤的需求激增
由於循環經濟法規的推動,加工商正轉向使用完全由PET或PE製成的托盤結構,這些材料能夠通過生活垃圾分類測試。例如,Graphic Packaging International的Ecoflex™ PET產品系列符合歐盟2030年的可回收性要求,同時保持冷藏食品頂部密封的完整性。歐洲環境調整費用的降低,加上品牌所有者的努力,使得該產品的商業價值得以提升,儘管為了實現多層阻隔功能,需要增加壁厚。埃克森美孚和Alpine聯合展示了一種全PE熱成型產品,該產品即使經過九次回收循環後仍能保持氧氣阻隔性,這凸顯了材料科學的進步。
一家新鮮食材自煮包配送新創公司的發展
HelloFresh及其同業已將每週的餐食配送量擴大到數千萬份,這要求包裝商在多日運輸過程中最佳化保鮮效果、減輕重量並達到碳排放目標。採用阻隔性聚丙烯托盤和可回收薄膜蓋的產品正變得越來越普及,而真空緊縮包裝能防止洩漏並延長保存期限。嵌入蓋子的溫度感測器和QR碼產地標籤正成為新的差異化因素,並推高了產品價格。
歐盟和北美加速徵收塑膠使用稅
2024年,義大利對原生聚合物徵收每公斤0.45歐元的課稅,效法英國的再生材料稅。除非加工商的材料配方中再生材料含量超過30%,否則這項稅收將擠壓其利潤空間。自該稅項實施以來的18個月內,英國註冊公司已繳納超過2億英鎊的稅款,凸顯了這項稅收帶來的巨大經濟影響。
細分市場分析
到2025年,塑膠將佔熱成型包裝銷售額的62.07%,佔據市場最大佔有率。儘管rPET托盤和PP杯在阻隔性能和生產線效率方面仍具有競爭力,但不斷上漲的原生樹脂價格正在提升再生材料的經濟效益。以PLA共混物為代表的生物基聚合物正以8.21%的複合年成長率成長,並受益於歐盟可堆肥標籤等政策誘因。隨著大規模餐飲連鎖企業簽署低碳包裝合約,預計2025年至2030年間,生物基熱成型包裝市場規模將成長三倍。然而,規模化發展仍面臨許多挑戰,包括原料供應穩定性以及超過60 度C的熱變形溫度等問題。
相較之下,熱成型紙板產品在烘焙食品和調理食品蓋等領域找到了利基市場,這些領域可以透過植物來源塗層來增強其耐油性。鋁材因其輕質和高強度重量比仍然用於飛機餐飲,但由於成本波動和回收利用帶來的能源消耗,其市場佔有率正在逐漸下降。 Cascades 公司的 100% rPET 捲邊托盤清楚地展示了傳統聚合物如何發展以滿足對更高再生材料含量的需求。
吸塑包裝憑藉其防篡改特性和精準的單劑量配方,在非處方成藥)。這一銷售量成長與人口老化和日益嚴格的藥品合規法規密切相關。同時,托盤和蓋子的成長最為迅速,複合年成長率達7.6%,這主要得益於食材自煮包公司對預已調整的蛋白質和農產品隔間的標準化需求。受超級市場熟食店從EPS(發泡聚苯乙烯)轉向透明PET(聚對苯二甲酸乙二醇酯)的推動,熱成型托盤包裝市場預計到2026年將超過156億美元。高階糖果甜點製造商青睞壓模成型的雙隔層內襯,因為他們希望在無需二次瓦楞紙箱的情況下提升產品展示效果。
吸塑包裝領域的創新者們正在引入數位浮水印進行真偽驗證,同時對托盤進行可回收設計審核,以降低生產者延伸責任(EPR)成本。可重複密封的卡扣式蓋子提升了消費者的便利性,鼓勵重複使用,並符合品牌減少廢棄物的努力。
區域分析
亞太地區在熱成型包裝市場佔據39.76%的佔有率,這主要得益於中國和印度垂直整合的樹脂生產中心以及不斷成長的可支配收入。政府主導的醫藥產業園區和二線城市電子商務的快速發展,也推動了該地區7.05%的複合年成長率。印度加工商正利用生產者延伸責任制(EPR)的獎勵機制,共同投資興建PET薄片工廠,並提高rPET托盤的產量,以滿足速食店的需求。
北美市場雖然成熟,但對創新仍有很高的需求。美國已有四個州頒布了生產者責任延伸(EPR)法,要求品牌所有者為報廢產品的回收和處理項目提供資金。為此,加工商正在試驗使用無色素PET和數位浮水印技術,以簡化分類流程。美國食品藥物管理局(FDA)提供的先進製造獎勵正在擴大國內泡殼包裝的生產能力,並促進重要藥品包裝回流至美國。
歐洲擁有最嚴格的法規,其2030年可回收性規則和分階段實施的再生材料含量標準正在加速材料的再利用。義大利和西班牙徵收的塑膠課稅使原生聚合物的成本每噸上漲了高達550美元,從而加速了可回收PP和PET混合物的應用。 Faerch公司承諾每年在其食品托盤中摻入10萬噸廢棄PET,這正是獨特的本地循環經濟規模化發展的絕佳例證。
拉丁美洲和中東及非洲的市場規模雖然落後於其他地區,但在都市化和食品零售現代化的推動下,正保持著穩定的中等個位數成長率。當地企業正投資建造rPET片材擠出生產能力,以避免進口關稅並遵守新興的區域廢棄物政策。
其他好處:
- Excel格式的市場預測(ME)表
- 3個月的分析師支持
目錄
第1章:引言
- 研究假設和市場定義
- 調查範圍
第2章:調查方法
第3章執行摘要
第4章 市場狀況
- 市場概覽
- 市場促進因素
- 對單一材料可回收托盤的需求激增
- 食材自煮包宅配新創公司的發展歷程
- 單份速食食品人均消費量增加
- 注射藥物包裝從管瓶過渡到熱成型泡殼包裝。
- 透過自動化降低模具更換成本(符合工業4.0標準的生產線)
- 政府獎勵策略,促進國內藥品包裝
- 市場限制因素
- 歐盟和北美加快對塑膠使用課稅
- 醫用級PP和PET片材的供應時斷時續。
- 高能量強度與模塑紙漿模塑的比較
- 氧敏感SKU阻隔性能的局限性
- 供應鏈分析
- 監理情勢
- 技術展望
- 波特五力分析
第5章 市場規模與成長預測
- 材料
- 塑膠
- 紙張和紙板
- 鋁
- 生物基/可生物分解聚合物
- 依產品類型
- 吸塑包裝
- 蛤殼
- 托盤和蓋子
- 杯子和碗
- 其他
- 按包裝厚度
- 200微米或更小
- 200~500µm
- 500微米或以上
- 按最終用戶行業分類
- 食品/飲料
- 藥品和醫療保健
- 個人護理化妝品
- 家用電子產品
- 其他
- 透過技術
- 真空
- 加壓
- 機器
- 插芯輔助成型
- 按地區
- 北美洲
- 美國
- 加拿大
- 墨西哥
- 歐洲
- 德國
- 英國
- 法國
- 義大利
- 西班牙
- 俄羅斯
- 其他歐洲國家
- 亞太地區
- 中國
- 印度
- 日本
- 韓國
- 澳洲和紐西蘭
- 其他亞太國家
- 中東和非洲
- 中東
- 阿拉伯聯合大公國
- 沙烏地阿拉伯
- 土耳其
- 其他中東國家
- 非洲
- 南非
- 奈及利亞
- 埃及
- 其他非洲國家
- 中東
- 南美洲
- 巴西
- 阿根廷
- 其他南美國家
- 北美洲
第6章 競爭情勢
- 市場集中度
- 策略趨勢
- 市佔率分析
- 公司簡介
- Amcor PLC
- Sonoco Products Company
- International Paper
- Placon Corporation
- Display Pack Inc.
- Smurfit WestRock
- Tekni-Plex Inc.
- Anchor Packaging Inc.
- D&W Fine Pack
- Sealed Air Corporation
- Mondi Group
- Huhtamaki Oyj
- Pactiv Evergreen Inc.
- Fabri-Kal LLC
- Dart Container Corp.
- Sabert Corporation
- Genpak LLC
- Silgan Plastics
- Rompa Group
第7章 市場機會與未來展望
According to Mordor Intelligence, thermoform packaging market size in 2026 is estimated at USD 49.55 billion, growing from 2025 value of USD 47.41 billion with 2031 projections showing USD 61.77 billion, growing at 4.51% CAGR over 2026-2031.
This report is Segmented by Material (Plastic, Paper, Aluminum, Bio-Based Polymers), Product Type (Blisters, Clamshells, Trays, Cups), Packaging Thickness (Up To 200 Mm, 200-500 Mm, Above 500 Mm), End-User Industry (Food, Pharmaceuticals, Personal Care, Electronics), Technology (Vacuum, Pressure, Mechanical, Plug-Assist Forming), and Geography. Market Forecasts in Value (USD).
Global Thermoform Packaging Market Trends and Insights
Surge in demand for mono-material recyclable trays
Circular-economy rules are steering converters toward PET- or PE-only tray structures that pass curbside sortation tests. Graphic Packaging International's Ecoflex(TM) PET line, for instance, meets the EU 2030 recyclability requirement while preserving top-seal integrity for chilled foods. Lower eco-modulated fees in Europe, coupled with brand owner commitments, boost the business case despite thicker walls needed to replicate multilayer barriers. ExxonMobil and Alpine jointly validated all-PE thermoforms that sustain oxygen barriers after nine recycling loops, underscoring material science advances.
Growth of fresh meal-kit delivery startups
HelloFresh and peer platforms have scaled to tens of millions of weekly servings, forcing packagers to optimize freshness over multiday transit, curb mass and hit carbon targets. Barrier-enhanced polypropylene trays paired with recyclable film lidding are proliferating, while vacuum-skin formats suppress drip loss and extend shelf life. Temperature sensors and QR-based provenance tags embedded into lids are emerging differentiators, fostering premium pricing.
Accelerating plastic-use taxation in EU and North America
Italy's levy of EUR 0.45/kg on virgin polymers joined the UK's recycled-content tax in 2024, slicing converter margins unless material mixes exceed 30% recyclate. Registered UK businesses remitted more than GBP 200 million in the first 18 months, highlighting fiscal bite.
Other drivers and restraints analyzed in the detailed report include:
- Per-capita rise in single-serve convenience foods
- Shift from glass vials to thermoform blister packs in injectables
- Sporadic supply of medical-grade PP and PET sheets
For complete list of drivers and restraints, kindly check the Table Of Contents.
Segment Analysis
Plastics delivered 62.07% of 2025 sales, equating to the largest slice of the thermoform packaging market. rPET trays and PP cups stay competitive on barrier metrics and line efficiency, while price spikes in prime resin strengthen recyclate economics. Bio-based polymers, led by PLA blends, chart an 8.21% CAGR and benefit from policy carrots such as EU compostability labeling. The thermoform packaging market size for bio-based grades is projected to triple between 2025 and 2030 as high-volume food service chains lock in low-carbon packaging contracts. Scaling hurdles persist around feedstock supply continuity and heat-distortion thresholds beyond 60 °C.
In contrast, paperboard thermoforms carve niche demand in bakery and ready-meal lids where grease resistance can be engineered with plant-based coatings. Aluminum retains service in airline catering owing to lightweight-to-strength ratios but its share inches downward on cost volatility and recycling energy load. Cascades' 100% rPET rolled-edge tray underlines how incumbent polymers evolve to satisfy rising recycled-content quotas.
Blister packs captured 37.05% of 2025 turnover, leveraging tamper evidence and unit-dose accuracy for OTC medicines and nutraceuticals. Volume growth aligns with ageing demographics and strict drug compliance rules. Trays and lids, however, are the fastest climber at 7.6% CAGR, with meal-kit firms standardizing portioned protein and produce cells. The thermoform packaging market size for trays surpassed USD 15.6 billion in 2026, supported by supermarket delis converting from EPS to clear PET. Pressure-formed dual-compartment inserts appeal to premium confectionery seeking elevated shelf presence without secondary cartons.
Blister innovators embed digital watermarking for authentication, while trays undergo design-for-recycling audits to shave EPR fees. Recloseable clip-on lids boost consumer convenience, encouraging reuse and aligning with brand waste-reduction pledges.
Complete Report Scope:
- By Material
- Plastic
- Paper and Paperboard
- Aluminum
- Bio-based/Biodegradable Polymers
- By Product Type
- Blisters
- Clamshells
- Trays and Lids
- Cups and Bowls
- Other Product Type
- By Packaging Thickness
- Up to 200 µm
- 200-500 µm
- Above 500 µm
- By End-user Industry
- Food and Beverage
- Pharmaceuticals and Medical
- Personal Care and Cosmetics
- Consumer Electronics
- Other End-user Industry
- By Thermoforming Technology
- Vacuum Forming
- Pressure Forming
- Mechanical Forming
- Plug-Assist Forming
- By Geography
- North America
- United States
- Canada
- Mexico
- Europe
- Germany
- United Kingdom
- France
- Italy
- Spain
- Russia
- Rest of Europe
- Asia-Pacific
- China
- India
- Japan
- South Korea
- Australia and New Zealand
- Rest of Asia-Pacific
- Middle East and Africa
- Middle East
- United Arab Emirates
- Saudi Arabia
- Turkey
- Rest of Middle East
- Africa
- South Africa
- Nigeria
- Egypt
- Rest of Africa
- Middle East
- South America
- Brazil
- Argentina
- Rest of South America
- North America
Geography Analysis
Asia-Pacific's 39.76% hold on the thermoform packaging market is fortified by vertically integrated resin hubs in China and India coupled with rising disposable incomes. Government-led pharma parks and e-commerce booms in tier-2 cities sustain a 7.05% regional CAGR. Indian converters leverage Extended Producer Responsibility credits to co-invest in PET flake plants, boosting rPET tray output for quick-service restaurants.
North America presents a mature but innovation-hungry landscape. Four US states have enacted EPR statutes compelling brand owners to bankroll end-of-life programs; converters thus pilot colorant-free PET and digital watermarks to ease sorting. FDA advanced manufacturing incentives accelerate domestic blister capacity, supporting on-shoring of critical drug packaging.
Europe enforces the strictest regime, with the 2030 recyclability rule and graduated recycled-content thresholds pushing rapid material reformulation. Plastic levies in Italy and Spain raise virgin-polymer costs by as much as USD 550/tonne equivalent, hastening adoption of recyclable PP and PET blends. Faerch's pledge to incorporate 100,000 t/yr of post-consumer PET into food trays exemplifies region-specific circularity scale-ups.
Latin America and the Middle East & Africa trail in market size yet post stable mid-single-digit growth on back of urbanization and food retail modernization. Local players invest in rPET sheet extrusion capacity to circumvent import tariffs and adhere to emerging regional waste policies.
- Amcor PLC
- Sonoco Products Company
- International Paper
- Placon Corporation
- Display Pack Inc.
- Smurfit WestRock
- Tekni-Plex Inc.
- Anchor Packaging Inc.
- D&W Fine Pack
- Sealed Air Corporation
- Mondi Group
- Huhtamaki Oyj
- Pactiv Evergreen Inc.
- Fabri-Kal LLC
- Dart Container Corp.
- Sabert Corporation
- Genpak LLC
- Silgan Plastics
- Rompa Group
Additional Benefits:
- The market estimate (ME) sheet in Excel format
- 3 months of analyst support
TABLE OF CONTENTS
1 INTRODUCTION
- 1.1 Study Assumptions and Market Definition
- 1.2 Scope of the Study
2 RESEARCH METHODOLOGY
3 EXECUTIVE SUMMARY
4 MARKET LANDSCAPE
- 4.1 Market Overview
- 4.2 Market Drivers
- 4.2.1 Surge in demand for mono-material recyclable trays
- 4.2.2 Growth of fresh meal-kit delivery startups
- 4.2.3 Per-capita rise in single-serve convenience foods
- 4.2.4 Shift from glass vials to thermoform blister packs in injectables
- 4.2.5 Automation lowering tooling?changeover cost (Industry 4.0 lines)
- 4.2.6 Government stimulus for on-shore pharmaceutical packaging
- 4.3 Market Restraints
- 4.3.1 Accelerating plastic-use taxation in EU and North America
- 4.3.2 Sporadic supply of medical-grade PP and PET sheets
- 4.3.3 High energy intensity vs. molded-fiber forming
- 4.3.4 Limited barrier performance for oxygen-sensitive SKUs
- 4.4 Supply-Chain Analysis
- 4.5 Regulatory Landscape
- 4.6 Technological Outlook
- 4.7 Porter's Five Forces Analysis
- 4.7.1 Threat of New Entrants
- 4.7.2 Bargaining Power of Buyers
- 4.7.3 Bargaining Power of Suppliers
- 4.7.4 Threat of Substitute Products
- 4.7.5 Intensity of Competitive Rivalry
5 MARKET SIZE AND GROWTH FORECASTS (VALUE)
- 5.1 By Material
- 5.1.1 Plastic
- 5.1.2 Paper and Paperboard
- 5.1.3 Aluminum
- 5.1.4 Bio-based/Biodegradable Polymers
- 5.2 By Product Type
- 5.2.1 Blisters
- 5.2.2 Clamshells
- 5.2.3 Trays and Lids
- 5.2.4 Cups and Bowls
- 5.2.5 Other Product Type
- 5.3 By Packaging Thickness
- 5.3.1 Up to 200 µm
- 5.3.2 200-500 µm
- 5.3.3 Above 500 µm
- 5.4 By End-user Industry
- 5.4.1 Food and Beverage
- 5.4.2 Pharmaceuticals and Medical
- 5.4.3 Personal Care and Cosmetics
- 5.4.4 Consumer Electronics
- 5.4.5 Other End-user Industry
- 5.5 By Thermoforming Technology
- 5.5.1 Vacuum Forming
- 5.5.2 Pressure Forming
- 5.5.3 Mechanical Forming
- 5.5.4 Plug-Assist Forming
- 5.6 By Geography
- 5.6.1 North America
- 5.6.1.1 United States
- 5.6.1.2 Canada
- 5.6.1.3 Mexico
- 5.6.2 Europe
- 5.6.2.1 Germany
- 5.6.2.2 United Kingdom
- 5.6.2.3 France
- 5.6.2.4 Italy
- 5.6.2.5 Spain
- 5.6.2.6 Russia
- 5.6.2.7 Rest of Europe
- 5.6.3 Asia-Pacific
- 5.6.3.1 China
- 5.6.3.2 India
- 5.6.3.3 Japan
- 5.6.3.4 South Korea
- 5.6.3.5 Australia and New Zealand
- 5.6.3.6 Rest of Asia-Pacific
- 5.6.4 Middle East and Africa
- 5.6.4.1 Middle East
- 5.6.4.1.1 United Arab Emirates
- 5.6.4.1.2 Saudi Arabia
- 5.6.4.1.3 Turkey
- 5.6.4.1.4 Rest of Middle East
- 5.6.4.2 Africa
- 5.6.4.2.1 South Africa
- 5.6.4.2.2 Nigeria
- 5.6.4.2.3 Egypt
- 5.6.4.2.4 Rest of Africa
- 5.6.4.1 Middle East
- 5.6.5 South America
- 5.6.5.1 Brazil
- 5.6.5.2 Argentina
- 5.6.5.3 Rest of South America
- 5.6.1 North America
6 COMPETITIVE LANDSCAPE
- 6.1 Market Concentration
- 6.2 Strategic Moves
- 6.3 Market Share Analysis
- 6.4 Company Profiles (includes Global level Overview, Market level Overview, Core Segments, Financials as available, Strategic Information, Market Rank/Share for key companies, Products and Services, and Recent Developments)
- 6.4.1 Amcor PLC
- 6.4.2 Sonoco Products Company
- 6.4.3 International Paper
- 6.4.4 Placon Corporation
- 6.4.5 Display Pack Inc.
- 6.4.6 Smurfit WestRock
- 6.4.7 Tekni-Plex Inc.
- 6.4.8 Anchor Packaging Inc.
- 6.4.9 D&W Fine Pack
- 6.4.10 Sealed Air Corporation
- 6.4.11 Mondi Group
- 6.4.12 Huhtamaki Oyj
- 6.4.13 Pactiv Evergreen Inc.
- 6.4.14 Fabri-Kal LLC
- 6.4.15 Dart Container Corp.
- 6.4.16 Sabert Corporation
- 6.4.17 Genpak LLC
- 6.4.18 Silgan Plastics
- 6.4.19 Rompa Group
7 MARKET OPPORTUNITIES AND FUTURE OUTLOOK
- 7.1 White-space and Unmet-need Assessment

 2026年全球聚乙烯(PE)熱成型包裝市場報告
 熱成型包裝市場:2026-2032年全球市場預測(依材料、包裝類型、製造流程、應用及通路分類)熱成型淺托盤市場:2026-2032年全球市場預測(依材料、托盤類型、製造流程、形狀和應用分類)
 熱成型淺托盤市場規模、佔有率和成長分析:按材料、應用、最終用途、通路和地區分類-2026-2033年產業預測2026年全球熱成型醫用包裝市場報告
 熱成型包裝市場預測至2034年-按產品類型、材料類型、製造流程、熱封方式、最終用戶和地區分類的全球分析
 熱成型包裝市場報告:按材料、產品、最終用途和地區分類(2026-2034 年)
 熱成型包裝市場規模、佔有率、成長及全球產業分析:按類型、應用和地區的洞察,2026-2034年的預測
 全球熱成型淺托盤市場:依應用、材料及地區分類-市場規模、產業趨勢、機會分析及2026-2035年預測熱成型包裝市場:依材料、產品類型、成型技術及應用分類-2026-2032年全球市場預測