


 |
市場調查報告書
商品編碼
2114597
煤炭貿易:市場佔有率分析、產業趨勢與統計、成長預測(2026-2031)Coal Trading - Market Share Analysis, Industry Trends & Statistics, Growth Forecasts (2026 - 2031) |
||||||

※ 本網頁內容可能與最新版本有所差異。詳細情況請與我們聯繫。
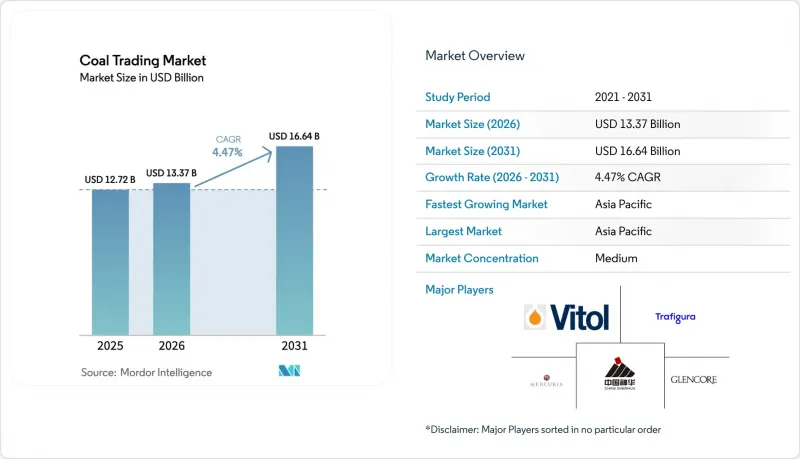
根據 Mordor Intelligence 預測,煤炭貿易市場規模將從 2025 年的 127.2 億美元和 2026 年的 133.7 億美元成長到 2031 年的 166.4 億美元,2026 年至 2031 年的複合年成長率為 4.47%。
本報告按煤炭類型(蒸氣煤、煉焦煤、褐煤等)、交易類型(現貨交易和長期合約)、最終用途行業(發電、鋼鐵冶金、水泥製造、化工和工業供熱等)以及地區(北美、歐洲、亞太、南美以及中東和非洲)進行分類。
全球煤炭貿易市場的趨勢與洞察
亞洲對次煙煤進口的需求正在激增。
2024年,中印電力公司進口煤炭7.93億噸,較上年增加13%。低硫印尼煤因其無需維修廢氣脫硫設備而備受青睞。次煙煤佔印度動力煤進口量的65%,這是因為其灰分含量較低,能夠縮短鍋爐維護週期,延長汽輪機壽命,並降低停機風險。 2020年至2024年間,東協電力業者新增燃煤發電裝置容量18吉瓦,支撐了對熱值在4,200至5,000千卡/公斤之間、符合低熱值和低硫含量(低於0.8%)規格的煤炭的穩定需求。印尼在該細分市場的主導地位加劇了供應風險。由於雅加達政府對國內市場有 25% 的煤炭供應義務,預計 2024 年需求將激增,因此出口路線已減少了 1,800 萬噸煤炭,迫使中國買家將煤炭來源多元化,包括俄羅斯遠東地區。
新興東南亞國家私營燃煤發電廠的擴張
2024年,獨立發電商(IPP)在越南、菲律賓和印尼共運作了12吉瓦的私營燃煤發電廠。燃料採購透過季度競標進行,而非與電力公司簽訂10年合約。這些發電商利用印尼煤炭(4,200千卡/公斤)和澳洲煤炭(5,500千卡/公斤)之間的價格差異進行套利,從而增加了現貨市場交易量,並刺激了區域煤炭仲介業務的發展。由於私人燃煤發電商不擁有自己的煤礦,他們從公開市場採購所需的所有煤炭,這進一步增加了對靈活煤炭混合和庫存融資服務的需求,而大型貿易商可以從中獲利。越南的平新4號擴建工程和菲律賓的Atimonan One Energy的設施就是這種模式的典型例子,這兩個設施在2025年的合約競標中合計每季進口240萬噸煤炭。
REPowerEU 和 IRA 加速了可再生能源的普及應用。
REPowerEU的目標是到2030年部署750吉瓦的可再生能源,屆時,一旦風能和太陽能發電在德國、西班牙和丹麥的發電量佔比超過50%,每年將取代1.2億噸煤炭。美國《通膨控制法案》(IRA)將向清潔能源信貸注入3,690億美元,用於每年新增40吉瓦的風能和太陽能發電,並加速剩餘15吉瓦燃煤發電裝置容量從煤炭向天然氣的轉型。在中國,光是2024年就新增了217吉瓦的太陽能發電裝置容量,預計到2030年,煤炭發電在國內發電量中的比例將降至45%。如果風能和太陽能發電的平準化成本在一年中的八個月低於煤電,電力公司將減少基本負載燃煤發電廠的運作,從而降低全球對海上煤炭發電的需求。
細分市場分析
隨著印度和東南亞國協高爐產能擴張,到2031年粗鋼產能將增加2.25億噸,預計煉焦煤的複合年成長率將達到5.1%,超過蒸氣的4.2%。 2025年,蒸氣在全球煤炭貿易市場佔有率中佔77.6%,但隨著可再生能源在經合組織國家取代基本負載煤炭,其成長速度正在放緩。褐煤僅佔煤炭貿易額的3.8%,且由於其含水量高,其流通仍限於區域市場。
2024年,受澳洲洪災影響,冶金煤產量下降,供應趨緊,動力煤溢價擴大至每噸180美元。這導致印度鋼鐵廠進口量創歷史新高。隨著鋼鐵企業簽訂多年期合約以確保碳含量為65%的原料穩定供應,全球冶金煤貿易市場預計將進一步擴張。發電用煤供需的穩定性取決於美國與歐盟20吉瓦發電裝置容量的二氧化碳捕集與儲存(CCS)設施能否成功實施。如果這些設施未能實施,預計從2028年起,發電用煤的交易量將逐步下降。
區域分析
預計到2025年,亞太地區將主導全球煤炭貿易市場,佔66.9%的市場佔有率,並預計到2031年將以4.9%的年均速度成長。在亞太地區內部,隨著國內礦山生產率的提高,預計到2028年,中國的煤炭進口量將穩定在5.5億噸左右;而隨著國內產量的增加,印度的目標是將煤炭進口量從2024年的2.45億噸減少到2031年的1.8億噸。東協地區的煤炭需求正以6.2%的年均速度成長,主要得益於越南18吉瓦燃煤電廠計畫以及菲律賓的需求。在菲律賓,煤炭佔呂宋島電網發電量的55%。
預計到2025年,歐洲的天然氣市佔率將達到12.4%。儘管天然氣價格持續波動,但預計到2027年,歐洲天然氣價格將以每年2.8%的暫時速度成長。此後,隨著歐盟可再生能源目標的實施,煤炭發電的經濟效益將受到衝擊,煤炭需求將以每年4.5%的速度下降。德國2024年的煤炭進口量達3,200萬噸,但由於法律規定的逐步淘汰措施,預計到2038年將實現零進口。
北美佔全球煤炭市場佔有率的8.7%,以出口為主導。 2024年,美國出口煤炭6,500萬噸,主要用於冶金用途,而僅少量進口煤炭用於阿巴拉契亞地區的鋼鐵廠。南美佔全球煤炭市場佔有率的6.2%,主要依賴哥倫比亞的出口,但受到社區主導的產量限制,且正以每年2.1%的速度萎縮。中東和非洲佔全球煤炭市場佔有率的5.8%。儘管理查茲灣煤礦產能的提升可望使南非的煤炭出口量在2026年達到6,000萬噸,但由於南非國家運輸集團(Transnet)鐵路運輸能力的限制,進一步成長面臨挑戰。
其他好處:
- Excel格式的市場預測(ME)表
- 3個月的分析師支持
目錄
第1章:引言
- 研究假設和市場定義
- 調查範圍
第2章:調查方法
第3章執行摘要
第4章 市場狀況
- 市場概覽
- 市場促進因素
- 亞洲對次煙煤進口的需求正在激增。
- 新興東南亞國家私營燃煤發電廠的擴張
- 解決理查茲灣港和秦皇島港的基礎設施瓶頸問題
- 煤炭實體交易平台數位化及基於區塊鏈的提單
- 印度沿海散貨運輸的優惠待遇
- 受天然氣價格波動影響,歐洲煤炭消費量將回升(2025-2027 年)
- 市場限制因素
- 在歐盟再生能源計畫 (REPowerEU) 和愛爾蘭再生能源法案 (IRA) 框架下,加速可再生能源部署規模。
- 加強經合組織成員國出口信貸機構對煤炭相關貸款的監管。
- 國際海事組織2030年的碳排放強度規定正在推升乾散貨運費。
- 印尼國內市場供應義務(DMO)上限
- 供應鏈分析
- 監理情勢
- 技術展望
- 波特五力模型
- 煤炭進出口量分析
第5章 市場規模與成長預測
- 按煤的類型
- 用於蒸氣(火力發電)的煤
- 煉焦煤(冶金)
- 褐煤
- 其他
- 交易機制
- 現貨交易
- 長期合約
- 按最終用途類別
- 發電業務
- 鋼鐵冶金
- 水泥製造
- 化學和工業加熱
- 其他(住宅、商業、交通運輸)
- 按地區
- 北美洲
- 美國
- 加拿大
- 墨西哥
- 歐洲
- 英國
- 德國
- 法國
- 西班牙
- 北歐國家
- 俄羅斯
- 其他歐洲國家
- 亞太地區
- 中國
- 印度
- 日本
- 韓國
- 東南亞國協
- 其他亞太國家
- 南美洲
- 巴西
- 阿根廷
- 哥倫比亞
- 其他南美國家
- 中東和非洲
- 阿拉伯聯合大公國
- 沙烏地阿拉伯
- 南非
- 其他中東和非洲國家
- 北美洲
第6章 競爭情勢
- 市場集中度
- 策略趨勢(併購、聯盟、購電協議)
- 市場佔有率分析(主要公司的市場排名和佔有率)
- 公司簡介
- Glencore PLC
- Vitol Holding BV
- Trafigura Group Pte Ltd
- Mercuria Energy Group
- Hind Energy & Coal Beneficiation India Ltd
- China Shenhua Energy Co Ltd
- China Coal Energy Co Ltd
- Mitsubishi Corp RtM Japan Ltd
- Centennial Coal Co Ltd
- Borneo Coal Trading
- Peabody Energy Corp
- Arch Resources Inc
- PT Adaro Energy Indonesia Tbk
- Yancoal Australia Ltd
- SUEK JSC
- Banpu Public Co Ltd
- PT Kaltim Prima Coal
- Noble Group Holdings Ltd
- Gunvor Group Ltd
- Xcoal Energy & Resources
第7章 市場機會與未來展望
According to Mordor Intelligence, the coal trading market size is projected to expand from USD 12.72 billion in 2025 and USD 13.37 billion in 2026 to USD 16.64 billion by 2031, registering a CAGR of 4.47% between 2026 to 2031.
This report is Segmented by Types of Coal (Steam Coal, Coking Coal, Lignite, and Others), Trader Mechanism (Spot Trading and Long-Term Contracts), End-Use Sector (Power Generation Utilities, Steel and Metallurgical, Cement Manufacturing, Chemical/Industrial Heating, and Others), and Geography (North America, Europe, Asia-Pacific, South America, and Middle East and Africa).
Global Coal Trading Market Trends and Insights
Surging Asian Demand for Sub-Bituminous Coal Imports
Chinese and Indian utilities purchased 793 million t of imported coal in 2024, up 13% year-on-year, favoring low-sulfur Indonesian grades that avoid flue-gas desulfurization retrofits. Sub-bituminous cargoes captured 65% of India's thermal-coal imports because lower ash content reduces boiler maintenance intervals, extending turbine life and cutting outage risk. ASEAN power producers added 18 GW of coal capacity between 2020 and 2024, underpinning steady demand for 4,200-5,000 kcal/kg material that balances lower calorific value against sub-0.8% sulfur specifications. Indonesian dominance in this niche concentrates supply risk; Jakarta's 25% domestic-market obligation has already withheld 18 million t from export channels during 2024 demand spikes, forcing Chinese buyers to diversify toward Russian Far-East coal.
Expansion of Merchant Coal-Fired Plants in Emerging SE Asia
Independent power producers commissioned 12 GW of merchant coal plants across Vietnam, the Philippines, and Indonesia in 2024, sourcing fuel via quarterly tenders rather than decade-long utility contracts. These generators arbitrage between Indonesian 4,200 kcal/kg coal and Australian 5,500 kcal/kg grades, increasing spot-market turnover and stimulating regional coal brokerage desks. Merchant operators, lacking captive mines, procure all requirements on the open market, creating incremental demand for flexible blending and inventory-financing services that large traders can monetize. Vietnam's Vinh Tan 4 extension and the Philippines' Atimonan One Energy facilities illustrate this model, collectively importing 2.4 million t per quarter in 2025 contract tenders.
Accelerating Renewable Build-Out Under REPowerEU & IRA
REPowerEU targets 750 GW of renewables by 2030, displacing 120 million t of coal demand each year once wind and solar exceed 50% of generation in Germany, Spain, and Denmark. The U.S. Inflation Reduction Act funnels USD 369 billion into clean-energy credits, adding 40 GW of wind and solar annually and accelerating coal-to-gas switching across 15 GW of remaining coal capacity. China's 217 GW solar build in 2024 alone signals that coal's domestic generation share will slip to 45% by 2030. When wind and solar undercut coal's levelized costs in eight months of the year, utilities curtail baseload coal units, trimming global seaborne steam-coal demand.
Other drivers and restraints analyzed in the detailed report include:
- Infrastructure Bottleneck Relief at Richards Bay & Qinhuangdao Ports
- Digitization of Physical Coal Trading Platforms & Blockchain B/Ls
- IMO 2030 Carbon-Intensity Rules Raising Dry-Bulk Freight Costs
For complete list of drivers and restraints, kindly check the Table Of Contents.
Segment Analysis
Coking coal's 5.1% forecast CAGR outpaces steam coal's 4.2% as Indian and ASEAN blast-furnace expansions add 225 million t of crude-steel capacity by 2031. Although steam coal controlled 77.6% of the global coal trading market share in 2025, its growth moderates as renewables displace baseload coal in OECD regions. Lignite contributed just 3.8% of trade value and remains limited to intra-regional flows due to high moisture content.
Tight metallurgical supply widened premiums to USD 180/t over thermal coal in 2024 after Australian floods curtailed output, prompting Indian mills to import record volumes. The global coal trading market size tied to metallurgical grades is poised to expand further as steelmakers lock in multi-year contracts that secure consistent 65% fixed-carbon material. Steam-coal stability hinges on the successful deployment of carbon-capture retrofits across 20 GW of U.S. and EU capacity; absent these installations, steam-coal volumes will see a gradual decline after 2028.
Complete Report Scope:
- By Coal Type
- Steam (Thermal) Coal
- Coking (Metallurgical) Coal
- Lignite
- Others
- By Trader Mechanism
- Spot Trading
- Long-term Contracts
- By End-use Sector
- Power Generation Utilities
- Steel and Metallurgical
- Cement Manufacturing
- Chemical/Industrial Heating
- Others (Residential, Commercial, Transport)
- By Geography
- North America
- United States
- Canada
- Mexico
- Europe
- United Kingdom
- Germany
- France
- Spain
- NORDIC Countries
- Russia
- Rest of Europe
- Asia-Pacific
- China
- India
- Japan
- South Korea
- ASEAN Countries
- Rest of Asia-Pacific
- South America
- Brazil
- Argentina
- Colombia
- Rest of South America
- Middle East and Africa
- United Arab Emirates
- Saudi Arabia
- South Africa
- Rest of Middle East and Africa
- North America
Geography Analysis
Asia-Pacific dominated the global coal trading market with a 66.9% share in 2025 and will grow at 4.9% through 2031. Within the region, China's imports plateau near 550 million t by 2028 as domestic mines scale productivity, whereas India targets a reduction from 245 million t in 2024 to 180 million t by 2031 on rising local output. ASEAN demand climbs 6.2% yearly, underpinned by Vietnam's 18 GW coal pipeline and the Philippines' 55% coal share in Luzon grid generation.
Europe held 12.4% in 2025, experiencing a temporary 2.8% annual uptick until 2027 as gas prices remain volatile; thereafter, coal demand contracts 4.5% annually once REPowerEU renewable targets suppress dispatch economics. Germany's imports reached 32 million t in 2024 but will trend to zero by 2038 under the legislated phase-out.
North America's 8.7% share is export-oriented; the U.S. shipped 65 million t of mostly metallurgical coal in 2024, while importing only niche volumes for Appalachian steel mills. South America's 6.2% portion revolves around Colombian exports that face community-driven output caps, shrinking 2.1% annually. Middle East & Africa captured 5.8%; Richards Bay's capacity upgrades may lift South African exports to 60 million t by 2026, yet Transnet rail limits further growth.
- Glencore PLC
- Vitol Holding BV
- Trafigura Group Pte Ltd
- Mercuria Energy Group
- Hind Energy & Coal Beneficiation India Ltd
- China Shenhua Energy Co Ltd
- China Coal Energy Co Ltd
- Mitsubishi Corp RtM Japan Ltd
- Centennial Coal Co Ltd
- Borneo Coal Trading
- Peabody Energy Corp
- Arch Resources Inc
- PT Adaro Energy Indonesia Tbk
- Yancoal Australia Ltd
- SUEK JSC
- Banpu Public Co Ltd
- PT Kaltim Prima Coal
- Noble Group Holdings Ltd
- Gunvor Group Ltd
- Xcoal Energy & Resources
Additional Benefits:
- The market estimate (ME) sheet in Excel format
- 3 months of analyst support
TABLE OF CONTENTS
1 Introduction
- 1.1 Study Assumptions & Market Definition
- 1.2 Scope of the Study
2 Research Methodology
3 Executive Summary
4 Market Landscape
- 4.1 Market Overview
- 4.2 Market Drivers
- 4.2.1 Surging Asian demand for sub-bituminous coal imports
- 4.2.2 Expansion of merchant coal-fired plants in emerging SE Asia
- 4.2.3 Infrastructure bottleneck relief at Richards Bay & Qinhuangdao ports
- 4.2.4 Digitisation of physical coal trading platforms & blockchain B/Ls
- 4.2.5 India's coastal shipping incentives for bulk cargo
- 4.2.6 Resurgence of European coal burn amid gas-price volatility (2025-27)
- 4.3 Market Restraints
- 4.3.1 Accelerating renewable build-out under REPowerEU & IRA
- 4.3.2 Stricter coal financing restrictions by OECD export-credit agencies
- 4.3.3 IMO 2030 carbon-intensity rules raising dry-bulk freight costs
- 4.3.4 Mandatory domestic-market-obligation (DMO) caps in Indonesia
- 4.4 Supply-Chain Analysis
- 4.5 Regulatory Landscape
- 4.6 Technological Outlook
- 4.7 Porter's Five Forces
- 4.7.1 Bargaining Power of Suppliers
- 4.7.2 Bargaining Power of Buyers
- 4.7.3 Threat of New Entrants
- 4.7.4 Threat of Substitutes
- 4.7.5 Competitive Rivalry
- 4.8 Coal Import-Export Volume Analysis
5 Market Size & Growth Forecasts
- 5.1 By Coal Type
- 5.1.1 Steam (Thermal) Coal
- 5.1.2 Coking (Metallurgical) Coal
- 5.1.3 Lignite
- 5.1.4 Others
- 5.2 By Trader Mechanism
- 5.2.1 Spot Trading
- 5.2.2 Long-term Contracts
- 5.3 By End-use Sector
- 5.3.1 Power Generation Utilities
- 5.3.2 Steel and Metallurgical
- 5.3.3 Cement Manufacturing
- 5.3.4 Chemical/Industrial Heating
- 5.3.5 Others (Residential, Commercial, Transport)
- 5.4 By Geography
- 5.4.1 North America
- 5.4.1.1 United States
- 5.4.1.2 Canada
- 5.4.1.3 Mexico
- 5.4.2 Europe
- 5.4.2.1 United Kingdom
- 5.4.2.2 Germany
- 5.4.2.3 France
- 5.4.2.4 Spain
- 5.4.2.5 NORDIC Countries
- 5.4.2.6 Russia
- 5.4.2.7 Rest of Europe
- 5.4.3 Asia-Pacific
- 5.4.3.1 China
- 5.4.3.2 India
- 5.4.3.3 Japan
- 5.4.3.4 South Korea
- 5.4.3.5 ASEAN Countries
- 5.4.3.6 Rest of Asia-Pacific
- 5.4.4 South America
- 5.4.4.1 Brazil
- 5.4.4.2 Argentina
- 5.4.4.3 Colombia
- 5.4.4.4 Rest of South America
- 5.4.5 Middle East and Africa
- 5.4.5.1 United Arab Emirates
- 5.4.5.2 Saudi Arabia
- 5.4.5.3 South Africa
- 5.4.5.4 Rest of Middle East and Africa
- 5.4.1 North America
6 Competitive Landscape
- 6.1 Market Concentration
- 6.2 Strategic Moves (M&A, Partnerships, PPAs)
- 6.3 Market Share Analysis (Market Rank/Share for key companies)
- 6.4 Company Profiles (includes Global level Overview, Market level overview, Core Segments, Financials as available, Strategic Information, Products & Services, and Recent Developments)
- 6.4.1 Glencore PLC
- 6.4.2 Vitol Holding BV
- 6.4.3 Trafigura Group Pte Ltd
- 6.4.4 Mercuria Energy Group
- 6.4.5 Hind Energy & Coal Beneficiation India Ltd
- 6.4.6 China Shenhua Energy Co Ltd
- 6.4.7 China Coal Energy Co Ltd
- 6.4.8 Mitsubishi Corp RtM Japan Ltd
- 6.4.9 Centennial Coal Co Ltd
- 6.4.10 Borneo Coal Trading
- 6.4.11 Peabody Energy Corp
- 6.4.12 Arch Resources Inc
- 6.4.13 PT Adaro Energy Indonesia Tbk
- 6.4.14 Yancoal Australia Ltd
- 6.4.15 SUEK JSC
- 6.4.16 Banpu Public Co Ltd
- 6.4.17 PT Kaltim Prima Coal
- 6.4.18 Noble Group Holdings Ltd
- 6.4.19 Gunvor Group Ltd
- 6.4.20 Xcoal Energy & Resources
7 Market Opportunities & Future Outlook
- 7.1 White-space & Unmet-need Assessment

 半碳化顆粒市場規模、佔有率和成長分析:按原料、應用、最終用戶、分銷管道、顆粒尺寸和地區分類 - 產業預測,2026-2033年
 中國煤炭產業:市場佔有率分析、產業趨勢與統計及成長預測(2026-2031年)冶金煤:市場佔有率分析、產業趨勢與統計、成長預測(2026-2031)
 煤炭市場規模、佔有率和成長分析:按類型、應用、開採方法、最終用戶、分銷管道和地區分類-2026-2033年產業預測
 焦煤市場規模、佔有率和成長分析:按類型、等級、開採流程、最終用戶、分銷管道和地區分類-2026-2033年產業預測
 煤炭交易市場規模、佔有率和成長分析:按煤炭類型、交易方式、終端用戶產業、供應來源、交易類型、分銷管道和地區分類-2026-2033年產業預測
 2026-2030年全球煉焦煤市場
 煤炭市場:2026-2032年全球市場預測(依煤炭類型、產品類型、品質、採礦技術及最終用途產業分類)煤炭自燃抑制劑市場:依化學類型、形態、應用方法、應用階段和最終用戶分類-全球預測,2026-2032年
 動力煤市場規模、佔有率和成長分析:按熱值、揮發分餾、工業應用、區域和產業預測,2026-2033年