


 |
市場調查報告書
商品編碼
2114556
排放監測系統:市場佔有率分析、產業趨勢與統計資料、成長預測(2026-2031 年)Emission Monitoring Systems - Market Share Analysis, Industry Trends & Statistics, Growth Forecasts (2026 - 2031) |
||||||

※ 本網頁內容可能與最新版本有所差異。詳細情況請與我們聯繫。
根據 Mordor Intelligence 預測,排放氣體監測系統市場規模預計將在 2025 年達到 34.8 億美元,2026 年達到 37.1 億美元,到 2031 年達到 51.2 億美元,2026 年至 2031 年的複合年成長率為 6.68%。
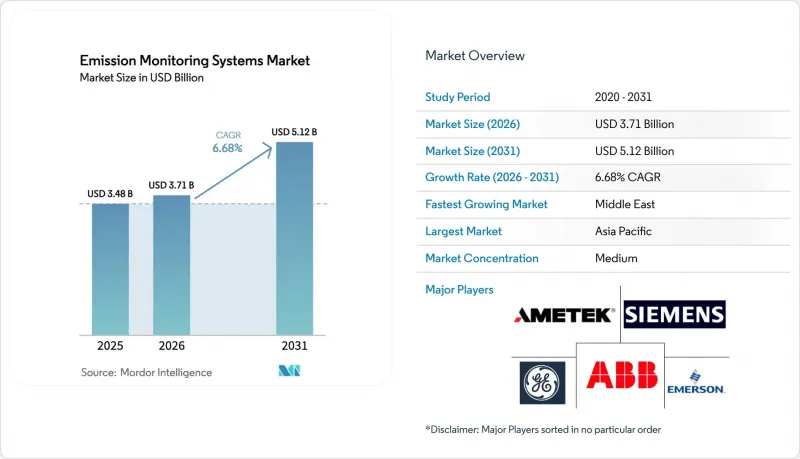
本報告按系統類型(CEMS 和 PEMS)、組件(硬體、軟體和服務)、監測技術(萃取方法、稀釋法和原位法)、終端用戶產業(發電、石油和天然氣等)以及地區(北美、南美、歐洲、亞太地區以及中東和非洲)進行細分。市場預測以美元計價。
全球排放氣體監測系統市場趨勢及洞察
在歐洲,能源管理系統 (CEMS) 的轉變(CEMS 的資本支出 (CAPEX) 負擔較重)是轉向結合了 CEMS 和 PEMS 的混合架構。
歐洲營運商正將預測性排放監測模型整合到現有的連續分析儀中,以減少資本投資,將安裝時間從12週縮短至4週,並加快合規報告的提交。德國《聯邦空氣污染控制法》核准低排放裝置採用預測方法,前提是季度最後覆核確認模型精度在±10%以內。荷蘭和英國也允許煉油廠火炬採用類似的柔軟性,從而將相關的煙囪排氣硬體預算減少40-50%。擁有成熟資料科學團隊的電力公司正在利用燃料流量、過量氧氣和火焰溫度等製程變數即時計算氮氧化物和二氧化硫的排放量,從而減少因分析儀維護而導致的非計劃運作。小規模工廠難以維護統計模型,這為提供軟體包、校準氣體和監管報告的供應商創造了服務機會。這種混合方法還縮短了技術更新周期,因為模型係數是透過軟體更新而不是更換硬體來更新的。
歐盟排放交易體系第四階段的強制性碳定價正在推動煙囪層級的監測。
根據歐盟排放交易體系(EU-ETS)第四階段,2024年的減排上限已提高至4.3%,預計到2025年,現貨價格將達到每噸80-100歐元(90-113美元)。對於一座年排放300萬噸二氧化碳的500兆瓦燃煤發電廠而言,其年度排放權成本高達2.4億歐元(2.72億美元),因此,EN 14181標準規定的±2%測量容差將直接影響其現金流。營運商正在維修加熱抽氣管線、冗餘分析儀和自動漂移診斷系統,以滿足精度標準。由於各設施爭相在2026年截止日期前獲得監測計畫的批准,光是波蘭和西班牙就佔2025年新訂單的38%。擁有完整EN 15267認證庫的供應商可以設定溢價,但區域電力公司越來越要求進行遠端校準,以解決技術人員短缺的問題。
歐洲因缺乏 TUV 和 MCERTS 認證的技術人員,導致安裝工作延誤。
根據EN 15267標準進行的現場認證需要由認可的工程師執行多點校準、線性度檢查和相對精度測試。儘管TUV SUD預計2025年的認證申請量將增加40%,但其工程師人數僅增加了12%,導致德國、波蘭和西班牙的平均等待時間為8至18週。小規模業者被迫推遲升級或接受依賴人工煙囪測試的臨時許可,這阻礙了監管機構的即時監控。這種短缺推高了認證服務的價格,促使大規模公共產業自籌資金進行工程師培訓項目,但漫長的認證前置作業時間阻礙了更快捷的解決方案。
細分市場分析
2025年,連續解決方案的市佔率維持在68.64%。這得歸功於歐盟排放交易體系(EU-ETS)、美國《清潔空氣法》以及中國超低排放法規數十年來不斷完善的要求。預測模型年均成長率達7.87%,吸引了希望避免在輔助排氣煙囪重複安裝分析設備的業者的注意。預計到2031年,用於預測模型的排放監測系統市場規模將超過12億美元,這反映了這些模型在日益數位化的電力公司中發揮的重要作用。德國和美國的早期採用者正在利用即時製程變數來模擬氮氧化物,其精度與抽取式測量值相差不超過±10%,在滿足監管要求的同時,硬體預算幾乎減半。中東煉油廠仍持謹慎態度,因為它們受到10年前簽署的長期租賃協議的約束,這些協議的有效期至2028-2030年。然而,在沙烏地阿拉伯「國家環境戰略」的法律規範下,混合火炬系統的先導計畫正在進行中。
在北美,聯合循環燃氣渦輪機在循環運轉過程中採用預測演算法,以避免因抽取式分析儀需要維護而導致的停機。亞太地區的電力公司正採取雙管齊下的策略:一方面在主鍋爐中維護連續運轉的分析儀,另一方面在二次機組中部署預測模型,這與中國針對燃煤發電廠的數位孿生政策相一致。將神經網路建模與企業碳計量相結合的雲端供應商正獲得越來越多的支持,以簡化季度監管報告。隨著越來越多的司法管轄區接受預測技術,排放監測系統市場的監管語言預計將從強制硬體部署轉向基於效能的精度標準。
到2025年,硬體支出將佔總支出的44.16%,反映出氣體分析儀、流量計和資料擷取設備的部署基礎已趨於成熟。隨著營運商將即時廢氣數據與企業資源規劃 (ERP) 和環境、社會及管治(ESG) 儀錶板整合,預計到2031年,軟體市場將以每年8.27%的速度成長。 2025年,一家擁有15座電廠的歐洲電力公司將來自60個廢氣煙囪的資料整合到一個雲端平台,透過自動漂移警報減少了25%的校準工作量。該雲端平台還為預測性維護奠定了基礎,透過在感測器污垢導致精度下降之前通知技術人員,確保符合合規容差。
服務(包括安裝、校準、第三方認證和多年維護)貢獻了剩餘收入,並由累積安裝量支撐。供應商透過將軟體訂閱與服務合約捆綁銷售來抵消硬體商品化的影響。氣體分析儀,特別是非分散紅外線 (NDIR) 二氧化碳檢測器和化學冷光氮氧化物檢測器,仍然是重要的收入來源,但隨著運營商要求使用 OPC UA 和以太網以避免被供應商鎖定,支持開放協議的數據採集硬體成長最快。隨著軟體採用率的提高,排放氣體監測系統產業正從硬體銷售轉向基於分析能力的經常性收入模式。
區域分析
預計到2025年,亞太地區將佔全球銷售額的36.17%,這主要得益於中國燃煤發電產能的成長、印度「國家清潔空氣計畫」的實施以及東南亞的廢棄物發電計畫。該地區超低排放標準和城市固態廢棄物處理指令的實施,推動了硬體更新換代和軟體升級,同時,中國和韓國的本土製造商也給西方供應商帶來了更大的價格壓力。隨著現場雷射檢測法的普及,傳統萃取檢測法的飽和度逐漸降低,預計亞太地區的排放監測系統市場將穩定成長。
中東地區正崛起為成長最快的地區,預計到2031年年複合成長率(CAGR)將達到8.19%。沙烏地阿拉伯的國家環境戰略規定,到2027年,所有超過50兆瓦的熱輸入都必須進行持續監測,這迫使煉油廠、海水淡化廠和燃氣發電廠在煙囪上安裝分析設備,取代以往依賴年度檢查的做法。阿拉伯聯合大公國(阿拉伯聯合大公國)已頒布2022年第24號聯邦法規,要求工業業者在三年內實施最佳可行技術(BAT),包括持續監控。煉油廠的維修和石化廠瓶頸消除工程正在推動該地區支出增加,加速了分析設備和服務相結合的合約簽訂。
歐洲市場依然龐大,主要受監管合規性驅動,其中德國、波蘭、西班牙和義大利佔了大部分裝機量。歐盟排放交易體系 (EU-ETS) 下更為嚴格的法規以及工業排放指令下更為嚴格的標準,正推動著精度達到±2%的分析儀升級換代。在北美,美國對檢驗減排量的稅額扣抵以及加拿大基於排放的定價機制擴展到更多州,也推動了設備的維修。在南美,隨著巴西、阿根廷和墨西哥的空氣品質管理機構實施連續監測,選擇性需求正在顯現。同時,在非洲,市場活動集中在南非、奈及利亞和埃及,跨國公司正努力在這些國家遵守出口市場的環境標準。這些趨勢共同確保了全球排放監測系統市場的多元化。
其他好處:
- Excel格式的市場預測(ME)表
- 3個月的分析師支持
目錄
第1章:引言
- 研究假設和市場定義
- 調查範圍
第2章:調查方法
第3章執行摘要
第4章 市場狀況
- 市場概覽
- 市場促進因素
- 歐洲從需要資本支出(CAPEX)的CEMS到混合CEMS-PEMS架構的過渡
- 歐盟排放交易體系(EU-ETS)第四階段的強制碳定價正在推動歐洲的煙囪級監測。
- 根據《通膨控制法》對稅額扣抵的檢驗,導致美國發電廠的商業能源管理系統 (CEMS)維修數量激增。
- 在亞太地區的垃圾焚化發電發電廠,現場安裝的雷射感測器可降低生命週期成本 30%。
- 印度的國家清潔空氣計畫正在加速燃煤發電廠)。
- 國際海事組織 (IMO) 2023 年的 EEXI 和 CII 法規促進了船舶安全管理系統 (SEMS) 在全球航運業的應用。
- 市場限制因素
- 由於缺乏 TUV 和 MCERTS 認證的技術人員,歐洲的運作啟動被推遲了。
- 熱帶地區高濕度偏差會增加依從性錯誤的風險。
- 在美國電力公司中,老舊的DCS和DAQ之間的互通性差距正在推高維修成本。
- 長期CEMS租賃模式帶來的資金限制阻礙了PEMS在中東地區的廣泛應用。
- 產業生態系分析
- 技術展望
- 宏觀經濟因素對市場的影響
- 波特五力分析
第5章 市場規模與成長預測
- 依系統類型
- 連續排放監測系統(CEMS)
- 預測性排放氣體監測系統(PEMS)
- 按組件
- 硬體
- 氣體分析儀
- 流速和不透明度監測器
- 數據採集系統(DAS)
- 軟體
- 獨立版
- 雲端託管
- 服務
- 實施與部署
- 校準和認證
- 支援與維護
- 硬體
- 透過監測技術
- 提取公式
- 濕熱
- 冷乾
- 稀釋
- In-Situ
- 可調諧二極體雷射光譜(TDLS)
- 提取公式
- 按最終用戶行業分類
- 發電
- 燃煤發電
- 聯合循環燃氣渦輪機
- 石油和天然氣
- 上游部門
- 中游
- 下游產業和煉油廠
- 金屬和採礦
- 化工/石油化工
- 製藥
- 水泥和骨材
- 紙漿和造紙
- 垃圾焚化發電和焚燒
- 海事(船載)
- 發電
- 按地區
- 北美洲
- 美國
- 加拿大
- 墨西哥
- 南美洲
- 巴西
- 阿根廷
- 其他南美國家
- 歐洲
- 英國
- 德國
- 法國
- 義大利
- 西班牙
- 俄羅斯
- 其他歐洲國家
- 亞太地區
- 中國
- 印度
- 日本
- 韓國
- 澳洲
- 東南亞
- 其他亞太國家
- 中東
- 阿拉伯聯合大公國
- 沙烏地阿拉伯
- 土耳其
- 其他中東國家
- 非洲
- 南非
- 奈及利亞
- 埃及
- 其他非洲國家
- 北美洲
第6章 競爭情勢
- 市場集中度
- 策略趨勢
- 市佔率分析
- 公司簡介
- ABB Ltd.
- Siemens AG
- Emerson Electric Co.
- General Electric Company
- AMETEK Inc.
- Thermo Fisher Scientific Inc.
- Honeywell International Inc.
- Teledyne Technologies Inc.
- HORIBA Ltd.
- SICK AG
- Rockwell Automation Inc.
- Fuji Electric Co. Ltd.
- Advanced Emissions Solutions Inc.
- ENVEA Global SAS
- Parker Hannifin Corp.
- Baker Hughes Co.
- Cemtrex Inc.
- Babcock and Wilcox Enterprises Inc.
- Opsis AB
- Altech Environment USA
第7章 市場機會與未來展望
According to Mordor Intelligence, the emission monitoring systems market size is projected to be USD 3.48 billion in 2025, USD 3.71 billion in 2026, and reach USD 5.12 billion by 2031, growing at a CAGR of 6.68% from 2026 to 2031.
This report is Segmented by System Type (CEMS, and PEMS), Component (Hardware, Software, and Services), Monitoring Technology (Extractive, Dilution, and In-Situ), End-User Industry (Power Generation, Oil and Gas, and More), and Geography (North America, South America, Europe, Asia Pacific, Middle East, Africa). The Market Forecasts are Provided in Terms of Value (USD).
Global Emission Monitoring Systems Market Trends and Insights
Transition From CAPEX-Heavy CEMS to Hybrid CEMS-PEMS Architectures in Europe
European operators overlay predictive emission monitoring models on existing continuous analyzers to curb capital spending, cut installation from 12 weeks to 4 weeks, and accelerate compliance reporting. Germany's Federal Immission Control Act endorses predictive methods for low-emission units once quarterly crosschecks confirm model accuracy within +-10%. The Netherlands and United Kingdom grant similar flexibility for refinery flares, trimming hardware budgets 40%-50% for ancillary stacks. Utilities with mature data-science teams exploit process variables such as fuel flow, excess oxygen, and flame temperature to calculate nitrogen oxides and sulfur dioxide in real time, reducing unscheduled downtime for analyzer maintenance. Smaller plants struggle to maintain the statistical models, prompting a services opportunity for vendors that bundle software, calibration gases, and regulatory reporting. The hybrid path also supports faster technology refresh cycles because model coefficients update in software rather than through hardware swaps.
Mandatory EU-ETS Phase IV Carbon Pricing Driving Stack-Level Monitoring
EU-ETS Phase IV tightened the cap reduction factor to 4.3% in 2024, pushing spot prices to EUR 80-EUR 100 per metric ton (USD 90-USD 113) during 2025. A 500 MW coal plant emitting 3 million tCO2 per year faces EUR 240 million (USD 272 million) in annual allowance costs, so a +-2% measurement margin mandated by EN 14181 directly influences cash flow. Operators retrofit heated extractive lines, redundant analyzers, and automated drift diagnostics to meet the precision threshold. Poland and Spain alone represented 38% of new orders in 2025 as facilities rushed to secure monitoring-plan approvals before the 2026 deadline. Vendors with full EN 15267 certification libraries command premium pricing, although regional utilities increasingly demand remote calibration to overcome technician shortages.
Scarcity of TUV and MCERTS-Certified Technicians Delaying European Commissioning
Field certification under EN 15267 requires accredited engineers to perform multi-point calibration, linearity checks, and relative accuracy testing. TUV SUD logged a 40% rise in requests during 2025 yet expanded its engineer roster only 12%, lifting average wait times from 8 weeks to 18 weeks in Germany, Poland, and Spain. Smaller operators defer upgrades or accept provisional permits that rely on manual stack tests, eroding real-time visibility for regulators. The shortage sparks price inflation for certification services and encourages larger utilities to self-fund technician training programs, but accreditation lead times restrain quick fixes.
Other drivers and restraints analyzed in the detailed report include:
- Inflation Reduction Act Verification Creating United States Retrofit Surge
- In-Situ Laser Sensors Cutting Lifecycle Cost by 30% in Asia Pacific Waste-to-Energy Plants
- High Humidity Bias Raising False-Compliance Risk in Tropical Regions
For complete list of drivers and restraints, kindly check the Table Of Contents.
Segment Analysis
Continuous solutions retained a 68.64% share in 2025, anchored by decades of codified requirements under EU-ETS, the United States Clean Air Act, and China's ultra-low emission rules. Predictive models will register a 7.87% annual advance, capturing interest from operators keen to avoid analyzer duplication on ancillary stacks. The emission monitoring systems market size for predictive models is forecast to exceed USD 1.2 billion by 2031, reflecting their role in digitally mature utilities. Early adopters in Germany and the United States exploit real-time process variables to simulate nitrogen oxides within +-10% of extractive readings, satisfying regulators while shaving hardware budgets by nearly half. Middle Eastern refineries remain cautious because long-term leases signed a decade ago lock them into fixed continuous contracts until 2028-2030, but hybrid pilots on flare systems are underway with regulatory oversight from Saudi Arabia's National Environment Strategy.
In North America, combined-cycle gas turbines use predictive algorithms during cycling operation to avoid downtime when extractive analyzers require maintenance. Asia Pacific utilities adopt a split strategy, retaining continuous analyzers on primary boilers and deploying predictive models on secondary units to align with China's digital-twin policy for coal plants. Cloud vendors that combine neural-network modeling with enterprise carbon accounting gain traction because they simplify quarterly regulatory reporting. As more jurisdictions recognize predictive techniques, the emission monitoring systems market will likely see regulatory language shift from prescriptive hardware mandates to performance-based accuracy thresholds.
Hardware accounted for 44.16% of 2025 spending, reflecting a mature installed base of gas analyzers, flow meters, and data acquisition units. Software will grow 8.27% each year through 2031 as operators integrate real-time stack data with enterprise resource planning and environmental, social, and governance dashboards. A 15-plant European utility consolidated data from 60 stacks into a cloud portal in 2025, trimming calibration labor 25% by automating drift alerts. Cloud platforms also underpin predictive maintenance, notifying technicians before sensor fouling degrades accuracy, thereby protecting compliance margins.
Services (installation, calibration, third-party certification, and multi-year maintenance) capture the balance of revenue and ride the cumulative installed base. Vendors tie software subscriptions to service agreements, offsetting hardware commoditization. Gas analyzers remain the revenue cornerstone, especially nondispersive infrared CO2 cells and chemiluminescence nitrogen oxide detectors, yet open-protocol data acquisition hardware grows fastest as operators demand OPC UA and Ethernet to avoid vendor lock-in. As software penetration rises, the emission monitoring systems industry pivots toward recurring revenue models built on analytics rather than box sales.
Complete Report Scope:
- By System Type
- Continuous Emission Monitoring Systems (CEMS)
- Predictive Emission Monitoring Systems (PEMS)
- By Component
- Hardware
- Gas Analyzers
- Flow and Opacity Monitors
- Data Acquisition Systems (DAS)
- Software
- Stand-Alone
- Cloud-Hosted
- Services
- Installation and Deployment
- Calibration and Certification
- Support and Maintenance
- Hardware
- By Monitoring Technology
- Extractive
- Hot-Wet
- Cold-Dry
- Dilution
- In-Situ
- Tunable Diode Laser Spectroscopy (TDLS)
- Extractive
- By End-User Industry
- Power Generation
- Coal-Fired
- Combined-Cycle Gas Turbines
- Oil and Gas
- Upstream
- Midstream
- Downstream and Refineries
- Metals and Mining
- Chemicals and Petrochemicals
- Pharmaceuticals
- Cement and Aggregates
- Pulp and Paper
- Waste-to-Energy and Incineration
- Maritime (Ship-Board)
- Power Generation
- By Geography
- North America
- United States
- Canada
- Mexico
- South America
- Brazil
- Argentina
- Rest of South America
- Europe
- United Kingdom
- Germany
- France
- Italy
- Spain
- Russia
- Rest of Europe
- Asia Pacific
- China
- India
- Japan
- South Korea
- Australia
- Southeast Asia
- Rest of Asia Pacific
- Middle East
- United Arab Emirates
- Saudi Arabia
- Turkey
- Rest of Middle East
- Africa
- South Africa
- Nigeria
- Egypt
- Rest of Africa
- North America
Geography Analysis
Asia Pacific retained 36.17% of revenue in 2025, anchored by China's coal capacity, India's National Clean Air Programme rollouts, and Southeast Asian waste-to-energy projects. The region's policy mix of ultra-low emission standards and municipal-solid-waste directives sustains hardware replacement and software upgrades, while local fabricators in China and South Korea intensify price pressure on Western suppliers. The emission monitoring systems market size in Asia Pacific is forecast to climb steadily as in-situ laser uptake offsets extractive saturation.
The Middle East emerges as the fastest-growing region at an 8.19% CAGR through 2031. Saudi Arabia's National Environment Strategy mandates continuous monitoring for thermal inputs above 50 MW by 2027, compelling refineries, desalination plants, and gas-fired power stations to install analyzers on stacks that previously relied on annual tests. The United Arab Emirates enacted Federal Decree-Law 24-2022, giving industrial operators three years to adopt best available techniques, including continuous monitoring. Refinery upgrades and petrochemical debottlenecking drive bundled analyzer-plus-service contracts that elevate regional spend.
Europe remains large and compliance-driven, with Germany, Poland, Spain, and Italy accounting for most installations. Tightened EU-ETS rules and Industrial Emissions Directive standards encourage analyzer replacements that deliver +-2% accuracy. North America sees retrofit momentum as United States tax credits reward verified emission cuts, and Canada's Output-Based Pricing System expands to more provinces. South America adds selective demand in Brazil, Argentina, and Mexico as state-level air agencies adopt continuous monitoring, while Africa concentrates activity in South Africa, Nigeria, and Egypt where multinational plants align with export-market environmental norms. Collectively, these dynamics ensure global diversity in the emission monitoring systems market.
- ABB Ltd.
- Siemens AG
- Emerson Electric Co.
- General Electric Company
- AMETEK Inc.
- Thermo Fisher Scientific Inc.
- Honeywell International Inc.
- Teledyne Technologies Inc.
- HORIBA Ltd.
- SICK AG
- Rockwell Automation Inc.
- Fuji Electric Co. Ltd.
- Advanced Emissions Solutions Inc.
- ENVEA Global SAS
- Parker Hannifin Corp.
- Baker Hughes Co.
- Cemtrex Inc.
- Babcock and Wilcox Enterprises Inc.
- Opsis AB
- Altech Environment U.S.A.
Additional Benefits:
- The market estimate (ME) sheet in Excel format
- 3 months of analyst support
TABLE OF CONTENTS
1 INTRODUCTION
- 1.1 Study Assumptions and Market Definition
- 1.2 Scope of the Study
2 RESEARCH METHODOLOGY
3 EXECUTIVE SUMMARY
4 MARKET LANDSCAPE
- 4.1 Market Overview
- 4.2 Market Drivers
- 4.2.1 Transition From CAPEX-Heavy CEMS to Hybrid CEMS-PEMS Architectures in Europe
- 4.2.2 Mandatory EU-ETS Phase-IV Carbon Pricing Driving Stack-Level Monitoring, Europe
- 4.2.3 Inflation Reduction Act Tax-Credit Verification Creating Surge in United States Power-Plant CEMS Retrofits
- 4.2.4 In-Situ Laser-Based Sensors Cutting Lifecycle Cost by 30% in Asia Pacific Waste-to-Energy Plants
- 4.2.5 National Clean Air Programme Accelerating Coal-Fired CEMS Roll-Outs, India
- 4.2.6 IMO 2023 EEXI and CII Rules Triggering Ship-Board SEMS Installations, Global Maritime
- 4.3 Market Restraints
- 4.3.1 Scarcity of TUV and MCERTS-Certified Technicians Delaying European Commissioning
- 4.3.2 High Humidity Bias in Tropical Regions Raising False-Compliance Risk
- 4.3.3 Legacy DCS-DAQ Inter-Operability Gaps Inflating Retrofit Costs in United States Utilities
- 4.3.4 Capital Lock-In From Long-Term CEMS Leasing Models Hindering PEMS Adoption, Middle East
- 4.4 Industry Ecosystem Analysis
- 4.5 Technological Outlook
- 4.6 Impact of Macroeconomic Factors on the Market
- 4.7 Porter's Five Forces Analysis
- 4.7.1 Bargaining Power of Suppliers
- 4.7.2 Bargaining Power of Buyers
- 4.7.3 Threat of New Entrants
- 4.7.4 Threat of Substitutes
- 4.7.5 Intensity of Competitive Rivalry
5 MARKET SIZE AND GROWTH FORECASTS (VALUE)
- 5.1 By System Type
- 5.1.1 Continuous Emission Monitoring Systems (CEMS)
- 5.1.2 Predictive Emission Monitoring Systems (PEMS)
- 5.2 By Component
- 5.2.1 Hardware
- 5.2.1.1 Gas Analyzers
- 5.2.1.2 Flow and Opacity Monitors
- 5.2.1.3 Data Acquisition Systems (DAS)
- 5.2.2 Software
- 5.2.2.1 Stand-Alone
- 5.2.2.2 Cloud-Hosted
- 5.2.3 Services
- 5.2.3.1 Installation and Deployment
- 5.2.3.2 Calibration and Certification
- 5.2.3.3 Support and Maintenance
- 5.2.1 Hardware
- 5.3 By Monitoring Technology
- 5.3.1 Extractive
- 5.3.1.1 Hot-Wet
- 5.3.1.2 Cold-Dry
- 5.3.2 Dilution
- 5.3.3 In-Situ
- 5.3.3.1 Tunable Diode Laser Spectroscopy (TDLS)
- 5.3.1 Extractive
- 5.4 By End-User Industry
- 5.4.1 Power Generation
- 5.4.1.1 Coal-Fired
- 5.4.1.2 Combined-Cycle Gas Turbines
- 5.4.2 Oil and Gas
- 5.4.2.1 Upstream
- 5.4.2.2 Midstream
- 5.4.2.3 Downstream and Refineries
- 5.4.3 Metals and Mining
- 5.4.4 Chemicals and Petrochemicals
- 5.4.5 Pharmaceuticals
- 5.4.6 Cement and Aggregates
- 5.4.7 Pulp and Paper
- 5.4.8 Waste-to-Energy and Incineration
- 5.4.9 Maritime (Ship-Board)
- 5.4.1 Power Generation
- 5.5 By Geography
- 5.5.1 North America
- 5.5.1.1 United States
- 5.5.1.2 Canada
- 5.5.1.3 Mexico
- 5.5.2 South America
- 5.5.2.1 Brazil
- 5.5.2.2 Argentina
- 5.5.2.3 Rest of South America
- 5.5.3 Europe
- 5.5.3.1 United Kingdom
- 5.5.3.2 Germany
- 5.5.3.3 France
- 5.5.3.4 Italy
- 5.5.3.5 Spain
- 5.5.3.6 Russia
- 5.5.3.7 Rest of Europe
- 5.5.4 Asia Pacific
- 5.5.4.1 China
- 5.5.4.2 India
- 5.5.4.3 Japan
- 5.5.4.4 South Korea
- 5.5.4.5 Australia
- 5.5.4.6 Southeast Asia
- 5.5.4.7 Rest of Asia Pacific
- 5.5.5 Middle East
- 5.5.5.1 United Arab Emirates
- 5.5.5.2 Saudi Arabia
- 5.5.5.3 Turkey
- 5.5.5.4 Rest of Middle East
- 5.5.6 Africa
- 5.5.6.1 South Africa
- 5.5.6.2 Nigeria
- 5.5.6.3 Egypt
- 5.5.6.4 Rest of Africa
- 5.5.1 North America
6 COMPETITIVE LANDSCAPE
- 6.1 Market Concentration
- 6.2 Strategic Moves
- 6.3 Market Share Analysis
- 6.4 Company Profiles (includes Global Level Overview, Market Level Overview, Core Segments, Financials as Available, Strategic Information, Market Rank/Share for Key Companies, Products and Services, and Recent Developments)
- 6.4.1 ABB Ltd.
- 6.4.2 Siemens AG
- 6.4.3 Emerson Electric Co.
- 6.4.4 General Electric Company
- 6.4.5 AMETEK Inc.
- 6.4.6 Thermo Fisher Scientific Inc.
- 6.4.7 Honeywell International Inc.
- 6.4.8 Teledyne Technologies Inc.
- 6.4.9 HORIBA Ltd.
- 6.4.10 SICK AG
- 6.4.11 Rockwell Automation Inc.
- 6.4.12 Fuji Electric Co. Ltd.
- 6.4.13 Advanced Emissions Solutions Inc.
- 6.4.14 ENVEA Global SAS
- 6.4.15 Parker Hannifin Corp.
- 6.4.16 Baker Hughes Co.
- 6.4.17 Cemtrex Inc.
- 6.4.18 Babcock and Wilcox Enterprises Inc.
- 6.4.19 Opsis AB
- 6.4.20 Altech Environment U.S.A.
7 MARKET OPPORTUNITIES AND FUTURE OUTLOOK
- 7.1 White-Space and Unmet-Need Assessment

 排放氣體監測系統市場-2026-2032年全球市場預測
 2035 年前 Euro 7 法規遵循市場分析及預測:按類型、產品類型、服務、技術、組件、應用、材料類型、製程和最終用戶分類
 排放氣體監測系統市場:按技術、產業和地區分類
 全球連續排放氣體監測系統(CEMS)市場報告:2021-2032年歷史表現及預測
 2026年全球連續排放監測系統市場報告
 排放氣體監測系統市場:按類型、應用、組件、技術、最終用戶、國家和地區分類-全球產業分析、市場規模、市場佔有率和預測(2026-2033 年)
 2026-2030年全球海事排放監測系統市場排放監測系統 (EMS) 市場分析及預測(至 2035 年):按類型、產品類型、服務、技術、組件、應用、部署類型、最終用戶、功能和安裝類型分類連續排放監測系統市場分析及預測(至2035年):按類型、產品類型、服務、技術、組件、應用、部署類型、最終用戶和功能分類2026年全球排放監測系統市場報告