


 |
市場調查報告書
商品編碼
2114529
農業生技藥品試驗:市場佔有率分析、產業趨勢與統計、成長預測(2026-2031 年)Agricultural Biologicals Testing - Market Share Analysis, Industry Trends & Statistics, Growth Forecasts (2026 - 2031) |
||||||

※ 本網頁內容可能與最新版本有所差異。詳細情況請與我們聯繫。
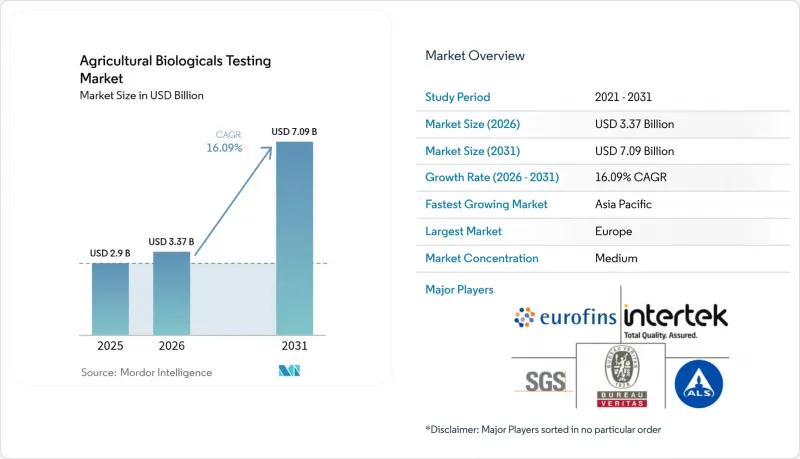
據 Mordor Intelligence 稱,2025 年農業生技藥品檢測市場價值為 29 億美元,預計到 2031 年將達到 70.9 億美元,而 2026 年為 33.7 億美元,預測期(2026-2031 年)的複合年成長率為 16.09%。
本報告按產品類型(例如,生物農藥)、應用領域(例如,田間支援)、作物類型(例如,穀物)和地區(例如,北美、歐洲、亞太地區)進行細分。市場預測以貨幣價值(美元)表示。
全球農業生技藥品檢測市場趨勢及洞察
擴大有機農業種植面積
有機面積的擴張速度持續超過傳統農田,認證機構現在要求在生物來源材料之前,進行多季田間試驗、殘留分析和土壤微生物組研究。美國國家有機計畫 (NOP) 正在加強殘留監測,要求檢測實驗室整合先進的層析法和分子分析工作流程。歐洲有機認證體係也體現了類似的檢測要求,而基於區塊鏈的可追溯性的引入,正迫使檢測實驗室升級其數位化基礎設施。田間試驗在不同的氣候帶進行,以捕捉變異性,從而導致兩到三個收穫季節的檢測量增加。有機認證產品的高價可以抵消增加的檢測成本,為檢測服務創造永續的財務循環。隨著監管機構收緊有機投入品清單,製造商正依靠獨立的良好實驗室規範 (GLP) 數據來保護其產品在盈利的有機市場中的地位。
支持生物來源產品的嚴格國際法規
美國環保署 (EPA) 現已強制要求對生化農藥進行分子表徵和全面的毒性測試,而中國農業部下屬的農藥管理所 (ICAMA) 則對微生物農藥採用了類似的註冊程序。這一趨勢統一了基礎資料包,但也提高了文件編制的難度,使大規模的、獲得良好實驗室規範 (GLP) 認證的供應商更具優勢。上市後監測條款確保產品上市後仍需持續進行測試,進而為檢測實驗室帶來持續的收入。特定貿易區內的數據互認避免了完全重複的工作,但區域性的殘留和環境調查仍然必不可少。快速核准程序有利於提交包含全面分析結果的申請,迫使申請人從一開始就投資於高品質的檢測實驗室。因此,一個規模更大、更可預測的檢測流程正在形成,並以長期的監管合規性為基礎。
生物檢測指引缺乏統一性
監管碎片化迫使企業在每個司法管轄區重複測試,導致成本和時間增加一倍。在統計終點和環境安全標準方面存在分歧,阻礙了經濟合作暨發展組織)的協調工作,尤其是在RNA類農藥領域。在新興市場,指南草案往往缺乏明確的執行機制,阻礙了早期測試投資。中小企業承受著不成比例的負擔,因為它們有限的資金和人力被多個並行專案消耗殆盡。在標準條件和終點統一之前,測試實驗室必須針對每個提交的樣品調整測試方案,導致規模經濟效益喪失,研發週期延長。
細分市場分析
2025年,在成熟的法律規範和標準化的GLP(良好實驗室規範)規程的支持下,生物農藥領域佔據了農業生技藥品檢測市場43.62%的佔有率。隨著微生物、植物來源和RNA類產品的研發推進,與生物農藥註冊相關的農業生技藥品檢測市場規模預計將持續成長至2031年。檢測實驗室透過利用既定的需求模式,實現了可預測的檢測計劃和運轉率。隨著歐盟2019/1009號法規的實施,土壤健康在全球範圍內受到關注,生物肥料的市場佔有率成長至27.68%。隨著生物促效劑定義的日益明確,該類別實現了最高的複合年成長率(CAGR),達到17.15%,檢測項目也正在擴展,涵蓋植物代謝體學和基因表現譜分析。檢測實驗室正在將業務拓展到這些細分領域,以應對即將到來的監管里程碑,預計這將進一步增加其工作量。
除了監管協調之外,產品類型的多樣化也增強了檢測實驗室應對經濟波動的能力。設備的折舊免稅額成本分攤到各種檢測項目中,研究人員的交叉訓練也使得人員配置更具彈性。隨著RNA干擾產品的上市,對用於檢驗作用機制和脫靶效應的分子檢測的需求日益成長,這增加了服務的複雜性,也提高了單次檢測的收入。
區域分析
亞太地區正經歷最快的成長,預計到2031年將維持16.12%的複合年成長率。這主要歸功於中國根據東協(ICAMA)法規要求提交所有微生物農藥的分子數據,以及日本採用需要先進分子診斷技術的RNA干擾檢測方案。中國廣闊的耕地面積創造了穩定的需求,因為國內外公司都需要進行本地測試以註冊新產品。同時,印度的有機農地正以每年超過12%的速度擴張,推動認證機構進行更多功效測試。在韓國,當地檢測實驗室正在升級其數據平台,以便將生物樣本採集與智慧農業感測器結合,從而直接連接到物聯網(IoT)儀錶板。由於人事費用較低,亞洲檢測公司能夠以低於許多西方供應商的價格進行大規模、多地點的測試。在東協,新的協調工作正在進行中,旨在統一測試模板,預計這將在未來幾年減少東南亞地區的監管摩擦。
北美地區仍佔據最大的收入佔有率,預計到2025年將達到近34.68%。這主要得益於該地區已有超過200家獲得GLP認證的機構涵蓋了所有生物檢測項目。美國環保署(EPA)和加拿大植物管理與監管局(PMRA)採用的通用模板,使委託方能夠在保持科學嚴謹性的同時,將重複檢測成本降低高達20%。墨西哥出口生產商正積極爭取對銷往美國和歐洲的產品進行零殘留認證,檢測數量正以每年18%的速度成長。許多美國實驗室已應用人工智慧(AI)工具,將資料審核時間縮短了約四分之一,使資源能夠重新投入新型微生物控制檢測。此外,該地區還受益於與大學的緊密夥伴關係,這使得下一代檢測方案能夠在推廣至全球之前進行試點部署。
歐洲正在取得進展,2019/1009 號法規為生物促效劑測試提供了全球最詳盡的藍圖。德國和法國憑藉其大規模的農業部門和嚴格的合規文化,貢獻了該地區超過 40% 的收入。英國脫歐後的新規將強制要求雙重申請,這將使在英吉利海峽兩岸銷售的產品的測試工作量增加約 10%。將於本十年後半期生效的數位產品護照法規將要求使用區塊鏈技術的測試文件,這項變更將使擁有先進資料基礎設施的實驗室受益。由於「綠色新政」的獎勵以及荷蘭等專注於溫室作物的專門中心,儘管歐洲大陸氣候差異巨大,但該地區的研發管線仍保持強勁。
其他好處:
- Excel格式的市場預測(ME)表
- 3個月的分析師支持
目錄
第1章:引言
- 研究假設和市場定義
- 調查範圍
第2章:調查方法
第3章執行摘要
第4章 市場狀況
- 市場概覽
- 市場促進因素
- 擴大有機農業種植面積
- 全球對生技藥品有利的嚴格法規
- 消費者對無殘留食品的需求日益成長
- 主要農藥生產商加速研發投入
- 中型生技新創公司外包業務激增。
- 強制性數位化溯源和作物護照
- 市場限制因素
- 缺乏統一的生物學檢測指南
- 多地點實地測試高成本且耗時漫長
- 缺乏關於新型微生物的參考資料
- 生物檢測統計員和品質保證審核員短缺
- 監理情勢
- 技術展望
- 波特五力分析
第5章 市場規模與成長預測
- 依產品類型
- 生物農藥
- 生物肥料
- 生物促效劑
- 其他產品類型
- 透過使用
- 現場支援
- 規章
- 分析
- 其他用途
- 按作物類型
- 穀類和穀類食品
- 水果和蔬菜
- 油籽/豆類
- 其他
- 按地區
- 北美洲
- 美國
- 加拿大
- 墨西哥
- 其他北美國家
- 歐洲
- 英國
- 德國
- 法國
- 義大利
- 西班牙
- 俄羅斯
- 其他歐洲國家
- 亞太地區
- 中國
- 印度
- 日本
- 澳洲
- 其他亞太國家
- 南美洲
- 巴西
- 阿根廷
- 其他南美國家
- 中東
- 土耳其
- 沙烏地阿拉伯
- 其他中東國家
- 非洲
- 南非
- 肯亞
- 其他非洲國家
- 北美洲
第6章 競爭情勢
- 市場集中度
- 策略趨勢
- 市佔率分析
- 公司簡介
- Eurofins Scientific SE
- SGS SA
- Intertek Group plc
- Bureau Veritas SA
- ALS Limited
- Syntech Research Group
- Staphyt SA
- Anadiag Group
- i2LResearch Ltd.(Cawood Scientific Limited)
- Fera Science Ltd.(Bridgepoint Group plc)
- RJ Hill Laboratories Ltd.
- LAUS GmbH
- Bionema Ltd.
- Biotecnologie BT Srl
第7章 市場機會與未來展望
According to Mordor Intelligence, the agricultural biologicals testing market size was valued at USD 2.9 billion in 2025 and estimated to grow from USD 3.37 billion in 2026 to reach USD 7.09 billion by 2031, at a CAGR of 16.09% during the forecast period (2026-2031).
This report is Segmented by Product Type (Biopesticides, and More), Application (Field Support, and More), Crop Type (Cereals and Grains, and More), and Geography (North America, Europe, Asia-Pacific, and More). The Market Forecasts are Provided in Terms of Value (USD).
Global Agricultural Biologicals Testing Market Trends and Insights
Expansion of Organic Farming Acreage
Organic acreage continues to grow at a faster rate than conventional land, and certification bodies now require multi-season field trials, residue analytics, and soil microbiome studies before approving biological inputs. The United States National Organic Program has intensified residue surveillance, which requires laboratories to integrate advanced chromatographic and molecular workflows . Europe's organic scheme mirrors these testing demands and adds blockchain traceability, compelling labs to upgrade digital infrastructure. Field trials are conducted across diverse climatic zones to capture variability, thereby increasing testing volume over two to three harvests. Premium pricing for organic-certified products offsets the elevated testing spend, creating a durable funding loop for laboratory services. As regulators tighten organic input lists, manufacturers rely on independent Good Laboratory Practice (GLP) data to protect product positioning in lucrative organic channels.
Stringent Global Regulations Favoring Biologicals
The Environmental Protection Agency now requires molecular characterization and comprehensive toxicology for biochemical pesticides, while China's Institute for the Control of Agrochemicals, Ministry of Agriculture (ICAMA), has adopted parallel microbial registration protocols . This convergence harmonizes fundamental data packages but raises documentation thresholds, favoring large GLP-certified providers. Post-market surveillance clauses extend testing well beyond launch, creating recurring laboratory revenue. Mutual recognition of data within selected trade blocs prevents full duplication, yet still necessitates region-specific residue and environment studies. Accelerated review lanes reward dossiers that include exhaustive analytics, pushing sponsors to invest in premium lab partners from the outset. The net effect is a larger, more predictable testing pipeline anchored to long-term regulatory compliance.
Lack of Harmonized Biological Testing Guidelines
Regulatory fragmentation forces companies to repeat studies for each jurisdiction, multiplying cost and time. Disagreements over statistical endpoints and environmental safety benchmarks slow Organisation for Economic Co-operation and Development (OECD) harmonization efforts, particularly for RNA-based pesticides. Emerging markets often publish draft guidelines without enforcement clarity, deterring early testing investments. Smaller firms face disproportionate burdens, as parallel programs exhaust limited capital and personnel. Until standard terms and endpoints converge, laboratories must tailor protocols for every submission, reducing economies of scale and extending development cycles.
Other drivers and restraints analyzed in the detailed report include:
- Rising Consumer Demand for Residue-Free Food
- Accelerated Research and Development Investments by Agro-Chemical Majors
- High Cost and Duration of Multi-Location Field Trials
For complete list of drivers and restraints, kindly check the Table Of Contents.
Segment Analysis
The biopesticide segment held 43.62% agricultural biologicals testing market share in 2025, supported by mature regulatory frameworks and standardized GLP protocols. The agricultural biologicals testing market size associated with biopesticide registration is projected to keep rising through 2031 as microbial, botanical, and RNA-based products move through pipelines. Laboratories capitalize on established demand patterns, enabling predictable scheduling and utilization rates. Biofertilizers captured a 27.68% share as soil health gained global attention under EU Regulation 2019/1009. Growing clarity around biostimulant definitions propels that category to the fastest 17.15% CAGR, with test menus expanding into plant metabolomics and gene expression profiling. Labs are diversifying into these niches ahead of impending regulatory milestones that should unlock incremental volume.
Coupled with regulatory harmonization, product-type diversification buffers laboratories against cyclicality. Equipment amortization is spread across assay types, and cross-training scientists allows flexible staffing. As RNA-interference products approach launch, demand grows for molecular assays that verify mode of action and off-target effects, deepening service complexity and revenue per study.
Complete Report Scope:
- By Product Type
- Biopesticides
- Biofertilizers
- Biostimulants
- Other Product Types
- By Application
- Field Support
- Regulatory
- Analytical
- Other Applications
- By Crop Type
- Cereals and Grains
- Fruits and Vegetables
- Oilseeds and Pulses
- Others
- By Geography
- North America
- United States
- Canada
- Mexico
- Rest of North America
- Europe
- United Kingdom
- Germany
- France
- Italy
- Spain
- Russia
- Rest of Europe
- Asia-Pacific
- China
- India
- Japan
- Australia
- Rest of Asia-Pacific
- South America
- Brazil
- Argentina
- Rest of South America
- Middle East
- Turkey
- Saudi Arabia
- Rest of Middle East
- Africa
- South Africa
- Kenya
- Rest of Africa
- North America
Geography Analysis
The Asia-Pacific region is the fastest-growing, with a 16.12% CAGR through 2031, as China enforces molecular data requirements for every microbial pesticide under its Association of Southeast Asian Nations (ICAMA) rules and Japan rolls out RNA-interference test protocols that necessitate advanced molecular diagnostics. China's vast acreage generates steady demand because both domestic and multinational firms must run local trials to register new strains, while India's organic acreage is expanding more than 12% each year and drives additional efficacy studies for certification bodies. South Korea is pairing biological inputs with smart-farm sensors, so laboratories there are upgrading data platforms that plug directly into Internet of Things dashboards. Lower labor costs also enable Asian testing companies to run large, multi-location trials at prices that undercut many Western providers. A nascent Association of Southeast Asian Nations (ASEAN) harmonization effort is underway to align study templates, which is expected to reduce regulatory friction across Southeast Asia over the next few years.
North America still holds the largest revenue share, at nearly 34.68% in 2025, as more than 200 GLP-certified facilities already cover the full spectrum of biological assays. A common template adopted by the United States Environmental Protection Agency and Canada's est Management Regulatory Agency (PMRA) now saves sponsors up to 20% in duplicative study spend while keeping scientific rigor intact. Mexico's export growers are sending testing volumes up 18% annually as they pursue residue-free certificates for shipments to the United States and Europe. Artificial-intelligence tools embedded in many United States labs cut data-review time by roughly one-quarter, freeing capacity for novel microbial containment studies. The region also benefits from strong university partnerships that pilot next-generation protocols before they spread worldwide.
Europe advances as Regulation 2019/1009 delivers the world's most detailed roadmap for biostimulant testing. Germany and France account for more than 40% of regional revenue thanks to large farming sectors and strict compliance cultures. The United Kingdom's post-Brexit rules set forces dual submissions, adding roughly 10% in extra study work for products sold on both sides of the Channel. Digital product passport rules that take effect later in the decade will require blockchain-ready test files, a shift that favors labs with sophisticated data infrastructure. Green Deal incentives and specialty hubs such as the Netherlands for greenhouse crops keep the regional pipeline full even as climatic zones vary widely across the continent.
- Eurofins Scientific SE
- SGS SA
- Intertek Group plc
- Bureau Veritas SA
- ALS Limited
- Syntech Research Group
- Staphyt SA
- Anadiag Group
- i2LResearch Ltd. (Cawood Scientific Limited)
- Fera Science Ltd. (Bridgepoint Group plc)
- RJ Hill Laboratories Ltd.
- LAUS GmbH
- Bionema Ltd.
- Biotecnologie B.T. Srl
Additional Benefits:
- The market estimate (ME) sheet in Excel format
- 3 months of analyst support
TABLE OF CONTENTS
1 Introduction
- 1.1 Study Assumptions and Market Definition
- 1.2 Scope of the Study
2 Research Methodology
3 Executive Summary
4 Market Landscape
- 4.1 Market Overview
- 4.2 Market Drivers
- 4.2.1 Expansion of Organic Farming Acreage
- 4.2.2 Stringent Global Regulations Favoring Biologicals
- 4.2.3 Rising Consumer Demand for Residue-Free Food
- 4.2.4 Accelerated Research and Development Investments by Agro-Chemical Majors
- 4.2.5 Outsourcing Surge from Mid-Tier Biological Start-Ups
- 4.2.6 Digital Traceability and Crop Passport Mandates
- 4.3 Market Restraints
- 4.3.1 Lack of Harmonized Biological Testing Guidelines
- 4.3.2 High Cost and Duration of Multi-Location Field Trials
- 4.3.3 Limited Reference Material Libraries for New Microbes
- 4.3.4 Scarcity of Bioassay Statisticians and QA Auditors
- 4.4 Regulatory Landscape
- 4.5 Technological Outlook
- 4.6 Porter's Five Forces Analysis
- 4.6.1 Bargaining Power of Buyers
- 4.6.2 Bargaining Power of Suppliers
- 4.6.3 Threat of New Entrants
- 4.6.4 Threat of Substitutes
- 4.6.5 Intensity of Competitive Rivalry
5 Market Size and Growth Forecasts (Value)
- 5.1 By Product Type
- 5.1.1 Biopesticides
- 5.1.2 Biofertilizers
- 5.1.3 Biostimulants
- 5.1.4 Other Product Types
- 5.2 By Application
- 5.2.1 Field Support
- 5.2.2 Regulatory
- 5.2.3 Analytical
- 5.2.4 Other Applications
- 5.3 By Crop Type
- 5.3.1 Cereals and Grains
- 5.3.2 Fruits and Vegetables
- 5.3.3 Oilseeds and Pulses
- 5.3.4 Others
- 5.4 By Geography
- 5.4.1 North America
- 5.4.1.1 United States
- 5.4.1.2 Canada
- 5.4.1.3 Mexico
- 5.4.1.4 Rest of North America
- 5.4.2 Europe
- 5.4.2.1 United Kingdom
- 5.4.2.2 Germany
- 5.4.2.3 France
- 5.4.2.4 Italy
- 5.4.2.5 Spain
- 5.4.2.6 Russia
- 5.4.2.7 Rest of Europe
- 5.4.3 Asia-Pacific
- 5.4.3.1 China
- 5.4.3.2 India
- 5.4.3.3 Japan
- 5.4.3.4 Australia
- 5.4.3.5 Rest of Asia-Pacific
- 5.4.4 South America
- 5.4.4.1 Brazil
- 5.4.4.2 Argentina
- 5.4.4.3 Rest of South America
- 5.4.5 Middle East
- 5.4.5.1 Turkey
- 5.4.5.2 Saudi Arabia
- 5.4.5.3 Rest of Middle East
- 5.4.6 Africa
- 5.4.6.1 South Africa
- 5.4.6.2 Kenya
- 5.4.6.3 Rest of Africa
- 5.4.1 North America
6 Competitive Landscape
- 6.1 Market Concentration
- 6.2 Strategic Moves
- 6.3 Market Share Analysis
- 6.4 Company Profiles (Includes Global-level Overview, Market-level Overview, Core Segments, Financials, Strategic Information, Market Rank/Share for key companies, Products and Services, and Recent Developments)
- 6.4.1 Eurofins Scientific SE
- 6.4.2 SGS SA
- 6.4.3 Intertek Group plc
- 6.4.4 Bureau Veritas SA
- 6.4.5 ALS Limited
- 6.4.6 Syntech Research Group
- 6.4.7 Staphyt SA
- 6.4.8 Anadiag Group
- 6.4.9 i2LResearch Ltd. (Cawood Scientific Limited)
- 6.4.10 Fera Science Ltd. (Bridgepoint Group plc)
- 6.4.11 RJ Hill Laboratories Ltd.
- 6.4.12 LAUS GmbH
- 6.4.13 Bionema Ltd.
- 6.4.14 Biotecnologie B.T. Srl


