


 |
市場調查報告書
商品編碼
2114502
雲端發票:市場佔有率分析、行業趨勢和統計數據、成長預測(2026-2031 年)Cloud Billing - Market Share Analysis, Industry Trends & Statistics, Growth Forecasts (2026 - 2031) |
||||||

※ 本網頁內容可能與最新版本有所差異。詳細情況請與我們聯繫。
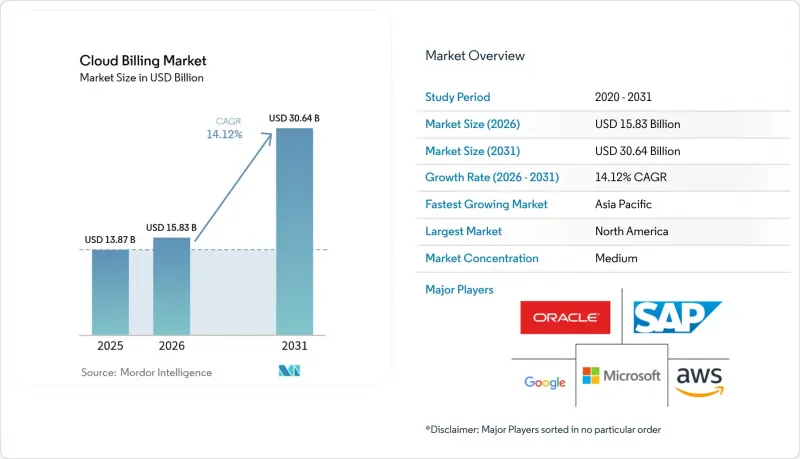
根據 Mordor Intelligence 估計,到 2026 年,雲端收費市值將達到 158.3 億美元,高於 2025 年的 138.7 億美元,預計到 2031 年將達到 306.4 億美元。
預計從 2026 年到 2031 年,其複合年成長率將達到 14.12%。
本報告按部署類型(公共雲端、私有雲端、混合雲端)、組件(平台和服務)、收費模式(訂閱、計量收費、混合)、雲端服務收費( 收費、 收費 、IaaS)、組織規模(大型企業和中小企業)、最終用戶行業(銀行、金融服務和保險等)以及地區進行細分。市場預測以美元計價。
全球雲端收費市場趨勢與洞察
加速採用多重雲端架構
隨著企業為了平衡彈性、成本和資料居住需求而分散工作負載,多重雲端策略變得越來越普遍。 Kubernetes 中主導策略的資源控制已證明,精細化的自動擴展有助於在保持管治的同時,抑制不可預測的支出。收費平台現在可以即時調整不同的價格表、貨幣和分類標準,並提供扣回爭議帳款報告,從而實現單元層級的課責。隨著超大規模資料中心業者服務商開放使用情況 API 以縮短資料擷取週期,以及企業透過供應商多元化降低單一供應商風險,雲端收費市場正在蓬勃發展。因此,市場需求正集中在能夠標準化多重雲端遙測資料並提供統一儀表板的收費引擎。
電子商務訂閱模式的擴展
訂閱式商務模式不再侷限於SaaS。零售商正在整合實體商品、內容包和混合會員模式,這些都需要複雜的每日計費、分級附加元件和週期性促銷活動。平台必須根據客戶行為調整價格,並在地化結帳流程,以符合特定國家/地區的支付方式、PSD2要求和GDPR義務。收費式商務的成長正在推動雲端收費市場的發展,其使用者群體從軟體供應商擴展到銷售實體商品的零售商。
從傳統本地部署的收費系統遷移過來所涉及的複雜性
已運行多年的本地收費系統通常包含未記錄的業務邏輯,導致資料映射和規則轉換困難。在系統遷移過程中,受監管產業的公司必須維護並行運作環境,以同時滿足 PCI-DSS、SOX 或 HIPAA 等法規要求,從而導致專案預算膨脹。這種資源負擔使得一些組織對全面遷移猶豫不決,從而減緩了雲端收費市場短期內的成長速度。
細分市場分析
隨著企業將本地資產與超大規模擴充性,混合環境的複合年成長率 (CAGR) 達到了 15.81%。企業雖然重視在不犧牲資料居住或延遲敏感型處理的情況下遷移工作負載的能力,但往往面臨成本結構分散的問題。供應商正在透過發布適配器來應對這項挑戰,這些適配器將私有雲端遙測資料與公共雲端定價表整合在一起。
由於公共雲端易於使用且擁有豐富的工具生態系統,其在收入方面保持著 66.10% 的領先優勢。然而,合規性要求、邊緣運算用例以及地緣政治因素進一步提升了混合環境中支出管治的重要性。因此,雲端計費市場正轉向整合編配引擎,以計算混合有效費率並提供跨站點差異報告。
隨著企業將藍圖制定、整合和最佳化外包,業務收益正以16.62%的複合年成長率成長。服務提供者將諮詢、實施和營運管理打包在一起,以實現快速的投資回報。雖然平台仍以60.10%的市佔率佔據主導地位,但服務主導措施正在監管嚴格的領域鞏固其地位,在這些領域,客製化的管控措施至關重要。
雲端收費市場正從中受益,因為服務專家正在將不同領域之間的細微差別轉化為基準配置,從而降低部署風險。將平台授權和生命週期服務結合的捆綁服務提高了合約續約率,並推動業務擴展到相關的成本治理模組,例如碳管治和合作夥伴結算。
區域分析
預計到2025年,北美將佔全球收入的36.80%,並將繼續受益於其集中的超大規模資料中心業者、創業投資資金和豐富的金融營運人才。該地區更青睞符合SOX等框架和州級隱私法規的供應商。人工智慧工作負載的高普及率也推動了基於代幣的收費服務的採用,並提升了對即時收費的需求。
亞太地區以16.28%的複合年成長率 (CAGR) 保持最高的成長率,這主要得益於公共部門的數位轉型、行動優先的消費群體以及政府主導的人工智慧運算舉措。印度的國家GPU計畫 (National GPU Program) 就是一個很好的例子,它展現了政府津貼如何促進雲端容量的擴展,以及如何透過可擴展的收費實現雲端容量的貨幣化。日本的Carbon Link電池網路則凸顯了該地區整合成本和環境關鍵績效指標 (KPI) 的意願。提供本地化和語言支援的供應商正在搶佔先機。
在歐洲,如何在GDPR的領導地位和新興的數位主權計劃之間取得平衡至關重要。企業尋求本地資料中心和透明的資料處理鏈,因此,能夠確保資料儲存在本地的收費平台更受青睞。鼓勵採用低碳環保的調度方式,正推動雲端收費市場向環境相關的扣回爭議帳款報告模式發展。由於各國法規分散,採購週期不斷延長,新進業者的進入門檻也日益提高,企業對能夠巧妙應對合規細微之處的供應商的忠誠度也在不斷增強。
其他好處:
- Excel格式的市場預測(ME)表
- 3個月的分析師支持
目錄
第1章:引言
- 研究假設和市場定義
- 調查範圍
第2章:調查方法
第3章執行摘要
第4章 市場狀況
- 市場概覽
- 市場促進因素
- 加速採用多重雲端
- 電子商務訂閱模式的擴展
- 對即時付費使用制的需求日益成長
- 面向 Web3 新創企業的憑證式的雲端使用模型
- 考慮碳排放意識的工作負載調度獎勵
- 整合人工智慧驅動的成本最佳化引擎
- 市場限制因素
- 從傳統本地收費系統遷移到雲端面臨許多複雜挑戰。
- 數據主權和跨境合規成本
- FinOps 工具的興起正在蠶食原生收費系統的利潤率。
- 供應商鎖定和互通性挑戰
- 產業價值鏈分析
- 監理情勢
- 技術趨勢(用於自動化發票創建的生成式人工智慧)
- 波特五力分析
- 宏觀經濟因素對市場的影響
第5章 市場規模與成長預測
- 不同的發展
- 公共雲端
- 私有雲端
- 混合雲端
- 按組件
- 平台
- 服務
- 按收費模式
- 基於訂閱
- 按使用收費模式
- 混合模式(訂閱+計量收費)
- 雲端服務模型
- SaaS收費方式
- PaaS收費結構
- IaaS收費
- 按組織規模
- 大公司
- 中小企業
- 按最終用戶行業分類
- 零售與電子商務
- BFSI
- 電訊
- 醫療保健和生命科學
- 能源公用事業
- 政府/公共部門
- 媒體與娛樂
- 其他終端用戶產業
- 按地區
- 北美洲
- 美國
- 加拿大
- 墨西哥
- 南美洲
- 巴西
- 阿根廷
- 智利
- 其他南美國家
- 歐洲
- 德國
- 英國
- 法國
- 義大利
- 西班牙
- 俄羅斯
- 其他歐洲國家
- 亞太地區
- 中國
- 印度
- 日本
- 韓國
- 新加坡
- 馬來西亞
- 澳洲
- 其他亞太國家
- 中東和非洲
- 中東
- 阿拉伯聯合大公國
- 沙烏地阿拉伯
- 土耳其
- 其他中東國家
- 非洲
- 南非
- 奈及利亞
- 埃及
- 其他非洲國家
- 中東
- 北美洲
第6章 競爭情勢
- 市場集中度
- 策略趨勢
- 市佔率分析
- 公司簡介
- Amazon Web Services(AWS)Inc.
- Microsoft Corporation(Azure)
- Google Cloud Platform
- Oracle Corporation
- SAP SE
- Salesforce Inc.(Revenue Cloud)
- Zuora Inc.
- Aria Systems Inc.
- BillingPlatform LLC
- FinancialForce LLC
- IBM Corporation
- Comarch SA
- Tencent Cloud
- Huawei Cloud
- Alibaba Cloud
- CloudBlue(An Ingram Micro Co.)
- CloudHealth(Vmware)
- Chargebee Inc.
- Recurly Inc.
- Stripe Billing
- Paddle.com Market Ltd.
- ChargeOver LLC
- Vertex Inc.
- GoCardless Ltd.
- Orb Inc.
- SaaSOptics(An Ramped Co.)
- LogiSense Corp.
- Gotransverse LLC
- Rev.io Technologies
第7章 市場機會與未來趨勢
- 評估閒置頻段和未滿足的需求
According to Mordor Intelligence, cloud billing market size in 2026 is estimated at USD 15.83 billion, growing from 2025 value of USD 13.87 billion with 2031 projections showing USD 30.64 billion, growing at 14.12% CAGR over 2026-2031.
This report is Segmented by Deployment (Public Cloud, Private Cloud, and Hybrid Cloud), Component (Platform and Services), Billing Model (Subscription-Based, Usage-Based, and Hybrid), Cloud Service Model (SaaS Billing, Paas Billing, and IaaS Billing), Organization Size (Large Enterprises and SMEs), End-User Industry (BFSI, and More), and Geography. The Market Forecasts are Provided in Terms of Value (USD).
Global Cloud Billing Market Trends and Insights
Accelerating Multi-Cloud Adoption
Multi-cloud strategies are gaining popularity as organizations distribute workloads to balance resilience, pricing, and data-residency requirements. Policy-driven resource controls inside Kubernetes have demonstrated that finely tuned autoscaling curbs unpredictable spend while maintaining governance. Billing platforms now reconcile divergent price books, currencies, and taxonomies in real time and supply chargeback reports that promote unit-level accountability. The cloud billing market gains momentum as hyperscalers publish consumption APIs that shorten data ingestion cycles and as enterprises mitigate single-vendor risk by embracing provider diversity. Demand, therefore, concentrates on billing engines that normalise multi-cloud telemetry and present unified dashboards.
Expansion of E-Commerce Subscription Models
Subscription commerce no longer applies exclusively to SaaS. Retailers integrate physical goods, content bundles, and hybrid memberships that require intricate proration, tiered add-ons, and cyclical promotions. Platforms must orchestrate price adjustments triggered by customer behaviour and localise checkout in line with country-specific payment methods, PSD2 mandates, and GDPR obligations. Growth in recurring commerce strengthens the cloud billing market by broadening the user base from software publishers to merchants that ship tangible products.
Migration Complexities from Legacy On-Premises Billing
Long-standing on-prem billing stacks often carry undocumented business logic, making data mapping and rule translation difficult. Enterprises in regulated verticals simultaneously uphold PCI-DSS, SOX, or HIPAA mandates during cut-over, obliging dual-run environments that inflate project budgets. The resource burden deters some organisations from full transition and tempers the near-term expansion pace of the cloud billing market.
Other drivers and restraints analyzed in the detailed report include:
- Rising Demand for Real-Time Usage-Based Pricing
- Token-Based Cloud Consumption Models in Web3 Startups
- Data-Sovereignty and Cross-Border Compliance Costs
For complete list of drivers and restraints, kindly check the Table Of Contents.
Segment Analysis
Hybrid environments are recording a 15.81% CAGR as organisations pair on-prem assets with hyperscale elasticity. Enterprises value the ability to shift workloads without forfeiting data residency or latency-sensitive processing, yet they often encounter fragmented cost structures. Billing vendors respond by releasing adapters that harmonise private-cloud telemetry with public-cloud rate cards.
Public deployment maintains a 66.10% revenue lead due to its simplicity and broad tooling ecosystems. Nevertheless, compliance triggers, edge use cases, and geopolitics strengthen the case for hybrid spend governance. The cloud billing market, therefore, pivots toward unified orchestration engines that calculate blended effective rates and surface variance reports across locations.
Services revenue is climbing at 16.62% CAGR as enterprises outsource roadmap planning, integration, and optimisation. Providers bundle advisory, implementation, and managed operations that target rapid payback. Platforms continue to dominate with a 60.10% share, yet service-led engagement secures footholds in regulated domains where bespoke controls are pivotal.
The cloud billing market benefits because service specialists translate domain nuances into configuration baselines that shrink deployment risk. Bundled offerings that pair platform licences with lifecycle services foster stickier contracts and unlock expansion into adjacent cost-governance modules such as carbon tracing and partner settlement.
Complete Report Scope:
- By Deployment
- Public Cloud
- Private Cloud
- Hybrid Cloud
- By Component
- Platform
- Services
- By Billing Model
- Subscription-based
- Usage-based
- Hybrid (Subscription + Usage)
- By Cloud Service Model
- SaaS Billing
- PaaS Billing
- IaaS Billing
- By Organization Size
- Large Enterprises
- Small and Medium Enterprises (SMEs)
- By End-user Industry
- Retail and E-commerce
- BFSI
- Telecommunications
- Healthcare and Life Sciences
- Energy and Utilities
- Government and Public Sector
- Media and Entertainment
- Other End-user Industries
- By Geography
- North America
- United States
- Canada
- Mexico
- South America
- Brazil
- Argentina
- Chile
- Rest of South America
- Europe
- Germany
- United Kingdom
- France
- Italy
- Spain
- Russia
- Rest of Europe
- Asia Pacific
- China
- India
- Japan
- South Korea
- Singapore
- Malaysia
- Australia
- Rest of Asia Pacific
- Middle East and Africa
- Middle East
- United Arab Emirates
- Saudi Arabia
- Turkey
- Rest of Middle East
- Africa
- South Africa
- Nigeria
- Egypt
- Rest of Africa
- Middle East
- North America
Geography Analysis
North America generated 36.80% of 2025 revenue and continues to benefit from a concentration of hyperscalers, venture funding, and FinOps talent. The region rewards vendors that comply with frameworks such as SOX and state-level privacy statutes. High usage of AI workloads also catalyzes the adoption of token-metered services, reinforcing demand for real-time rating.
The Asia-Pacific region posts the fastest growth rate of 16.28% CAGR, driven by public-sector digitization, mobile-first consumer bases, and sovereign AI computing initiatives. India's national GPU programme exemplifies how government grants catalyse cloud capacity that must be monetised through scalable billing. Japan's carbon-linked battery network highlights regional appetite for merging cost with environmental KPIs. Providers that bundle localisation and language support gain early footholds.
Europe balances GDPR leadership with emerging digital sovereignty plans. Enterprises require local data centres and transparent data-processing chains, so billing platforms that guarantee regional residency gain preference. Initiatives encouraging carbon-aware scheduling drive the cloud billing market toward environmental chargeback reports. Fragmented national rules prolong procurement cycles, yet they also amplify barriers for newcomers and solidify loyalty to vendors adept at navigating compliance nuances.
- Amazon Web Services (AWS) Inc.
- Microsoft Corporation (Azure)
- Google Cloud Platform
- Oracle Corporation
- SAP SE
- Salesforce Inc. (Revenue Cloud)
- Zuora Inc.
- Aria Systems Inc.
- BillingPlatform LLC
- FinancialForce LLC
- IBM Corporation
- Comarch SA
- Tencent Cloud
- Huawei Cloud
- Alibaba Cloud
- CloudBlue (An Ingram Micro Co.)
- CloudHealth (Vmware)
- Chargebee Inc.
- Recurly Inc.
- Stripe Billing
- Paddle.com Market Ltd.
- ChargeOver LLC
- Vertex Inc.
- GoCardless Ltd.
- Orb Inc.
- SaaSOptics (An Ramped Co.)
- LogiSense Corp.
- Gotransverse LLC
- Rev.io Technologies
Additional Benefits:
- The market estimate (ME) sheet in Excel format
- 3 months of analyst support
TABLE OF CONTENTS
1 INTRODUCTION
- 1.1 Study Assumptions and Market Definition
- 1.2 Scope of the Study
2 RESEARCH METHODOLOGY
3 EXECUTIVE SUMMARY
4 MARKET LANDSCAPE
- 4.1 Market Overview
- 4.2 Market Drivers
- 4.2.1 Accelerating multi-cloud adoption
- 4.2.2 Expansion of e-commerce subscription models
- 4.2.3 Rising demand for real-time usage-based pricing
- 4.2.4 Token-based cloud consumption models in Web3 startups
- 4.2.5 Carbon-aware workload scheduling incentives
- 4.2.6 Integration of AI-driven cost optimization engines
- 4.3 Market Restraints
- 4.3.1 Migration complexities from legacy on-prem billing
- 4.3.2 Data-sovereignty and cross-border compliance costs
- 4.3.3 Rising FinOps tooling cannibalising native billing margins
- 4.3.4 Vendor lock-in and interoperability challenges
- 4.4 Industry Value Chain Analysis
- 4.5 Regulatory Landscape
- 4.6 Technological Outlook (Generative AI for automated invoicing)
- 4.7 Porter's Five Forces Analysis
- 4.7.1 Bargaining Power of Suppliers
- 4.7.2 Bargaining Power of Buyers
- 4.7.3 Threat of New Entrants
- 4.7.4 Threat of Substitutes
- 4.7.5 Intensity of Competitive Rivalry
- 4.8 Impact of Macroeconomic Factors on the Market
5 MARKET SIZE AND GROWTH FORECASTS (VALUES)
- 5.1 By Deployment
- 5.1.1 Public Cloud
- 5.1.2 Private Cloud
- 5.1.3 Hybrid Cloud
- 5.2 By Component
- 5.2.1 Platform
- 5.2.2 Services
- 5.3 By Billing Model
- 5.3.1 Subscription-based
- 5.3.2 Usage-based
- 5.3.3 Hybrid (Subscription + Usage)
- 5.4 By Cloud Service Model
- 5.4.1 SaaS Billing
- 5.4.2 PaaS Billing
- 5.4.3 IaaS Billing
- 5.5 By Organization Size
- 5.5.1 Large Enterprises
- 5.5.2 Small and Medium Enterprises (SMEs)
- 5.6 By End-user Industry
- 5.6.1 Retail and E-commerce
- 5.6.2 BFSI
- 5.6.3 Telecommunications
- 5.6.4 Healthcare and Life Sciences
- 5.6.5 Energy and Utilities
- 5.6.6 Government and Public Sector
- 5.6.7 Media and Entertainment
- 5.6.8 Other End-user Industries
- 5.7 By Geography
- 5.7.1 North America
- 5.7.1.1 United States
- 5.7.1.2 Canada
- 5.7.1.3 Mexico
- 5.7.2 South America
- 5.7.2.1 Brazil
- 5.7.2.2 Argentina
- 5.7.2.3 Chile
- 5.7.2.4 Rest of South America
- 5.7.3 Europe
- 5.7.3.1 Germany
- 5.7.3.2 United Kingdom
- 5.7.3.3 France
- 5.7.3.4 Italy
- 5.7.3.5 Spain
- 5.7.3.6 Russia
- 5.7.3.7 Rest of Europe
- 5.7.4 Asia Pacific
- 5.7.4.1 China
- 5.7.4.2 India
- 5.7.4.3 Japan
- 5.7.4.4 South Korea
- 5.7.4.5 Singapore
- 5.7.4.6 Malaysia
- 5.7.4.7 Australia
- 5.7.4.8 Rest of Asia Pacific
- 5.7.5 Middle East and Africa
- 5.7.5.1 Middle East
- 5.7.5.1.1 United Arab Emirates
- 5.7.5.1.2 Saudi Arabia
- 5.7.5.1.3 Turkey
- 5.7.5.1.4 Rest of Middle East
- 5.7.5.2 Africa
- 5.7.5.2.1 South Africa
- 5.7.5.2.2 Nigeria
- 5.7.5.2.3 Egypt
- 5.7.5.2.4 Rest of Africa
- 5.7.5.1 Middle East
- 5.7.1 North America
6 COMPETITIVE LANDSCAPE
- 6.1 Market Concentration
- 6.2 Strategic Moves
- 6.3 Market Share Analysis
- 6.4 Company Profiles (includes Global level Overview, Market level overview, Core Segments, Financials as available, Strategic Information, Market Rank/Share for key companies, Products and Services, and Recent Developments)
- 6.4.1 Amazon Web Services (AWS) Inc.
- 6.4.2 Microsoft Corporation (Azure)
- 6.4.3 Google Cloud Platform
- 6.4.4 Oracle Corporation
- 6.4.5 SAP SE
- 6.4.6 Salesforce Inc. (Revenue Cloud)
- 6.4.7 Zuora Inc.
- 6.4.8 Aria Systems Inc.
- 6.4.9 BillingPlatform LLC
- 6.4.10 FinancialForce LLC
- 6.4.11 IBM Corporation
- 6.4.12 Comarch SA
- 6.4.13 Tencent Cloud
- 6.4.14 Huawei Cloud
- 6.4.15 Alibaba Cloud
- 6.4.16 CloudBlue (An Ingram Micro Co.)
- 6.4.17 CloudHealth (Vmware)
- 6.4.18 Chargebee Inc.
- 6.4.19 Recurly Inc.
- 6.4.20 Stripe Billing
- 6.4.21 Paddle.com Market Ltd.
- 6.4.22 ChargeOver LLC
- 6.4.23 Vertex Inc.
- 6.4.24 GoCardless Ltd.
- 6.4.25 Orb Inc.
- 6.4.26 SaaSOptics (An Ramped Co.)
- 6.4.27 LogiSense Corp.
- 6.4.28 Gotransverse LLC
- 6.4.29 Rev.io Technologies
7 MARKET OPPORTUNITIES AND FUTURE TRENDS
- 7.1 White-Space and Unmet-Need Assessment

 基於雲端的計費市場:按組件、服務模式、計費模式、部署方式、技術、組織規模、自動化程度和行業分類 - 全球市場預測(2026-2032 年)
 2026年全球服務計費市場報告
 雲端收費全球市場規模、佔有率、趨勢和成長分析報告(2026-2034)2026年全球雲端計費市場報告2026年全球電信雲端計費市場報告
 雲端收費市場分析及預測(至2035年):按類型、產品類型、服務、技術、組件、應用、部署類型、最終用戶、解決方案和模式分類
 雲端收費市場規模、佔有率和成長分析(按部署模式、收費類型、支付方式和地區分類)-2026-2033年產業預測
 全球電信雲端計費市場規模研究與預測,依應用程式、服務、部署模式、最終用戶、雲端平台、計費類型和區域預測 2025-2035
 雲端計費市場 - 全球產業規模、佔有率、趨勢、機會和預測(按部署、按計費類型、按最終用戶、按地區和競爭情況,2020-2030 年預測)