


 |
市場調查報告書
商品編碼
2114483
光學分類機:市場佔有率分析、產業趨勢與統計、成長預測(2026-2031)Optical Sorter - Market Share Analysis, Industry Trends & Statistics, Growth Forecasts (2026 - 2031) |
||||||

※ 本網頁內容可能與最新版本有所差異。詳細情況請與我們聯繫。
據 Mordor Intelligence 稱,光學分類機市場預計到 2026 年價值 37.4 億美元,高於 2025 年的 34.2 億美元,預計到 2031 年將達到 58.4 億美元。
預計 2026 年至 2031 年的複合年成長率為 9.33%。
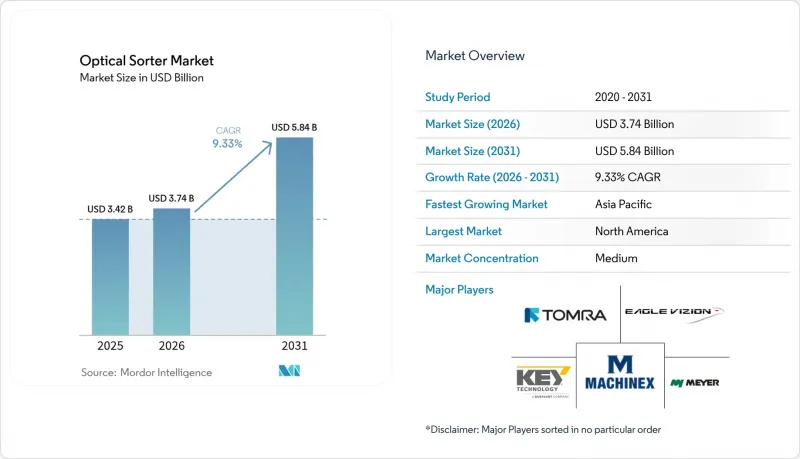
本報告按技術(X光傳輸、相機解決方案等)、終端用戶產業(食品加工、回收、採礦等)、平台(傳送帶式、自由落體式等)和地區進行細分。市場預測以貨幣價值(美元)表示。
全球光學分類機市場趨勢與洞察
北美大型食品加工廠對自動化的需求
長期勞動力短缺——截至2024年底,美國製造業仍有61.5萬個職缺——迫使加工商用高速光學分類機取代人工檢測員。這些分類機可在維持全天候運作的同時,將產品良率提高25%至35%。平台供應商目前正在整合視覺演算法,這些演算法能夠從生產波動中學習,從而在不停機的情況下保持精確度。這種優先事項的轉變也體現在資本預算中。 2021年至2024年間,美國食品製造商在自動化領域投資了550億美元,增加了對下一代皮帶分類機的投入,這些分類機的檢測精度可達99%。
全球更嚴格的HACCP法規和歐盟更嚴格的食品衛生法規。
歐盟法規2023/915明確將光學分類機列為建議的黴菌毒素和物理污染物減量措施,並要求面向歐洲市場的加工商實施經認證的系統。類似的法規正在亞洲推廣,跨國食品公司正齊心協力地投資品管。合規性審核越來越要求提交數位化缺陷日誌,這項功能已整合到人工智慧分類機中,用於記錄和儲存所有缺陷產品,以確保可追溯性。
中小規模糧食加工企業需要對高光譜遙測和X光系統進行大量資本投資。
一套完整的高光譜遙測分類機售價可能超過50萬美元,這對於中小糧食加工企業的財務狀況來說無疑是一筆不小的負擔。研究表明,初始成本是採用先進設備的最大障礙,尤其是在信貸額度緊張的情況下。由於缺乏租賃方案,許多麵粉廠仍然依賴功能較弱、僅配備攝影機的設備。
細分市場分析
就銷售收入而言,到2025年,相機系統將佔據光學分類機市場33.92%的佔有率。這主要歸功於其在基於顏色的缺陷去除方面的多功能性。受近紅外線(NIR)平台驅動的光學分類機市場預計將以11.45%的複合年成長率(CAGR)實現最高成長,因為加工商擴大利用頻譜指紋技術來區分聚合物、蛋白質和高價值礦石成分。供應商目前正在整合機器學習引擎,以將偵測精度提高到95%,並將誤剔率降低兩位數。雷射解決方案在基於形狀的識別方面仍保持著一定的市場需求,而高光譜遙測系統則瞄準了高階領域,例如開心果中的黃麴毒素檢測和寶石分選。 X光透射技術在銅礦和鋰礦中分離高密度材料方面正受到越來越多的關注,當價值回收取決於密度而非顏色時,它可以作為光學感測器的補充。
隨著原始設備製造商 (OEM) 將相機、近紅外線陣列和短波紅外線檢測器整合到單一機殼中,組合感測正逐漸成為標準配置。這種整合縮小了面積,簡化了校準,並擴展了可偵測的缺陷類型範圍。歐盟資助的研發聯盟預測,與 2023 年的基準值相比,人工智慧驅動的高光譜遙測模組將使整體良率提高 20%。隨著跨國公司尋求承包解決方案,擁有感測器間資料融合專業知識的平台供應商預計將獲得長期服務合約。
區域分析
預計到2025年,北美將佔全球銷售額的33.55%,加工商正積極採用自動化技術以應對長期存在的人手不足,並遵守《食品安全現代化法案》(FSMA)和各省級再生材料含量法規。聯邦政府津貼3,300萬美元用於智慧製造,加速了肉類、乳製品和飲料加工廠光學分類系統的維修。加拿大塑膠創新挑戰賽為一項人工智慧主導的高高光譜遙測項目提供額外資金,該項目將使回收商的軟包裝回收率翻倍。
預計到2031年,亞太地區將以12.32%的複合年成長率推動市場成長。這主要得益於中國廈門首座全自動瓦楞紙板分類廠的建設,以及日本人口結構變化帶來的不利影響,預計日本對機器人視覺系統的需求將會增加。越南引入生產者責任延伸制度(EPR)後,要求品牌商投資提高下游製程的純度,從而刺激了對PET和HDPE分揀設備的資本投資,這些設備廣泛使用光學儀器。在韓國,自2018年以來塑膠廢棄物增加了49%,並設定了70%的回收率目標,這推動了對高容量皮帶式分類平台的訂單。同時,澳洲正利用其2億澳元(1.2864億美元)的回收現代化基金,透過支持在國內組裝光學分類機來縮短供應鏈。
在歐洲,循環經濟指令和對紡織品、廢棄電子電氣設備(WEEE)及紡織包裝材料回收的補貼相結合,維持了穩定的需求。法國安德里茨公司的一條自動化生產線能夠根據纖維成分對服裝進行分揀,這表明歐盟的資金投入正從食品飲料行業擴展到新的原料領域。拉丁美洲、中東和非洲雖然仍處於發展階段,但這些市場具有重要的戰略意義。智利和辛巴威的銅礦和鋰礦正在試驗應用基於感測器的預濃縮技術,以應對礦石品位下降和水資源限制等問題。
其他好處:
- Excel格式的市場預測(ME)表
- 3個月的分析師支持
目錄
第1章:引言
- 研究假設和市場定義
- 調查範圍
第2章:調查方法
第3章執行摘要
第4章 市場狀況
- 市場概覽
- 市場促進因素
- 北美各地大型食品加工廠對高產能分類自動化的需求日益成長。
- 全球 HACCP 法規和歐盟食品衛生法規日益嚴格,推動了光學分選技術的應用。
- 人手不足和薪資上漲正在加速歐洲回收設施的自動化投資。
- 南美洲銅礦和鋰礦礦石品位的下降,促使人們在預富集過程中使用感測器。
- 強制推行生產者延伸責任制(EPR)以鼓勵亞洲地區對高純度塑膠碎片進行分類
- 人工智慧驅動的高光譜影像的突破性進展正在拓展其應用範圍,使其不再局限於顏色分類。
- 市場限制因素
- 高光譜遙測和 X光系統需要高額的資本投入,這阻礙了中小糧食加工廠採用這些系統。
- 頻繁的校準會增加連續流採礦作業的停機成本。
- 發展中地區缺乏技術嫻熟的視覺工程師
- 人們對連接雲端的分類線的資料安全問題感到擔憂
- 價值供應鏈分析
- 監理展望
- 技術展望
- 波特五力分析
第5章 市場規模與成長預測
- 透過技術
- 相機
- 雷射
- 近紅外線分類機
- 高光譜遙測相機
- X光透射法
- 按平台
- 腰帶
- 自由落體
- 車道
- 混合
- 按最終用戶行業分類
- 食品加工
- 水果和蔬菜
- 穀物和穀類
- 堅果和乾果
- 肉類和水產品
- 糖果甜點和零食
- 回收利用
- 塑膠
- 金屬
- 玻璃
- 電子廢棄物
- 礦業
- 煤炭
- 貴金屬和基底金屬
- 工業礦物
- 其他行業
- 食品加工
- 按地區
- 北美洲
- 美國
- 加拿大
- 墨西哥
- 歐洲
- 英國
- 德國
- 法國
- 義大利
- 其他歐洲國家
- 亞太地區
- 中國
- 印度
- 日本
- 韓國
- 澳洲
- 其他亞太國家
- 南美洲
- 巴西
- 阿根廷
- 其他南美國家
- 中東和非洲
- 土耳其
- 南非
- 沙烏地阿拉伯
- 其他中東和非洲國家
- 北美洲
第6章 競爭情勢
- 市場集中度
- 策略趨勢
- 市佔率分析
- 公司簡介
- TOMRA Systems ASA
- Buhler Group
- Key Technology Inc.(Duravant LLC)
- Hefei Meyer Optoelectronic Technology Inc.
- Satake Corporation
- Sesotec GmbH
- Cimbria A/S(AGCO Corporation)
- Machinex Industries Inc.
- Pellenc ST
- Eagle Vizion Inc.
- Raytec Vision SpA
- Steinert GmbH
- National Recovery Technologies Inc.
- Binder+Co AG
- Angelon Electronics Co. Ltd.
- Techik Instrument Co. Ltd.
- Hefei Baite Optoelectronic Technology Co. Ltd.
- Bhler Sortex Limited
- Bollegraaf Group
- Colour Sorting Group(CSG)
第7章 市場機會與未來展望
According to Mordor Intelligence, the optical Sorter market size in 2026 is estimated at USD 3.74 billion, growing from 2025 value of USD 3.42 billion with 2031 projections showing USD 5.84 billion, growing at 9.33% CAGR over 2026-2031.
This report is Segmented by Technology (X-Ray Transmission, Camera Solutions, and More), End-User Industry (Food Processing, Recycling, Mining, and More), Platform (Belt, Freefall, and More), and Geography. The Market Forecasts are Provided in Terms of Value (USD).
Global Optical Sorter Market Trends and Insights
Automation demand in large-scale North American food plants
Persistent staffing gaps 615,000 manufacturing jobs remained vacant in the United States at end-2024 are forcing processors to replace manual inspectors with high-speed optical sorters that sustain 24/7 uptime while securing 25-35% higher product yield. Platform vendors now bundle vision algorithms that learn from production drifts to preserve accuracy without halting the line. Capital budgets reflect this priority shift, as U.S. food manufacturers invested USD 55 billion in automation between 2021 and 2024, allocating a growing slice to next-generation belt sorters capable of achieving 99% detection precision.
Tightening global HACCP and EU food-hygiene regulations
EU Regulation 2023/915 explicitly positions optical sorter as an endorsed mitigation measure against mycotoxins and physical contaminants, compelling processors targeting the European market to adopt certified systems.Comparable rules are rippling across Asia, prompting multinational food companies to synchronize quality-control investments. Compliance audits are increasingly requesting digital defect logs, a feature integrated into AI-enabled sorters that archives every rejected item for traceability.
High CapEx for hyperspectral and X-ray systems in SME grain mills
A fully loaded hyperspectral sorter can exceed USD 500,000, a threshold that strains balance sheets of small and medium grain processors. surveys rank upfront cost as the primary barrier to advanced equipment, especially where credit lines remain tight. Without leasing schemes, many mills continue to rely on less capable camera-only machines.
Other drivers and restraints analyzed in the detailed report include:
- Labor shortages and wage inflation in European recycling
- AI-driven hyperspectral breakthroughs
- Frequent calibrations increase downtime in continuous-flow mining
For complete list of drivers and restraints, kindly check the Table Of Contents.
Segment Analysis
In revenue terms, camera systems accounted for 33.92% of the optical sorter market share in 2025, owing to their versatility in color-based defect removal. The optical sorter market size attributable to NIR platforms is on track to post the fastest 11.45% CAGR as processors utilize spectral fingerprints to distinguish polymers, proteins, and valuable ore fractions. Vendors now embed machine-learning engines that raise detection accuracy to 95%, trimming false-reject rates by double digits. Laser solutions retain niche demand for geometry-based differentiation, while hyperspectral systems target premium segments such as aflatoxin detection in pistachios or gemstone sorting. X-ray transmission is gaining traction in the separation of dense materials within copper and lithium mines, complementing optical sensors when density, rather than color, determines value recovery.
Blended sensing is becoming standard as OEMs stack cameras, NIR arrays, and short-wave infrared detectors inside the same chassis. This convergence cuts footprint, eases calibration, and broadens target defect profiles. Euro-funded R&D consortia anticipate that AI-assisted hyperspectral modules will increase overall yield by 20% compared to 2023 baselines. As multinationals demand turnkey solutions, platform suppliers that master cross-sensor data fusion stand to secure long-term service contracts.
Complete Report Scope:
- By Technology
- Cameras
- Lasers
- NIR Sorters
- Hyperspectral Cameras
- X-ray Transmission
- By Platform
- Belt
- Freefall
- Lane
- Hybrid
- By End-User Industry
- Food Processing
- Fruits and Vegetables
- Grains and Cereals
- Nuts and Dry Fruits
- Meat and Seafood
- Confectionery and Snacks
- Recycling
- Plastics
- Metals
- Glass
- E-waste
- Mining
- Coal
- Precious and Base Metals
- Industrial Minerals
- Other Industries
- Food Processing
- By Geography
- North America
- United States
- Canada
- Mexico
- Europe
- United Kingdom
- Germany
- France
- Italy
- Rest of Europe
- Asia-Pacific
- China
- India
- Japan
- South Korea
- Australia
- Rest of Asia-Pacific
- South America
- Brazil
- Argentina
- Rest of South America
- Middle East and Africa
- Turkey
- South Africa
- Saudi Arabia
- Rest of Middle East and Africa
- North America
Geography Analysis
North America commanded 33.55% of 2025 revenues as processors adopted automation to address persistent labor shortages and comply with FSMA and state-level recycled-content regulations. Federal energy grants totaling USD 33 million earmarked for smart manufacturing accelerate optical-sorting retrofits across meat, dairy, and beverage facilities. Canada's Plastics Innovation Challenges channel additional funds toward AI-led hyperspectral projects, enabling recyclers to double the recovery of flexible packaging.
The Asia-Pacific region is forecast to lead with a 12.32% CAGR to 2031, driven by China's first fully automated carton-sorting plant in Xiamen and Japan's demographic headwinds, which are expected to boost demand for robotic vision systems. Vietnam's EPR rollout mandates brands to finance downstream purity improvements, mobilizing capex for optics-rich PET and HDPE sorting. South Korea's 49% increase in plastic waste since 2018, along with a 70% recycling rate goal, bolsters orders for high-throughput belt platforms. Meanwhile, Australia leverages its AUD 200 million (USD 128.64 million) Recycling Modernisation Fund to support local optical-sorter assembly, thereby shortening supply chains.
Europe sustains steady demand by coupling circular-economy directives with subsidies for textile, WEEE, and fiber-based packaging recovery. ANDRITZ's automated line in France that classifies garments by fiber composition illustrates how EU funding expands beyond food and beverage into new feedstocks. Latin America and Middle East & Africa remain nascent but strategic, with copper and lithium mines in Chile and Zimbabwe piloting sensor-based pre-concentration to offset declining ore grades and constrained water resources.
- TOMRA Systems ASA
- Buhler Group
- Key Technology Inc. (Duravant LLC)
- Hefei Meyer Optoelectronic Technology Inc.
- Satake Corporation
- Sesotec GmbH
- Cimbria A/S (AGCO Corporation)
- Machinex Industries Inc.
- Pellenc ST
- Eagle Vizion Inc.
- Raytec Vision S.p.A
- Steinert GmbH
- National Recovery Technologies Inc.
- Binder+Co AG
- Angelon Electronics Co. Ltd.
- Techik Instrument Co. Ltd.
- Hefei Baite Optoelectronic Technology Co. Ltd.
- Bhler Sortex Limited
- Bollegraaf Group
- Colour Sorting Group (CSG)
Additional Benefits:
- The market estimate (ME) sheet in Excel format
- 3 months of analyst support
TABLE OF CONTENTS
1 INTRODUCTION
- 1.1 Study Assumptions and Market Definition
- 1.2 Scope of the Study
2 RESEARCH METHODOLOGY
3 EXECUTIVE SUMMARY
4 MARKET LANDSCAPE
- 4.1 Market Overview
- 4.2 Market Drivers
- 4.2.1 Automation Demand for High-Throughput Sorting in Large-Scale Food Processing Plants Across North America
- 4.2.2 Tightening Global HACCP and EU Food-Hygiene Regulations Elevating Adoption of Optical Sorting
- 4.2.3 Labor Shortages and Wage Inflation Accelerating Automation Investments in European Recycling Facilities
- 4.2.4 Declining Ore Grades in Copper and Lithium Mines Triggering Sensor-Based Pre-Concentration in South America
- 4.2.5 Extended Producer Responsibility (EPR) Mandates Boosting High-Purity Plastic Flake Sorting in Asia
- 4.2.6 AI-Driven Hyperspectral Imaging Breakthroughs Expanding Addressable Use-Cases Beyond Color Sorting
- 4.3 Market Restraints
- 4.3.1 High CapEx for Hyperspectral and X-ray Systems Limiting Penetration in SME Grain Mills
- 4.3.2 Frequent Calibrations Elevate Downtime Cost in Continuous-Flow Mining Operations
- 4.3.3 Limited Availability of Skilled Vision Engineers in Developing Regions
- 4.3.4 Data Security Concerns Around Cloud-Connected Sorting Lines
- 4.4 Value / Supply-Chain Analysis
- 4.5 Regulatory Outlook
- 4.6 Technological Outlook
- 4.7 Porter's Five Forces Analysis
- 4.7.1 Bargaining Power of Suppliers
- 4.7.2 Bargaining Power of Buyers
- 4.7.3 Threat of New Entrants
- 4.7.4 Threat of Substitutes
- 4.7.5 Intensity of Competitive Rivalry
5 MARKET SIZE AND GROWTH FORECASTS (VALUE)
- 5.1 By Technology
- 5.1.1 Cameras
- 5.1.2 Lasers
- 5.1.3 NIR Sorters
- 5.1.4 Hyperspectral Cameras
- 5.1.5 X-ray Transmission
- 5.2 By Platform
- 5.2.1 Belt
- 5.2.2 Freefall
- 5.2.3 Lane
- 5.2.4 Hybrid
- 5.3 By End-User Industry
- 5.3.1 Food Processing
- 5.3.1.1 Fruits and Vegetables
- 5.3.1.2 Grains and Cereals
- 5.3.1.3 Nuts and Dry Fruits
- 5.3.1.4 Meat and Seafood
- 5.3.1.5 Confectionery and Snacks
- 5.3.2 Recycling
- 5.3.2.1 Plastics
- 5.3.2.2 Metals
- 5.3.2.3 Glass
- 5.3.2.4 E-waste
- 5.3.3 Mining
- 5.3.3.1 Coal
- 5.3.3.2 Precious and Base Metals
- 5.3.3.3 Industrial Minerals
- 5.3.4 Other Industries
- 5.3.1 Food Processing
- 5.4 By Geography
- 5.4.1 North America
- 5.4.1.1 United States
- 5.4.1.2 Canada
- 5.4.1.3 Mexico
- 5.4.2 Europe
- 5.4.2.1 United Kingdom
- 5.4.2.2 Germany
- 5.4.2.3 France
- 5.4.2.4 Italy
- 5.4.2.5 Rest of Europe
- 5.4.3 Asia-Pacific
- 5.4.3.1 China
- 5.4.3.2 India
- 5.4.3.3 Japan
- 5.4.3.4 South Korea
- 5.4.3.5 Australia
- 5.4.3.6 Rest of Asia-Pacific
- 5.4.4 South America
- 5.4.4.1 Brazil
- 5.4.4.2 Argentina
- 5.4.4.3 Rest of South America
- 5.4.5 Middle East and Africa
- 5.4.5.1 Turkey
- 5.4.5.2 South Africa
- 5.4.5.3 Saudi Arabia
- 5.4.5.4 Rest of Middle East and Africa
- 5.4.1 North America
6 COMPETITIVE LANDSCAPE
- 6.1 Market Concentration
- 6.2 Strategic Moves
- 6.3 Market Share Analysis
- 6.4 Company Profiles (includes Global level Overview, Market level overview, Core Segments, Financials as available, Strategic Information, Market Rank/Share for key companies, Products and Services, and Recent Developments)
- 6.4.1 TOMRA Systems ASA
- 6.4.2 Buhler Group
- 6.4.3 Key Technology Inc. (Duravant LLC)
- 6.4.4 Hefei Meyer Optoelectronic Technology Inc.
- 6.4.5 Satake Corporation
- 6.4.6 Sesotec GmbH
- 6.4.7 Cimbria A/S (AGCO Corporation)
- 6.4.8 Machinex Industries Inc.
- 6.4.9 Pellenc ST
- 6.4.10 Eagle Vizion Inc.
- 6.4.11 Raytec Vision S.p.A
- 6.4.12 Steinert GmbH
- 6.4.13 National Recovery Technologies Inc.
- 6.4.14 Binder+Co AG
- 6.4.15 Angelon Electronics Co. Ltd.
- 6.4.16 Techik Instrument Co. Ltd.
- 6.4.17 Hefei Baite Optoelectronic Technology Co. Ltd.
- 6.4.18 Bhler Sortex Limited
- 6.4.19 Bollegraaf Group
- 6.4.20 Colour Sorting Group (CSG)
7 MARKET OPPORTUNITIES AND FUTURE OUTLOOK
- 7.1 White-Space and Unmet-Need Assessment

 光學分類機:全球市場
 光學分類機市場:2026-2032年全球市場預測(分類機類型、組件、自動化程度、分選目的及應用分類)
 光學分類機市場分析及預測至 2035 年:按類型、產品、技術、組件、應用、材料類型、最終用戶和功能分類。
 全球光學分類機市場按產品、類型、平台和應用分類-預測至2032年
 2026年全球光學分類機市場報告
 光學分類機市場 - 全球產業規模、佔有率、趨勢、機會及預測(按平台、類型、應用、地區和競爭格局分類,2021-2031年)
 光學分選機市場規模、佔有率、成長及全球產業分析:按類型、最終用戶和地區劃分的洞察與預測(2026-2034)
 光學分類機市場規模、佔有率及成長分析(按類型、平台、應用及地區分類)-2026-2033年產業預測
 廢棄物回收光學分類機市場規模、佔有率及成長分析(按類型、技術及地區分類)-產業預測(2026-2033)
 光學分類機市場規模、佔有率和趨勢分析報告:按類型、平台、應用、地區和細分市場預測(2025-2033 年)