


 |
市場調查報告書
商品編碼
2114451
行動邊緣運算:市場佔有率分析、產業趨勢與統計及成長預測(2026-2031)Mobile Edge Computing - Market Share Analysis, Industry Trends & Statistics, Growth Forecasts (2026 - 2031) |
||||||

※ 本網頁內容可能與最新版本有所差異。詳細情況請與我們聯繫。
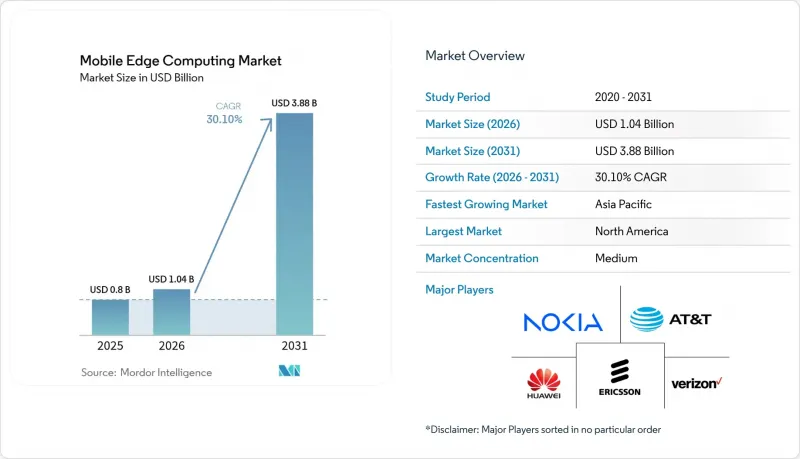
據 Mordor Intelligence 稱,2025 年行動邊緣運算市場價值為 8 億美元,預計到 2031 年將達到 38.8 億美元,而 2026 年為 10.4 億美元,預測期內(2026-2031 年)的複合年成長率預計為 30.10%。
本報告按組件(硬體、軟體、服務)、最終用戶(銀行和金融服務、零售、醫療保健和生命科學、工業製造等)以及地區(北美、南美、歐洲、亞太、中東和非洲)進行細分。市場預測以美元計價。
全球行動邊緣運算市場趨勢與洞察
在亞洲,對延遲敏感的消費性應用(AR/VR 遊戲、直播)正在蓬勃發展。
AR/VR遊戲和直播對往返延遲的要求低於20毫秒,持續改變網路設計。愛立信的概念驗證表明,將遊戲伺服器遷移到邊緣節點可以將傳輸延遲降低75%,即使在無線訊號不穩定的環境中也能實現流暢的遊戲體驗。在韓國,行動遊戲收入預計在2024年將超過56億美元,電信公司已經在人口密集的城市地區附近部署多接入邊緣運算(MEC)叢集,並為對延遲敏感的遊戲提供高級訂閱套餐。內容提供者受益於用戶留存率和收入的提升,而電信公司則透過差異化的用戶體驗品質(QoE)來實現獲利。隨著5G SA覆蓋範圍的擴大和設備的普及,日本、中國和美國部分市場也出現了類似的趨勢。
5G 獨立組網 (SA) 在北美的快速部署,使得 MEC 的商業化成為可能。
截至2024年中期,已有29個國家的49家業者推出了5G獨立組網(SA),但北美業者在全國覆蓋範圍方面處於領先地位。 T-Mobile的全面SA部署實現了針對邊緣工作負載客製化的確定性網路切片,為企業應用的新服務等級協定(SLA)奠定了基礎。 Verizon的目標是將邊緣延遲降低到10毫秒以下,以支援虛擬實境(VR)、自動駕駛和即時分析。計量收費的網路API(包括按需品質和基於位置的運算)帶來了商機。與超大規模資料中心業者的整合可以加速應用部署,並縮短開發人員的產品上市時間。
缺乏全球統一的多接入邊緣環境安全性和可靠性框架。
在邊緣基礎設施中,工作負載、資料和編配跨越數千個無人值守節點,從而擴大了攻擊面。學術研究表明,針對快取內容和編配API 的 DDoS 攻擊和橫向機芯威脅激增。受監管行業在零信任參考模型、安全飛地支援和聯合身分標準成熟之前,對遷移敏感工作負載持謹慎態度。 ETSI MEC工作小組正在製定跨域信任規範,但預計需要數年時間才能達成完全一致,這將延長整合週期並增加跨國部署的合規成本。
細分市場分析
2025年,硬體部分在行動邊緣運算市場收入中佔比60.60%,主要得益於對伺服器、環境適應性機殼和專用網路卡的投資。然而,軟體部分預計將在2026年至2031年間以36.2%的複合年成長率成長,顯著高於行動邊緣運算市場的整體成長率,這主要歸功於編配、CI/CD流水線和AI框架實現了靈活的部署模式。邊緣編配套件現在結合了服務網格和策略引擎,可以將網路切片轉換為運算和儲存資源,使營運商能夠在數小時內而非數月內推出新服務。
到 2025 年,軟體定義能力預計將融合人工智慧驅動的資源調度器、預測性維護和零接觸配置。 Akamai 採用 WebAssembly 並結合 Fermyon,打造了一個輕量級執行環境,將冷啟動延遲降低到 10 毫秒以下,這對於互動式工作負載至關重要。因此,超大規模資料中心業者和電信營運商正在將研發預算轉向平台軟體,同時繼續每四到五年升級一次邊緣硬體。隨著企業將複雜營運外包,對服務、諮詢、整合和託管營運的需求也不斷成長。尤其值得一提的是,營運混合私有和公共邊緣環境的醫療保健和製造業客戶對多供應商藍圖的需求日益成長。
區域分析
預計到2025年,北美將佔據行動邊緣運算市場40.80%的收入佔有率,這主要得益於覆蓋全國的5G SA連接、高密度光纖骨幹網路以及強大的超大規模資料中心業者營運商。 AWS Wavelength Zones和Microsoft Azure Edge Zones已部署在40多個大都會圈,為開發者提供低於20毫秒的往返延遲,適用於消費和工業應用。隨著監管機構對雲端市場集中度的審查日益嚴格,電信業者正在尋求供應商多元化,並積極與基礎設施公司和半導體供應商建立合作關係。
亞太地區預計將成為成長最快的地區,2026年至2031年的複合年成長率將達到35.4%,這主要得益於數十億美元的智慧城市投資、強大的製造地以及全球最高的行動遊戲消費。中國移動和華為的試點計畫展示了在全國部署邊緣運算技術,支援高速鐵路的擴增實境(AR)維護工作。日本電信公司正與遊戲主機製造商合作,實現無需下載即可在線暢玩3A級遊戲大作;而印度的Jio公司正在整合回程傳輸計算(MEC)技術,以擴大農村地區的網路覆蓋範圍,同時緩解回程堵塞。
在歐洲,工業應用、隱私和資料本地化是關鍵優先事項。 ETSI 的 MEC 標準確保了服務的跨境可移植性,而沃達豐承諾到 2030 年在其 30% 的基地台部署開放式無線存取網 (Open RAN),凸顯了該地區對供應鏈韌性的重視。在中東,諸如 NEOM 等融合了認知邊緣基礎設施的千兆專案正在進行中;而在非洲和南美洲,MEC 正在被實施,以降低遠距數位學習、遠端醫療和採礦作業中的延遲。
其他好處:
- Excel格式的市場預測(ME)表
- 3個月的分析師支持
目錄
第1章:引言
- 研究假設和市場定義
- 調查範圍
第2章:調查方法
第3章執行摘要
第4章 市場狀況
- 市場概覽
- 市場促進因素
- 在亞洲,對延遲敏感的消費性應用(AR/VR 遊戲、直播)正在蓬勃發展。
- 北美地區 5G 獨立組網的快速部署,使得 MEC 的商業化成為可能。
- 電信業者部署解耦式開放式無線存取網 (Open RAN) 正在推動歐洲對本地邊緣運算的需求。
- 製造地工業時間敏感型網路標準要求(IEC/IEEE 60802)
- 政府主導的智慧城市大型企劃,包括MEC(例如沙烏地阿拉伯的NEOM)
- 邊緣人工智慧推理降低了超大規模資料中心業者雲端營運商的雲端出口成本。
- 市場限制因素
- 缺乏全球統一的多接入邊緣安全與信任框架
- 熱帶和沙漠氣候下耐環境影響的微型資料中心硬體短缺。
- 二三級行動電信商邊緣編配平台整體擁有成本 (TCO) 較高
- 缺乏精通 MEC 的 DevOps 人員,導致從 PoC 到生產環境的過渡被延緩。
- 技術展望
- 波特五力分析
- 投資分析
- 宏觀經濟因素對市場的影響
第5章 市場規模與成長預測
- 按組件
- 硬體
- 軟體
- 服務
- 最終用戶
- 銀行和金融服務
- 零售
- 醫療保健和生命科學
- 工業製造
- 能源公用事業
- 電訊
- 其他最終用戶
- 按地區
- 北美洲
- 美國
- 加拿大
- 墨西哥
- 南美洲
- 巴西
- 阿根廷
- 智利
- 秘魯
- 其他南美國家
- 歐洲
- 德國
- 英國
- 法國
- 義大利
- 西班牙
- 其他歐洲國家
- 亞太地區
- 中國
- 日本
- 韓國
- 印度
- 澳洲
- 紐西蘭
- 其他亞太國家
- 中東和非洲
- 中東
- 阿拉伯聯合大公國
- 沙烏地阿拉伯
- 其他中東國家
- 非洲
- 南非
- 奈及利亞
- 其他非洲國家
- 中東
- 北美洲
第6章 競爭情勢
- Strategic Developments
- Vendor Positioning Analysis
- 公司簡介
- Huawei Technologies Co. Ltd.
- Nokia Corporation
- Telefonaktiebolaget LM Ericsson
- AT&T Inc.
- Verizon Communications Inc.
- Amazon Web Services Inc.
- Microsoft Corp.(Azure Edge Zones)
- Google LLC(Google Distributed Cloud Edge)
- Cisco Systems Inc.
- Hewlett Packard Enterprise Co.
- IBM Corp.
- ZTE Corp.
- EdgeConneX Inc.
- Cloudflare Inc.
- Fermyon Technologies
- Saguna Networks Ltd.
- ADLINK Technology Inc.
- ADVA Optical Networking SE
- Akamai Technologies
- CoreSite
第7章 市場機會與未來展望
According to Mordor Intelligence, the mobile edge computing market size was valued at USD 0.80 billion in 2025 and estimated to grow from USD 1.04 billion in 2026 to reach USD 3.88 billion by 2031, at a CAGR of 30.10% during the forecast period (2026-2031).
This report is Segmented by Component (Hardware, Software, and Services), End-User (Banking and Financial Services, Retail, Healthcare and Life Sciences, Industrial Manufacturing, and More), and Geography (North America, South America, Europe, Asia-Pacific, and Middle East and Africa). The Market Forecasts are Provided in Terms of Value (USD).
Global Mobile Edge Computing Market Trends and Insights
Latency-critical consumer apps (AR/VR gaming, livestreaming) gaining traction in Asia
AR/VR gaming and livestreaming continue to reshape network design by demanding sub-20 millisecond round-trip latency. Ericsson's trials demonstrate that relocating game servers to edge nodes can reduce transport latency by 75%, enabling sustained fluid gameplay under fluctuating radio conditions. Telecom operators in South Korea, where mobile gaming revenue exceeded USD 5.6 billion in 2024, have already deployed multi-access edge computing clusters near dense urban zones, enabling premium subscription tiers for latency-sensitive titles. Content providers benefit from higher retention and revenue per user, while operators monetize the differentiated quality of experience. Similar patterns are emerging in Japan, China, and select U.S. markets as 5G SA coverage expands and device adoption grows.
Rapid 5G standalone roll-outs unlocking MEC monetization in North America
Forty-nine operators in 29 countries had launched 5G SA by mid-2024, but North American carriers lead in national coverage. T-Mobile's full-scale SA deployment permits deterministic network slicing aligned with edge workloads and underpins new service-level agreements for enterprise applications. Verizon targets sub-10 millisecond edge latency to enable VR, autonomous mobility, and real-time analytics. Revenue opportunities stem from pay-as-you-go exposure of network APIs, including quality-on-demand and location-based compute. Collaboration with hyperscalers accelerates application onboarding and shortens time-to-market for developers.
Absence of globally harmonized security & trust framework for multi-access edge
Edge infrastructure widens the attack surface because workloads, data, and orchestration span thousands of unattended nodes. Academic studies show a surge in DDoS and lateral-movement threats targeting cached content and orchestration APIs. Regulated sectors hesitate to migrate sensitive workloads until zero-trust reference models, secure enclave support, and federated identity standards mature. ETSI MEC working groups are drafting inter-domain trust specifications, yet full consensus remains years away, prolonging integration cycles and increasing compliance costs for multinational deployments.
Other drivers and restraints analyzed in the detailed report include:
- Telco adoption of disaggregated Open RAN driving on-prem edge demand in Europe
- Industrial Time-Sensitive Networking mandates (IEC/IEEE 60802) in manufacturing hubs
- Scarcity of ruggedized micro-data-center hardware in extreme climates
For complete list of drivers and restraints, kindly check the Table Of Contents.
Segment Analysis
In 2025 the hardware segment accounted for 60.60% of mobile edge computing market revenue, anchored by investments in servers, rugged enclosures, and specialized network interface cards. Nevertheless, software is projected to grow at a 36.2% CAGR between 2026 and 2031, significantly outpacing the overall mobile edge computing market growth rate, as orchestration, CI/CD pipelines, and AI frameworks enable flexible deployment models. Edge orchestration suites now combine service meshes with policy engines that translate network slices into compute and storage reservations, enabling operators to launch new services in hours instead of months.
By 2025, software-defined functions will embed AI-powered resource schedulers, predictive maintenance, and zero-touch provisioning. Akamai's adoption of WebAssembly, alongside Fermyon, exemplifies lighter-weight execution that trims cold-start latency to sub-10 milliseconds, a prerequisite for interactive workloads. Consequently, hyperscalers and telcos are shifting their R&D budgets toward platform software, even as they continue to refresh edge hardware every four to five years. Services, consulting, integration, and managed operations are catching up as enterprises outsource complexity. The demand for multi-vendor blueprints is particularly high among healthcare and manufacturing clients that operate hybrid private/public edge footprints.
Complete Report Scope:
- By Component
- Hardware
- Software
- Services
- By End-user
- Banking and Financial Services
- Retail
- Healthcare and Life Sciences
- Industrial Manufacturing
- Energy and Utilities
- Telecommunications
- Other End-users
- By Geography
- North America
- United States
- Canada
- Mexico
- South America
- Brazil
- Argentina
- Chile
- Peru
- Rest of South America
- Europe
- Germany
- United Kingdom
- France
- Italy
- Spain
- Rest of Europe
- Asia-Pacific
- China
- Japan
- South Korea
- India
- Australia
- New Zealand
- Rest of Asia-Pacific
- Middle East and Africa
- Middle East
- United Arab Emirates
- Saudi Arabia
- Rest of Middle East
- Africa
- South Africa
- Nigeria
- Rest of Africa
- Middle East
- North America
Geography Analysis
North America generated 40.80% of mobile edge computing market revenue in 2025, leveraged by nationwide 5G SA connectivity, dense fiber backbones, and strong hyperscaler presence. AWS Wavelength Zones and Microsoft Azure Edge Zones have been deployed in more than 40 metropolitan areas, offering developers sub-20 millisecond round-trip latency for consumer and industrial apps . Regulatory scrutiny of cloud concentration prompts carriers to diversify suppliers, spurring collaborative ventures with infrastructure companies and semiconductor vendors.
Asia-Pacific is expected to register the fastest growth, at a 35.4% CAGR during 2026-2031, driven by multi-billion-dollar smart-city investments, robust manufacturing bases, and the world's highest mobile-gaming spending. China Mobile's trials with Huawei illustrate nation-scale edge roll-outs supporting AR-assisted maintenance on high-speed rail. Japan's telcos partner with console publishers to stream AAA titles without downloads, whereas India's Jio integrates MEC to reduce backhaul congestion while expanding rural coverage.
Europe emphasizes industrial applications, privacy, and data localization. ETSI's MEC standards assure cross-border service portability, and Vodafone's commitment to deploy Open RAN across 30% of masts by 2030 underscores the region's focus on supply-chain resilience. The Middle East advances giga-projects such as NEOM that embed cognitive edge infrastructure, while Africa and South America adopt MEC to alleviate latency for e-learning, telemedicine, and mining operations in remote zones.
- Huawei Technologies Co. Ltd.
- Nokia Corporation
- Telefonaktiebolaget LM Ericsson
- AT&T Inc.
- Verizon Communications Inc.
- Amazon Web Services Inc.
- Microsoft Corp. (Azure Edge Zones)
- Google LLC (Google Distributed Cloud Edge)
- Cisco Systems Inc.
- Hewlett Packard Enterprise Co.
- IBM Corp.
- ZTE Corp.
- EdgeConneX Inc.
- Cloudflare Inc.
- Fermyon Technologies
- Saguna Networks Ltd.
- ADLINK Technology Inc.
- ADVA Optical Networking SE
- Akamai Technologies
- CoreSite
Additional Benefits:
- The market estimate (ME) sheet in Excel format
- 3 months of analyst support
TABLE OF CONTENTS
1 INTRODUCTION
- 1.1 Study Assumptions and Market Definition
- 1.2 Scope of the Study
2 RESEARCH METHODOLOGY
3 EXECUTIVE SUMMARY
4 MARKET LANDSCAPE
- 4.1 Market Overview
- 4.2 Market Drivers
- 4.2.1 Latency-critical consumer apps (AR/VR gaming, livestreaming) gaining traction in Asia
- 4.2.2 Rapid 5G standalone roll-outs unlocking MEC monetisation in North America
- 4.2.3 Telco adoption of disaggregated Open RAN driving on-prem edge demand in Europe
- 4.2.4 Industrial time-sensitive networking mandates (IEC/IEEE 60802) in manufacturing hubs
- 4.2.5 Government smart-city megaprojects (e.g., NEOM, Saudi Arabia) embedding MEC
- 4.2.6 AI-inferencing at the edge lowering cloud egress costs for hyperscalers
- 4.3 Market Restraints
- 4.3.1 Absence of globally harmonised security & trust framework for multi-access edge
- 4.3.2 Scarcity of ruggedised micro-data-centre hardware in tropical & desert climates
- 4.3.3 High TCO of edge orchestration platforms for Tier-2/3 mobile operators
- 4.3.4 Shortage of MEC-skilled DevOps talent delaying PoC-to-production conversions
- 4.4 Technological Outlook
- 4.5 Porter's Five Forces Analysis
- 4.5.1 Bargaining Power of Suppliers
- 4.5.2 Bargaining Power of Buyers
- 4.5.3 Threat of New Entrants
- 4.5.4 Threat of Substitutes
- 4.5.5 Intensity of Competitive Rivalry
- 4.6 Investment Analysis
- 4.7 Impact of Macroeconomic Factors on the Market
5 MARKET SIZE AND GROWTH FORECASTS (VALUE)
- 5.1 By Component
- 5.1.1 Hardware
- 5.1.2 Software
- 5.1.3 Services
- 5.2 By End-user
- 5.2.1 Banking and Financial Services
- 5.2.2 Retail
- 5.2.3 Healthcare and Life Sciences
- 5.2.4 Industrial Manufacturing
- 5.2.5 Energy and Utilities
- 5.2.6 Telecommunications
- 5.2.7 Other End-users
- 5.3 By Geography
- 5.3.1 North America
- 5.3.1.1 United States
- 5.3.1.2 Canada
- 5.3.1.3 Mexico
- 5.3.2 South America
- 5.3.2.1 Brazil
- 5.3.2.2 Argentina
- 5.3.2.3 Chile
- 5.3.2.4 Peru
- 5.3.2.5 Rest of South America
- 5.3.3 Europe
- 5.3.3.1 Germany
- 5.3.3.2 United Kingdom
- 5.3.3.3 France
- 5.3.3.4 Italy
- 5.3.3.5 Spain
- 5.3.3.6 Rest of Europe
- 5.3.4 Asia-Pacific
- 5.3.4.1 China
- 5.3.4.2 Japan
- 5.3.4.3 South Korea
- 5.3.4.4 India
- 5.3.4.5 Australia
- 5.3.4.6 New Zealand
- 5.3.4.7 Rest of Asia-Pacific
- 5.3.5 Middle East and Africa
- 5.3.5.1 Middle East
- 5.3.5.1.1 United Arab Emirates
- 5.3.5.1.2 Saudi Arabia
- 5.3.5.1.3 Rest of Middle East
- 5.3.5.2 Africa
- 5.3.5.2.1 South Africa
- 5.3.5.2.2 Nigeria
- 5.3.5.2.3 Rest of Africa
- 5.3.5.1 Middle East
- 5.3.1 North America
6 COMPETITIVE LANDSCAPE
- 6.1 Strategic Developments
- 6.2 Vendor Positioning Analysis
- 6.3 Company Profiles (includes Global level Overview, Market level overview, Core Segments, Financials as available, Strategic Information, Products & Services, and Recent Developments)
- 6.3.1 Huawei Technologies Co. Ltd.
- 6.3.2 Nokia Corporation
- 6.3.3 Telefonaktiebolaget LM Ericsson
- 6.3.4 AT&T Inc.
- 6.3.5 Verizon Communications Inc.
- 6.3.6 Amazon Web Services Inc.
- 6.3.7 Microsoft Corp. (Azure Edge Zones)
- 6.3.8 Google LLC (Google Distributed Cloud Edge)
- 6.3.9 Cisco Systems Inc.
- 6.3.10 Hewlett Packard Enterprise Co.
- 6.3.11 IBM Corp.
- 6.3.12 ZTE Corp.
- 6.3.13 EdgeConneX Inc.
- 6.3.14 Cloudflare Inc.
- 6.3.15 Fermyon Technologies
- 6.3.16 Saguna Networks Ltd.
- 6.3.17 ADLINK Technology Inc.
- 6.3.18 ADVA Optical Networking SE
- 6.3.19 Akamai Technologies
- 6.3.20 CoreSite
7 MARKET OPPORTUNITIES AND FUTURE OUTLOOK
- 7.1 White-space and Unmet-Need Assessment

 全球行動邊緣運算市場規模、佔有率、趨勢和成長分析報告(2026-2034)
 行動邊緣運算市場:按組件、網路類型、邊緣位置、應用程式、最終用戶和企業規模分類-2026-2032年全球市場預測
 行動邊緣運算市場預測至2034年-按組件、部署模式、企業規模、應用、最終用戶和地區分類的全球分析
 行動邊緣運算(MEC) 市場規模、佔有率和成長分析:按組件類型、部署模式、應用、最終用戶產業、銷售管道和地區分類-2026-2033 年產業預測
 行動邊緣運算市場報告:按組件、組織規模、應用和地區分類(2026-2034 年)企業行動雲端運算市場:依服務模式、企業規模、裝置類型、產業、部署模式分類,全球預測(2026-2032年)
 行動邊緣運算市場 - 全球產業規模、佔有率、趨勢、機會及預測(按組件、應用、組織規模、技術、垂直產業、地區和競爭格局分類),2021-2031年
 行動邊緣運算(MEC) 全球市場規模、佔有率和趨勢分析:按公司規模、組件、應用程式、區域、前景和預測,2024-2031 年