


 |
市場調查報告書
商品編碼
2114285
液態氮:市場佔有率分析、產業趨勢與統計、成長預測(2026-2031)Liquid Nitrogen - Market Share Analysis, Industry Trends & Statistics, Growth Forecasts (2026 - 2031) |
||||||

※ 本網頁內容可能與最新版本有所差異。詳細情況請與我們聯繫。
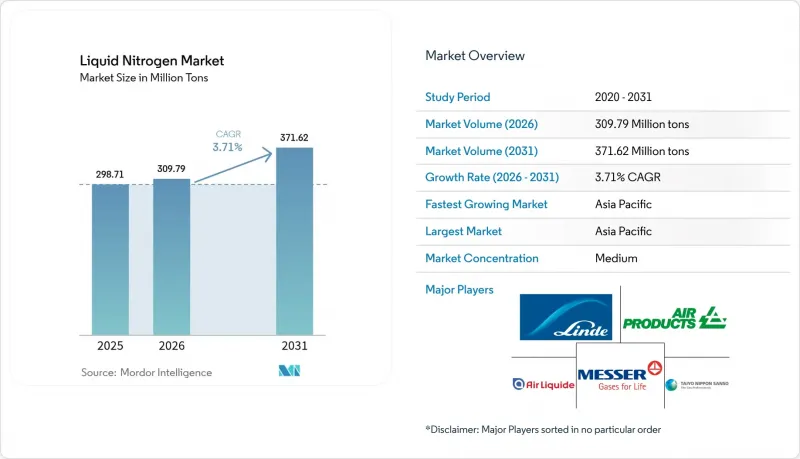
據 Mordor Intelligence 稱,液態氮市場預計到 2026 年將達到 3.0979 億噸,高於 2025 年的 2.9871 億噸,預計到 2031 年將達到 3.7162 億噸。
預計從 2026 年到 2031 年,其複合年成長率將達到 3.71%。
本報告按儲存形式(鋼瓶和包裝氣體)、應用領域(冷卻劑和冷媒)、終端用戶產業(化學和製藥、交通運輸、食品飲料、電子和半導體以及其他終端用戶產業)和地區(亞太地區、北美、歐洲、南美以及中東和非洲)進行細分。市場預測以噸為單位。
全球液態氮市場趨勢及洞察
化學和製藥業的需求增加
液態氮是惰性氣氛、快速結晶和無水加工的基礎,而這些正是現代藥物活性成分品質的關鍵。連續生產線需要瞬時溫度變化,而液態氮能夠在不造成化學污染的情況下提供這種溫度變化。監管機構對連續製程的鼓勵正在加速其應用,因為企業可以利用液態氮來降低規模化生產過程中的風險。製藥廠集中的需求促使企業建造專用管道,從而降低運輸成本並加強供應商與客戶之間的夥伴關係。亞太地區特種化學品生產的擴張也使這一領域受益,因為低溫惰性被視為提高生產效率的有效手段。嚴格的純度標準、日益複雜的生物製藥產品以及本地化的物流正在形成良性循環,推動主要氣體生產商的銷售量成長。
拓展生物製藥低溫運輸的低溫物流。
個人化醫療為低溫運輸帶來了前所未有的複雜性。細胞療法和基因療法需要在-80 度C至-196 度C的溫度範圍內運輸,而液態氮憑藉其可靠的相態特性能夠滿足此溫度範圍。設備製造商正在添加物聯網遙測功能,以便在溫度偏差風險出現時向操作人員發出警報,從而增強監管機構和保險公司的信心。製藥公司正在建造分散式製造地,每個基地都需要液態氮冷卻罐、汽化器和故障安全警報系統。由於所運輸的生物製藥價值高昂,物流業者願意接受較高的液態氮價格,因為運輸損失遠大於天然氣的成本。北美佔了大部分運輸量,但隨著核准流程的擴展,歐洲和亞洲的生產基地也在擴大規模。
液態氮工廠的安全和監管合規成本
在發生多起低溫事故後,監管機構加強了監管,強制要求改善通風系統、加強氧氣不足監測並加強操作人員資格認證。美國職業安全與健康管理局 (OSHA) 增加了檢查頻率,導致氣體生產商和經銷商的合規預算增加。小規模業者難以承擔設備升級和不斷上漲的保險費用,因此,大型企業能夠透過大規模的銷售業績攤提成本,從而導致工廠被出售。雖然這些措施提高了職場的安全性,但也可能提高了進入門檻,減緩了新產能的引入,從而略微減緩了液態氮市場的整體成長。
細分市場分析
預計到2025年,包裝氣體將成為液態氮市場的主要驅動力,佔65.48%的市佔率。這主要得益於經濟高效的罐車運輸方式,這種方式能夠滿足石化、冶金和電子行業客戶大量且穩定的消費需求。散裝儲存槽可以每日補充,最大限度地減少搬運作業和蒸氣損失。工業區附近的物流樞紐利用鐵路專用線和專用卡車運輸,降低每噸運輸成本。由於現場管道和控制系統針對大流量進行了最佳化,因此客戶維繫率得以維持在較高水準。
儘管目前規模較小,但鋼瓶儲存是液態氮市場中成長最快的細分領域,預計到2031年將達到4.15%的複合年成長率。這主要歸功於實驗室、醫療機構和契約製造企業對便攜性和簡化許可流程的需求不斷成長。汽缸座的微型散裝解決方案為使用者提供模組化擴充性,無需安裝永久性儲罐。供應商利用遙測瓶蓋傳輸液位訊息,規劃動態配送路線,並最大限度地減少缺貨。這種成長的兩極化表明,能夠將散裝罐車基礎設施與高度移動的鋼瓶服務相結合的公司將能夠覆蓋最廣泛的市場領域。
區域分析
預計到2025年,亞太地區將佔據液態氮市場46.10%的佔有率,並在2031年之前以4.36%的複合年成長率持續成長,鞏固其作為全球最大且成長最快的地區的雙重地位。中國在晶圓製造領域的投資超過500億美元,主導這一市場,每個晶圓廠都需要氧濃度低於1ppm的氮氣進行蝕刻和測試。在印度,生物製藥產業的蓬勃發展推動了液態氮需求,新的疫苗生產線配備了大型氮氣罐和自動化氣相儲存系統。地方政府為工業園區內的管線走廊提供津貼,形成了獨特的需求叢集。
在北美,氮氣消費保持成熟且強勁的成長勢頭,這主要得益於墨西哥灣沿岸地區的石化產業、中西部地區的大規模食品加工業以及馬薩諸塞州和北卡羅來納州的生物製藥中心。醫療中心與大型天然氣公司簽訂的長期合約確保了氮氣的穩定供應,而門診癌症治療需求的不斷成長也推高了鋼瓶的使用量。工廠擴建採用了能源回收渦輪機和先進的吸附循環技術,降低了15%的電力消耗強度,並在電價上漲的情況下保持了競爭力。
在歐洲,供應商正將重點轉向超導性電網和先進治療藥物供應鏈的試點項目,同時努力在穩定性和創新之間取得平衡。儘管嚴格的安全標準推高了營運成本,但較高的可支配收入支撐了餐飲和精釀飲品行業對高品質氮氣應用的需求。南美和中東/非洲地區的供應量相對滯後,但這些地區的食品出口正在加速成長,並且正在建造用於石化聯合企業的包裝氣體倉儲設施。巴西的氮氣冷凍蝦出口和沙烏地阿拉伯的聚合物計畫表明,早期核心需求有望擴大分銷密度。這種區域差異凸顯了全球供應商需要巧妙應對法規、基礎設施和應用成熟度的差異,以實現投資組合收益最大化。
其他好處:
- Excel格式的市場預測(ME)表
- 3個月的分析師支持
目錄
第1章:引言
- 研究假設和市場定義
- 調查範圍
第2章:調查方法
第3章執行摘要
第4章 市場狀況
- 市場概覽
- 市場促進因素
- 化學和製藥業的需求增加
- 拓展生物製藥低溫運輸的低溫物流。
- LN2冷凍消融裝置在門診癌症治療中迅速普及
- 用於超導電電網專案的超冷液態氮(LN2)系統
- 亞利桑那州立大學針對特定產品的現場策略,旨在擴大內部供應。
- 市場限制因素
- 與液態氮工廠的安全和合規性相關的成本
- 低溫蒸餾的高能耗/碳足跡
- 高效能機械冷卻器給液態氮需求帶來了壓力。
- 價值鏈分析
- 波特五力模型
第5章 市場規模與成長預測
- 依儲存類型
- 圓柱
- 包裝氣體
- 按功能
- 冷卻液
- 冷媒
- 終端用戶產業
- 化學品和製藥
- 衛生保健
- 運輸
- 食品/飲料
- 電子和半導體
- 其他終端用戶產業
- 按地區
- 亞太地區
- 中國
- 印度
- 日本
- 韓國
- 其他亞太國家
- 北美洲
- 美國
- 加拿大
- 墨西哥
- 歐洲
- 德國
- 英國
- 義大利
- 法國
- 俄羅斯
- 其他歐洲國家
- 南美洲
- 巴西
- 阿根廷
- 其他南美國家
- 中東和非洲
- 沙烏地阿拉伯
- 南非
- 其他中東和非洲國家
- 亞太地區
第6章 競爭情勢
- 市場集中度
- 策略趨勢
- 市佔率和排名分析
- 公司簡介
- Air Liquide
- Air Products and Chemicals, Inc.
- Asia Industrial Gases Pte., Ltd.
- Gruppo Siad
- Gulf Cryo
- Haier Biomedical
- Iwatani Corporation
- Linde PLC
- Messer
- NEXAIR
- Southern Industrial Gas Sdn Bhd
- TAIYO NIPPON SANSO CORPORATION
- Tokyo Gas Chemicals Co., Ltd.
第7章 市場機會與未來展望
According to Mordor Intelligence, the liquid nitrogen market size in 2026 is estimated at 309.79 Million tons, growing from 2025 value of 298.71 Million tons with 2031 projections showing 371.62 Million tons, growing at 3.71% CAGR over 2026-2031.
This report is Segmented by Storage Type (Cylinder and Packaged Gas), Function (Coolant and Refrigerant), End-User Industry (Chemical and Pharmaceutical, Transportation, Food and Beverage, Electronics and Semiconductor, and Other End-User Industries), and Geography (Asia-Pacific, North America, Europe, South America, and Middle East and Africa). The Market Forecasts are Provided in Terms of Volume (Tons).
Global Liquid Nitrogen Market Trends and Insights
Increasing Demand from Chemical and Pharmaceutical Industry
Liquid nitrogen underpins inert atmospheres, rapid crystallization, and moisture-free handling that define modern active pharmaceutical ingredient quality. Continuous manufacturing lines require instantaneous temperature shifts that only liquid nitrogen can provide without chemical contamination. Regulatory encouragement for continuous processes accelerates adoption as companies de-risk scale-up timelines. Demand density in pharmaceutical hubs justifies dedicated pipelines, lowering delivered cost and cementing supplier-customer partnerships. The segment also benefits from burgeoning specialty chemical output in the Asia-Pacific that views cryogenic inerting as a productivity multiplier. A virtuous cycle emerges in which stringent purity norms, higher biologics complexity, and proximity logistics jointly lift off-take volumes for leading gas producers.
Cryogenic Logistics Expansion for Biologics Cold-Chains
Personalized medicine drives unprecedented cold-chain complexity. Cell and gene therapies need -80 °C to -196 °C transport conditions, and liquid nitrogen enables this temperature window with reliable phase behavior. Equipment makers add IoT telemetry that alerts handlers if excursion risk occurs, raising confidence among regulators and insurers. Pharmaceutical sponsors are building distributed manufacturing nodes; each node demands liquid nitrogen tanks, vaporizers, and fail-safe alarms. The high value of shipped biologics means logistics providers accept premium nitrogen pricing because loss events are costlier than gas expenditure. North America dominates volumes, yet European and Asian sites are scaling as approval pipelines widen.
Safety and Regulatory Compliance Costs for LN2 Plants
Authorities tightened oversight after several cryogenic incidents, mandating improved ventilation, oxygen-deficiency monitoring, and operator certification. OSHA inspections grew more frequent, raising compliance budgets for gas producers and distributors. Smaller operators struggle to fund upgrades and higher insurance premiums, prompting an uptick in plant divestitures to majors that can amortize costs over larger sales books. While these measures improve workplace safety, they elevate entry barriers and can delay new capacity rollouts, marginally tempering overall liquid nitrogen market growth.
Other drivers and restraints analyzed in the detailed report include:
- Rapid Uptake of LN2 Cryo-Ablation Devices in Outpatient Oncology
- Sub-Cooled LN2 Systems for Superconducting Grid Projects
- High-Efficiency Mechanical Freezers Eroding LN2 Demand
For complete list of drivers and restraints, kindly check the Table Of Contents.
Segment Analysis
Packaged gas led the liquid nitrogen market with a 65.48% liquid nitrogen market share in 2025, owing to cost-effective tanker deliveries that match the high-volume, steady-state consumption profiles of petrochemical, metallurgy, and electronics customers. Bulk storage tanks accept daily top-ups, minimizing handling and vapor loss. Logistics hubs near industrial corridors capitalize on rail sidings and dedicated truck fleets, keeping per-ton transport expense low. Customer retention is strong because site piping and control systems are optimized for bulk flow.
Though smaller today, Cylinder storage is the liquid nitrogen market's fastest riser at a 4.15% CAGR through 2031 as laboratories, medical practices, and contract manufacturing facilities prefer portability and simplified permitting. Cylinder-based micro-bulk solutions give users modular scalability without installing permanent tanks. Suppliers leverage telemetry caps that transmit fill levels, scheduling dynamic routing, and minimizing stockouts. The growth bifurcation implies that firms able to harmonize bulk tanker infrastructure with agile cylinder services will capture the widest segment spread.
Complete Report Scope:
- By Storage Type
- Cylinder
- Packaged Gas
- By Function
- Coolant
- Refrigerant
- End-User Industry
- Chemical and Pharmaceutical
- Healthcare
- Transportation
- Food and Beverage
- Electronics and Semiconductor
- Other End-user Industries
- By Geography
- Asia-Pacific
- China
- India
- Japan
- South Korea
- Rest of Asia-Pacific
- North America
- United States
- Canada
- Mexico
- Europe
- Germany
- United Kingdom
- Italy
- France
- Russia
- Rest of Europe
- South America
- Brazil
- Argentina
- Rest of South America
- Middle East and Africa
- Saudi Arabia
- South Africa
- Rest of Middle East and Africa
- Asia-Pacific
Geography Analysis
Asia-Pacific commanded 46.10% of the Liquid Nitrogen market share in 2025 and is projected to expand at a 4.36% CAGR through 2031, reinforcing its dual status as the largest and fastest-growing region. China leads wafer fabrication investments exceeding USD 50 billion, each fab demanding nitrogen purities under 1 ppm oxygen for etching and testing. India's biologics surge compounds demand, with new vaccine lines installing bulk nitrogen tanks alongside automated vapor phase storage. Local governments subsidize pipeline corridors in industrial parks, fostering captive demand clusters.
North America maintains mature yet robust consumption anchored by petrochemicals on the Gulf Coast, expansive food processing in the Midwest, and biopharmaceutical hubs in Massachusetts and North Carolina. Long-term contracts between medical centers and gas majors ensure stable bulk dispatches, while outpatient oncology drives incremental cylinder usage. Plant expansions employ energy-recovery turbines and advanced adsorption cycles, trimming electricity intensity by 15%, sustaining competitiveness amid rising power tariffs.
Europe balances stability with innovation, pivoting toward superconducting grid pilots and advanced therapy supply chains. Strict safety codes heighten operating costs, yet high disposable income supports premium nitrogen applications in gastronomy and craft beverages. South America and Middle East & Africa trail in volume but show accelerating installations of packaged gas depots serving food exports and petrochemical complexes. Brazil's nitrogen-freeze shrimp exports and Saudi Arabia's polymer projects represent early anchor loads that can scale distribution density. This geographic mosaic demonstrates that global suppliers must navigate differing regulatory, infrastructure, and application maturity levels to maximize portfolio yield.
- Air Liquide
- Air Products and Chemicals, Inc.
- Asia Industrial Gases Pte., Ltd.
- Gruppo Siad
- Gulf Cryo
- Haier Biomedical
- Iwatani Corporation
- Linde PLC
- Messer
- NEXAIR
- Southern Industrial Gas Sdn Bhd
- TAIYO NIPPON SANSO CORPORATION
- Tokyo Gas Chemicals Co., Ltd.
Additional Benefits:
- The market estimate (ME) sheet in Excel format
- 3 months of analyst support
TABLE OF CONTENTS
1 Introduction
- 1.1 Study Assumptions and Market Definition
- 1.2 Scope of the Study
2 Research Methodology
3 Executive Summary
4 Market Landscape
- 4.1 Market Overview
- 4.2 Market Drivers
- 4.2.1 Increasing demand from chemical and pharmaceutical industry
- 4.2.2 Cryogenic logistics expansion for biologics cold-chains
- 4.2.3 Rapid uptake of LN2 cryo-ablation devices in outpatient oncology
- 4.2.4 Sub-cooled LN2 systems for superconducting grid projects
- 4.2.5 On-site ASU co-product strategies boosting captive supply
- 4.3 Market Restraints
- 4.3.1 Safety and regulatory compliance costs for LN2 plants
- 4.3.2 High energy intensity / carbon footprint of cryogenic distillation
- 4.3.3 High-efficiency mechanical freezers eroding LN2 demand
- 4.4 Value Chain Analysis
- 4.5 Porter's Five Forces
- 4.5.1 Bargaining Power of Suppliers
- 4.5.2 Bargaining Power of Buyers
- 4.5.3 Threat of New Entrants
- 4.5.4 Threat of Substitutes
- 4.5.5 Degree of Competition
5 Market Size and Growth Forecasts (Volume)
- 5.1 By Storage Type
- 5.1.1 Cylinder
- 5.1.2 Packaged Gas
- 5.2 By Function
- 5.2.1 Coolant
- 5.2.2 Refrigerant
- 5.3 End-User Industry
- 5.3.1 Chemical and Pharmaceutical
- 5.3.2 Healthcare
- 5.3.3 Transportation
- 5.3.4 Food and Beverage
- 5.3.5 Electronics and Semiconductor
- 5.3.6 Other End-user Industries
- 5.4 By Geography
- 5.4.1 Asia-Pacific
- 5.4.1.1 China
- 5.4.1.2 India
- 5.4.1.3 Japan
- 5.4.1.4 South Korea
- 5.4.1.5 Rest of Asia-Pacific
- 5.4.2 North America
- 5.4.2.1 United States
- 5.4.2.2 Canada
- 5.4.2.3 Mexico
- 5.4.3 Europe
- 5.4.3.1 Germany
- 5.4.3.2 United Kingdom
- 5.4.3.3 Italy
- 5.4.3.4 France
- 5.4.3.5 Russia
- 5.4.3.6 Rest of Europe
- 5.4.4 South America
- 5.4.4.1 Brazil
- 5.4.4.2 Argentina
- 5.4.4.3 Rest of South America
- 5.4.5 Middle East and Africa
- 5.4.5.1 Saudi Arabia
- 5.4.5.2 South Africa
- 5.4.5.3 Rest of Middle East and Africa
- 5.4.1 Asia-Pacific
6 Competitive Landscape
- 6.1 Market Concentration
- 6.2 Strategic Moves
- 6.3 Market Share (%)/Ranking Analysis
- 6.4 Company Profiles (includes Global level Overview, Market level overview, Core Segments, Financials as available, Strategic Information, Market Rank/Share, Products and Services, and Recent Developments)
- 6.4.1 Air Liquide
- 6.4.2 Air Products and Chemicals, Inc.
- 6.4.3 Asia Industrial Gases Pte., Ltd.
- 6.4.4 Gruppo Siad
- 6.4.5 Gulf Cryo
- 6.4.6 Haier Biomedical
- 6.4.7 Iwatani Corporation
- 6.4.8 Linde PLC
- 6.4.9 Messer
- 6.4.10 NEXAIR
- 6.4.11 Southern Industrial Gas Sdn Bhd
- 6.4.12 TAIYO NIPPON SANSO CORPORATION
- 6.4.13 Tokyo Gas Chemicals Co., Ltd.
7 Market Opportunities and Future Outlook
- 7.1 White-space and Unmet-need Assessment

 液態氮市場:2026-2032年全球市場預測(依純度、供應形式、製造技術、應用及分銷通路分類)
 液態氮市場規模、佔有率、趨勢和預測:按技術、應用、儲存形式、最終用戶和地區分類,2026-2034年低溫燃料市場:依燃料類型、儲存類型、純度等級、技術、應用和分銷管道分類-2026-2032年全球預測
 2026年全球醫用液態氮市場報告2026年全球液態氮市場報告
 低溫燃料市場-全球產業規模、佔有率、趨勢、機會及預測(按類型、最終用途產業、地區及競爭格局分類,2021-2031年)
 液態氮市場規模、佔有率及成長分析(按技術、功能、儲存類型、最終用戶和地區分類)-2026-2033年產業預測
 低溫燃料市場規模、佔有率和成長分析(按類型、最終用途產業、通路和地區分類)-2026-2033年產業預測
 2025-2029年全球液態氮市場
 低溫燃料市場規模、佔有率和成長分析(按類型、最終用途產業、分佈和地區)- 產業預測,2025-2032 年