


 |
市場調查報告書
商品編碼
2114175
物聯網資料管理:市場佔有率分析、產業趨勢與統計、成長預測(2026-2031)IoT Data Management - Market Share Analysis, Industry Trends & Statistics, Growth Forecasts (2026 - 2031) |
||||||

※ 本網頁內容可能與最新版本有所差異。詳細情況請與我們聯繫。
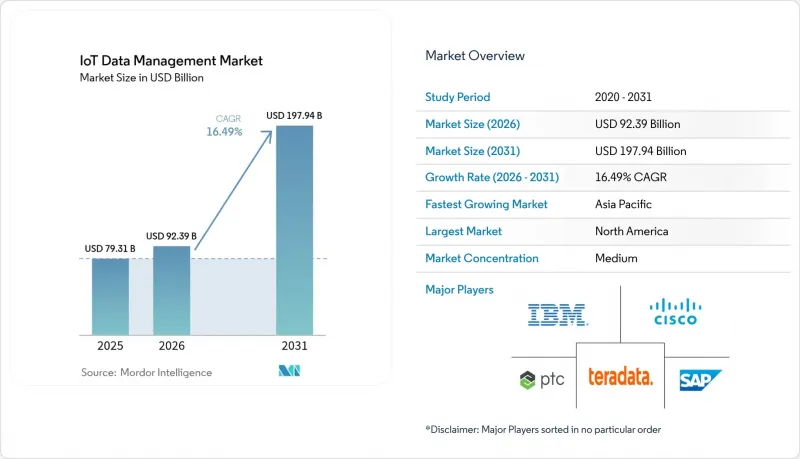
據 Mordor Intelligence 稱,物聯網資料管理市場預計到 2026 年價值 923.9 億美元,高於 2025 年的 793.1 億美元,預計到 2031 年將達到 1979.4 億美元。
預計 2026 年至 2031 年的複合年成長率為 16.49%。
本報告按解決方案(整合、遷移、分析等)、部署模式(雲端、本地部署、混合部署)、資料類型(結構化、半結構化、非結構化、時間序列)、最終用戶產業(農業、銀行、金融服務和保險等)、應用程式(預測性維護、智慧電錶、智慧電網分析等)和地區進行細分。市場預測以美元(USD)為單位。
全球物聯網資料管理市場趨勢與洞察
連網設備數量的激增正在推動資料量的成長。
目前,工業工廠每條生產線部署數千個感測器,產生Terabyte的遙測數據,傳統數據儲存無法處理。博世透過自動化資料管道編配,將人工智慧引進週期從數月縮短至數週,但這凸顯了感測器數量不斷成長帶來的擴展性挑戰。醫療保健產業也面臨類似的激增,需要符合HIPAA標準的低延遲存儲,因為遠端患者監護儀需要持續傳輸生物辨識數據。資料速度和多樣性帶來的壓力迫使企業轉向「流優先」和「時間序列原生」架構,以亞秒級的精度在邊緣和雲端之間同步資料。
雲端原生資料湖和分析的成熟度
容器化和無伺服器資料湖模式可在資料擷取高峰期自動擴展,從而消除傳統容量規劃中的瓶頸。 Snowflake 於 2025 年 6 月發布的 Openflow 可實現無縫的跨雲端資料傳輸,加速 AI原型製作。內建的機器學習管道現在可直接在資料湖環境中運行,避免了成本高昂的 ETL 流程,並透過資料處理歷程、加密和細粒度存取權限加強了管治。
標準碎片化和互通性差距
協議不一致迫使企業建構客製化中間件,導致維護成本上升和部署延遲。傳統工業設備需要轉換層才能與現代物聯網平台通訊,這進一步增加了複雜性。專有數據模型加劇了供應商鎖定,降低了生產力,並增加了風險,因為團隊需要並行管理目錄和血緣追蹤器。
細分市場分析
2025年,隨著企業將重心從原始資料收集轉向產生可執行的洞察,分析領域在物聯網資料管理市場中維持了36.42%的收入領先優勢。異常視覺化、資產利用率最佳化以及為預測演算法提供數據等需求推動了分析技術的應用,同時也促進了整合式儀錶板的廣泛使用,從而實現了現場工作人員之間更廣泛地共用洞察。
流處理預計將以 16.86% 的複合年成長率成長,這反映出製造業、醫療保健和行動出行領域正朝著連續決策循環的方向發生決定性轉變。 2025 年 3 月,Teradata 發布了整合企業級向量儲存 (Integrated Enterprise Vector Store),旨在為整合傳統分析和產生模型的 AI 工作負載提供支援。針對時間序列資料最佳化的安全性、元資料管理和儲存功能正在加深平台的普及,使這套全端解決方案成為企業的首選。
憑藉其無限的可擴展性和考慮營運成本 (OPEX) 的定價策略,雲端運算預計將在 2025 年保持 70.35% 的市場佔有率,為整個物聯網資料管理市場中的 AI 密集型工作負載提供彈性運算。然而,由於資料主權法規和對延遲敏感的應用場景,部分工作負載仍將繼續在本地運行,因此混合配置預計將以 17.12% 的複合年成長率成長。
企業擴大在邊緣處理高頻數據,並將聚合分析結果傳輸到雲湖以產生企業報告。日立Vantara的「EverFlex with Cisco Powered Hybrid Cloud」提供按需基礎設施,採用靈活的訂閱模式,涵蓋從基礎設施即服務 (IaaS) 到容器即服務 (Containers-as-a-Service) 的各種服務。邊緣編配與集中式管治的整合,實現了兼顧成本、合規性和效能目標的新型部署模式。
區域分析
北美地區在超大規模資料中心業者資料中心生態系統、豐富的資料科學人才以及清晰的監管環境的推動下,於 2025 年貢獻了 40.55% 的收入,這些因素加速了企業採用 AWS 的步伐。持續進行的 5G 和邊緣運算部署正在推動智慧工廠和遠端醫療專案對亞秒處理能力的需求。 AWS 在 2025 年第一季展現出強勁的成長勢頭,雲端營收表現穩健。
預計到2031年,亞太地區將以17.56%的複合年成長率引領全球成長,這主要得益於中國工業IoT的快速發展以及印度對智慧城市的大力投資,推動了市場規模的不斷擴大。華為的AI資料湖和5.5G網路解決方案凸顯了該地區對低延遲、以AI為中心的基礎設施的重視。東南亞物流和農業領域的應用不斷擴展,也將進一步刺激市場需求。
在歐洲,受「工業4.0」的推廣和嚴格的隱私法規(要求本地資料處理)的推動,市場持續穩定成長。德國的汽車生產線、英國數位醫療領域的試點項目以及斯堪的納維亞的智慧電網項目,都是物聯網資料管理市場中高價值、合規優先的典型案例。同時,拉丁美洲、中東和非洲市場仍處於起步階段,但基礎建設規劃和都市化提供承包、具成本效益解決方案的供應商創造了長期成長潛力。
其他好處:
- Excel格式的市場預測(ME)表
- 3個月的分析師支持
目錄
第1章:引言
- 研究假設和市場定義
- 調查範圍
第2章:調查方法
第3章執行摘要
第4章 市場狀況
- 市場概覽
- 市場促進因素
- 連網設備的激增正在推動資料量的成長。
- 雲端原生資料湖和分析的成熟度
- 資料管治與安全的監管舉措
- 即時邊緣分析提升業務流程效率
- 透過 5G 網路切片優先處理物聯網資料流
- 數據市場興起,實現感測器數據貨幣化
- 市場限制因素
- 標準碎片化和互通性差距
- 端到端技術棧的總擁有成本相對較高。
- 對能源足跡永續性的擔憂
- 限制跨境資料流動的資料主權法規
- 價值供應鏈分析
- 監理情勢
- 技術展望
- 波特五力分析
- 投資分析
第5章 市場規模及成長預測(價值,2021-2030 年)
- 透過解決方案
- 一體化
- 轉移
- 分析
- 貯存
- 安全
- 視覺化和儀錶板
- 元資料管理
- 串流處理
- 按部署模式
- 雲
- 現場
- 混合
- 類型
- 結構化
- 半結構化
- 非結構化
- 時間軸
- 按最終用戶行業分類
- 汽車和運輸業
- 醫療保健和生命科學
- 政府和智慧城市
- 製造業和工業
- 能源公用事業
- 零售與電子商務
- 農業
- BFSI
- 其他
- 透過使用
- 預測性保護
- 資產追蹤和車輛管理
- 智慧電錶
- 供應鏈可視性
- 遠端患者監護
- 智慧電網分析
- 按地區
- 北美洲
- 美國
- 加拿大
- 墨西哥
- 南美洲
- 巴西
- 阿根廷
- 其他南美國家
- 歐洲
- 德國
- 英國
- 法國
- 義大利
- 西班牙
- 俄羅斯
- 其他歐洲國家
- 亞太地區
- 中國
- 日本
- 印度
- 韓國
- 其他亞太國家
- 中東和非洲
- 中東
- 沙烏地阿拉伯
- 阿拉伯聯合大公國
- 土耳其
- 其他中東國家
- 非洲
- 南非
- 奈及利亞
- 其他非洲國家
- 中東
- 北美洲
第6章 競爭情勢
- 市場集中度
- 策略趨勢
- 市佔率分析
- 公司簡介
- Amazon Web Services(AWS)
- Microsoft Corp.(Azure)
- IBM Corp.
- SAP SE
- Cisco Systems Inc.
- Oracle Corp.
- Google Cloud Platform
- PTC Inc.
- Teradata Corp.
- Hewlett Packard Enterprise
- SAS Institute Inc.
- Fujitsu Ltd.
- Cloudera Inc.
- Snowflake Inc.
- Databricks Inc.
- Hitachi Vantara LLC
- Huawei Technologies Co. Ltd.
- Bosch.IO GmbH
- MongoDB Inc.
- Software AG
第7章 市場機會與未來展望
According to Mordor Intelligence, ioT data management market size in 2026 is estimated at USD 92.39 billion, growing from 2025 value of USD 79.31 billion with 2031 projections showing USD 197.94 billion, growing at 16.49% CAGR over 2026-2031.
This report is Segmented by Solution (Integration, Migration, Analytics, and More), Deployment Model (Cloud, On-Premise, Hybrid), Data Type (Structured, Semi-Structured, Unstructured, Time-Series), End-User Industry (Agriculture, BFSI, and More), Application (Predictive Maintenance, Smart Metering, Smart Grid Analytics, and More), and Geography. The Market Forecasts are Provided in Terms of Value (USD).
Global IoT Data Management Market Trends and Insights
Proliferation of Connected Devices Spurring Data Volumes
Industrial plants now deploy thousands of sensors per line, generating terabytes of telemetry that traditional data stores cannot absorb. Bosch shortened AI rollout cycles from months to weeks by automating data-pipeline orchestration, underscoring the scale challenges of sensor growth. Healthcare sees a similar surge as remote patient monitors stream continuous biometrics, needing HIPAA-compliant, low-latency storage. Velocity and variety pressures are pushing enterprises toward stream-first, time-series-native architectures that synchronize edge and cloud data in sub-second windows.
Cloud-Native Data Lakes and Analytics Maturity
Containerized and serverless data-lake patterns auto-scale with ingestion peaks, dissolving prior capacity-planning bottlenecks. Snowflake's Openflow release in June 2025 illustrates friction-free cross-cloud data mobility that accelerates AI prototyping. Built-in ML pipelines now run directly inside lake environments, avoiding costly ETL steps and strengthening governance via lineage, encryption, and granular permissions.
Fragmented Standards and Interoperability Gaps
Divergent protocols force businesses to build custom middleware that inflates maintenance costs and slows rollouts. Legacy industrial gear exacerbates complexity by requiring translation layers to talk to modern IoT platforms. Proprietary data models heighten vendor lock-in, burdening teams with parallel catalogs and lineage trackers that sap productivity and elevate risk.
Other drivers and restraints analyzed in the detailed report include:
- Regulatory Push for Data Governance and Security
- Real-Time Edge Analytics for Operational Efficiency
- High Total Cost of Ownership for End-to-End Stacks
For complete list of drivers and restraints, kindly check the Table Of Contents.
Segment Analysis
Analytics held a 36.42% revenue lead in 2025 as enterprises pivoted from raw-data capture to actionable insight generation within the IoT data management market. The need to visualize anomalies, optimize asset utilization, and feed predictive algorithms propelled analytics adoption alongside integrated dashboards that democratize insights for frontline staff.
Stream processing is slated for a 16.86% CAGR, reflecting a decisive transition to continuous decision loops in manufacturing, healthcare, and mobility. Teradata's integrated enterprise vector store debuted in March 2025 to power AI-ready workloads that unify traditional analytics and generative models. Security, metadata management, and time-series-optimized storage deepen platform stickiness, positioning full-stack suites as default enterprise choices.
Cloud retained a commanding 70.35% share in 2025 thanks to limitless scalability and opex-friendly pricing, delivering elastic compute for AI-intensive workloads across the IoT data management market. Yet hybrid configurations will post a 17.12% CAGR as data-sovereignty rules and latency-sensitive use cases keep select workloads on-premises.
Organizations increasingly process high-frequency data at the edge, forwarding aggregated analytics to cloud lakes for enterprise reporting. Hitachi Vantara's EverFlex with Cisco Powered Hybrid Cloud showcases on-demand infrastructure ranging from IaaS to Containers-as-a-Service, bundled under flexible subscriptions. The convergence of edge orchestration and centralized governance unlocks new deployment patterns that align cost, compliance, and performance goals.
Complete Report Scope:
- By Solution
- Integration
- Migration
- Analytics
- Storage
- Security
- Visualization and Dashboards
- Metadata Management
- Stream Processing
- By Deployment Model
- Cloud
- On-Premise
- Hybrid
- By Data Type
- Structured
- Semi-Structured
- Unstructured
- Time-Series
- By End-User Industry
- Automotive and Transportation
- Healthcare and Life Sciences
- Government and Smart Cities
- Manufacturing and Industrial
- Energy and Utilities
- Retail and E-commerce
- Agriculture
- BFSI
- Others
- By Application
- Predictive Maintenance
- Asset Tracking and Fleet Management
- Smart Metering
- Supply-Chain Visibility
- Remote Patient Monitoring
- Smart Grid Analytics
- By Geography
- North America
- United States
- Canada
- Mexico
- South America
- Brazil
- Argentina
- Rest of South America
- Europe
- Germany
- United Kingdom
- France
- Italy
- Spain
- Russia
- Rest of Europe
- Asia Pacific
- China
- Japan
- India
- South Korea
- Rest of Asia Pacific
- Middle East and Africa
- Middle East
- Saudi Arabia
- United Arab Emirates
- Turkey
- Rest of Middle East
- Africa
- South Africa
- Nigeria
- Rest of Africa
- Middle East
- North America
Geography Analysis
North America generated 40.55% of 2025 revenue, anchored by hyperscaler ecosystems, abundant data-science talent, and regulatory clarity that speeds enterprise adoption. Ongoing 5G and edge rollouts support sub-second processing needs in smart-factory and telehealth programs. AWS signaled healthy momentum with robust Q1 2025 cloud revenue.
Asia Pacific will pace global growth at an 17.56% CAGR to 2031 as China's industrial-IoT drive and India's smart-city spend enlarge addressable volumes. Huawei's AI Data Lake and 5.5G network solutions reveal regional commitment to low-latency, AI-centric infrastructure. Rising Southeast-Asian deployments in logistics and agriculture further broaden demand.
Europe sustains measured expansion through Industry 4.0 and stringent privacy rules that necessitate localized processing. Germany's automotive lines, the UK's digital-health pilots, and Nordic smart-grid projects exemplify high-value, compliance-first engagements within the IoT data management market. Meanwhile, Latin America and Middle East & Africa remain early-stage, yet infrastructure programs and urbanization create long-run upside for vendors offering turnkey, cost-efficient solutions.
- Amazon Web Services (AWS)
- Microsoft Corp. (Azure)
- IBM Corp.
- SAP SE
- Cisco Systems Inc.
- Oracle Corp.
- Google Cloud Platform
- PTC Inc.
- Teradata Corp.
- Hewlett Packard Enterprise
- SAS Institute Inc.
- Fujitsu Ltd.
- Cloudera Inc.
- Snowflake Inc.
- Databricks Inc.
- Hitachi Vantara LLC
- Huawei Technologies Co. Ltd.
- Bosch.IO GmbH
- MongoDB Inc.
- Software AG
Additional Benefits:
- The market estimate (ME) sheet in Excel format
- 3 months of analyst support
TABLE OF CONTENTS
1 Introduction
- 1.1 Study Assumptions and Market Definition
- 1.2 Scope of the Study
2 Research Methodology
3 Executive Summary
4 Market Landscape
- 4.1 Market Overview
- 4.2 Market Drivers
- 4.2.1 Proliferation of connected devices spurring data volumes
- 4.2.2 Cloud-native data lakes and analytics maturity
- 4.2.3 Regulatory push for data governance and security
- 4.2.4 Real-time edge analytics for operational efficiency
- 4.2.5 5G network-slicing enabling prioritised IoT data streams
- 4.2.6 Emergence of data-marketplaces monetising sensor data
- 4.3 Market Restraints
- 4.3.1 Fragmented standards and interoperability gaps
- 4.3.2 High total cost of ownership for end-to-end stacks
- 4.3.3 Sustainability concerns over energy footprint
- 4.3.4 Data-sovereignty regulations restricting cross-border flows
- 4.4 Value / Supply-Chain Analysis
- 4.5 Regulatory Landscape
- 4.6 Technological Outlook
- 4.7 Porter's Five Forces Analysis
- 4.7.1 Threat of New Entrants
- 4.7.2 Bargaining Power of Buyers
- 4.7.3 Bargaining Power of Suppliers
- 4.7.4 Threat of Substitutes
- 4.7.5 Intensity of Competitive Rivalry
- 4.8 Investment Analysis
5 Market Size and Growth Forecasts (Value, 2021-2030)
- 5.1 By Solution
- 5.1.1 Integration
- 5.1.2 Migration
- 5.1.3 Analytics
- 5.1.4 Storage
- 5.1.5 Security
- 5.1.6 Visualization and Dashboards
- 5.1.7 Metadata Management
- 5.1.8 Stream Processing
- 5.2 By Deployment Model
- 5.2.1 Cloud
- 5.2.2 On-Premise
- 5.2.3 Hybrid
- 5.3 By Data Type
- 5.3.1 Structured
- 5.3.2 Semi-Structured
- 5.3.3 Unstructured
- 5.3.4 Time-Series
- 5.4 By End-User Industry
- 5.4.1 Automotive and Transportation
- 5.4.2 Healthcare and Life Sciences
- 5.4.3 Government and Smart Cities
- 5.4.4 Manufacturing and Industrial
- 5.4.5 Energy and Utilities
- 5.4.6 Retail and E-commerce
- 5.4.7 Agriculture
- 5.4.8 BFSI
- 5.4.9 Others
- 5.5 By Application
- 5.5.1 Predictive Maintenance
- 5.5.2 Asset Tracking and Fleet Management
- 5.5.3 Smart Metering
- 5.5.4 Supply-Chain Visibility
- 5.5.5 Remote Patient Monitoring
- 5.5.6 Smart Grid Analytics
- 5.6 By Geography
- 5.6.1 North America
- 5.6.1.1 United States
- 5.6.1.2 Canada
- 5.6.1.3 Mexico
- 5.6.2 South America
- 5.6.2.1 Brazil
- 5.6.2.2 Argentina
- 5.6.2.3 Rest of South America
- 5.6.3 Europe
- 5.6.3.1 Germany
- 5.6.3.2 United Kingdom
- 5.6.3.3 France
- 5.6.3.4 Italy
- 5.6.3.5 Spain
- 5.6.3.6 Russia
- 5.6.3.7 Rest of Europe
- 5.6.4 Asia Pacific
- 5.6.4.1 China
- 5.6.4.2 Japan
- 5.6.4.3 India
- 5.6.4.4 South Korea
- 5.6.4.5 Rest of Asia Pacific
- 5.6.5 Middle East and Africa
- 5.6.5.1 Middle East
- 5.6.5.1.1 Saudi Arabia
- 5.6.5.1.2 United Arab Emirates
- 5.6.5.1.3 Turkey
- 5.6.5.1.4 Rest of Middle East
- 5.6.5.2 Africa
- 5.6.5.2.1 South Africa
- 5.6.5.2.2 Nigeria
- 5.6.5.2.3 Rest of Africa
- 5.6.5.1 Middle East
- 5.6.1 North America
6 Competitive Landscape
- 6.1 Market Concentration
- 6.2 Strategic Moves
- 6.3 Market Share Analysis
- 6.4 Company Profiles (includes Global level Overview, Market level overview, Core Segments, Financials as available, Strategic Information, Market Rank/Share, Products and Services, Recent Developments)
- 6.4.1 Amazon Web Services (AWS)
- 6.4.2 Microsoft Corp. (Azure)
- 6.4.3 IBM Corp.
- 6.4.4 SAP SE
- 6.4.5 Cisco Systems Inc.
- 6.4.6 Oracle Corp.
- 6.4.7 Google Cloud Platform
- 6.4.8 PTC Inc.
- 6.4.9 Teradata Corp.
- 6.4.10 Hewlett Packard Enterprise
- 6.4.11 SAS Institute Inc.
- 6.4.12 Fujitsu Ltd.
- 6.4.13 Cloudera Inc.
- 6.4.14 Snowflake Inc.
- 6.4.15 Databricks Inc.
- 6.4.16 Hitachi Vantara LLC
- 6.4.17 Huawei Technologies Co. Ltd.
- 6.4.18 Bosch.IO GmbH
- 6.4.19 MongoDB Inc.
- 6.4.20 Software AG
7 Market Opportunities and Future Outlook
- 7.1 White-space and Unmet-need Assessment

 2026年全球物聯網資料管理市場報告
 物聯網資料管理市場:按元件、資料類型、部署模式、企業規模、應用程式和產業分類-2026-2032年全球市場預測2026年全球物聯網(IoT)時間序列向量資料庫市場報告
 全球物聯網資料管理市場規模、佔有率、趨勢和成長分析報告(2026-2034年)
 物聯網資料管理市場規模、佔有率和成長分析(按組件、部署類型、組織規模、應用和地區分類)-2026-2033年產業預測數位供應鏈管理 (DSCM) 市場按組件、技術、組織規模、部署類型和最終用戶分類 - 全球預測 2026-2032 年糧倉資訊管理系統市場按部署類型、組件、組織規模和行業垂直領域分類 - 全球預測 2026-2032
 農業技術資料管理和分析市場 - 全球和區域分析:資料收集方法和支援技術、應用、解決方案和區域 - 分析和預測(2025-2035年)
 物聯網資料管理市場-全球產業規模、佔有率、趨勢、機會和預測(按組件、按部署、按應用、按地區、按競爭)2020-2030F
 物聯網資料管理市場規模、佔有率、趨勢分析報告:按組件、部署、組織規模、應用、地區和細分市場預測,2025 年至 2030 年