


 |
市場調查報告書
商品編碼
2114104
數位電力公司:市場佔有率分析、行業趨勢和統計數據、成長預測(2026-2031 年)Digital Power Utility - Market Share Analysis, Industry Trends & Statistics, Growth Forecasts (2026 - 2031) |
||||||

※ 本網頁內容可能與最新版本有所差異。詳細情況請與我們聯繫。
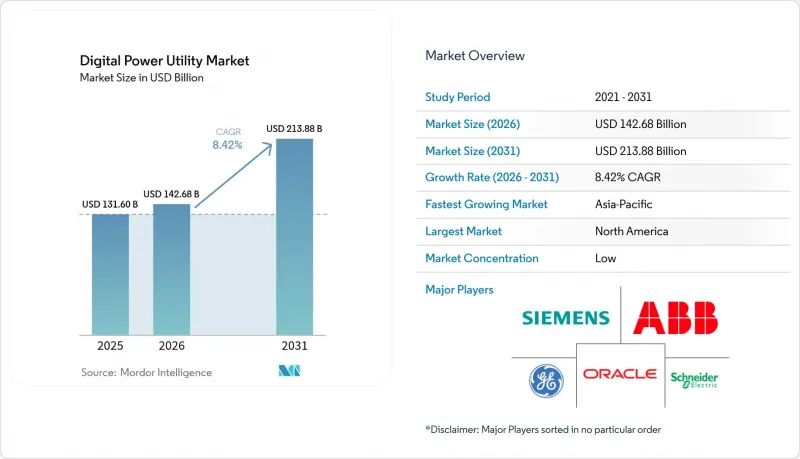
據 Mordor Intelligence 稱,2025 年數位電力公用事業市場價值為 1,316 億美元,預計到 2031 年將達到 2,138.8 億美元,而 2026 年為 1,426.8 億美元,預測期(2026-2031 年)的複合年成長率為 8.42%。
本報告按技術(整合解決方案和硬體)、產業(發電、輸電和配電、儲能、能源交易和零售)以及地區(北美、歐洲、亞太、南美以及中東和非洲)進行細分。市場規模和預測均以美元計價。
全球數位化電力公用事業市場趨勢與洞察
加快對智慧電網的投資
2024年,電力公司在智慧電網升級方面投資超過400億美元,使現代化成為其資本規劃的觀點。美國電力公司在俄亥俄州投資3.5億美元的部署項目以及DTE能源公司投資40億美元的項目,清楚地表明了電力系統正從硬體更換轉向高度互通性、數據豐富的智慧基礎設施。投資正日益集中於整合先進測量、配電自動化和情境察覺的平台,以減少停電事故。由於即時監控能夠減少服務中斷時間並降低現場維護成本,因此投資回報十分可觀。此外,電力公司也透過附加價值服務將詳細的用電數據貨幣化,從而獲得新的商機。
可再生能源與分散式能源(DER)的整合
聯邦能源監管委員會 (FERC) 第 2222 號命令開放了聚合式、分散式資源的批發市場,需要複雜的協調機制,而舊有系統無法勝任。如今,數百萬個屋頂太陽能板、電池組和電動車充電器已併入電網,雙向電力流動已成為常態,而非例外。具備本地處理能力的邊緣設備會在資料傳送到控制中心之前,對微觀層面的波動進行調整。採用這種架構的電力公司報告稱,可再生能源輸出的波動更加平穩,棄電率也降低了。這項變化也推動了以客戶為中心的經營模式的發展,消費者可以透過靈活的用電行為獲得經濟獎勵。
需要大量的初始資本支出(CAPEX)。
全面部署智慧電網的成本為每千戶200萬至500萬美元,投資回收期遠超正常的監管週期。依賴地方政府債券的小規模合作社難以克服資金籌措障礙,導致部署延遲,而這些部署從長遠來看可以降低營運成本。法規核准的延遲(從申請到核准通常需要18個月)會降低組件價格波動時的購買力。雖然新興的官民合作關係緩解了部分問題,但其部署仍然零星分散。
細分市場分析
預計到2025年,整合平台將佔總收入的60.35%,凸顯了電力營運商對能夠消除資料孤島並簡化供應商管理的整合系統的偏好。數位孿生技術能夠模擬資產在各種負載和氣候條件下的行為,從而實現預測性維護,並將意外停電減少高達30%。這些套件中包含的AI驅動分析功能可以提前6到12個月預測組件故障,使營運商有時間安排電力調配或維修,而不會中斷服務。目前,數位電力硬體市場規模仍然較小,但隨著數百萬台支援5G的智慧電錶、重合閘和相位計量設備在全部區域的部署,該市場正在迅速擴張。通訊基礎設施的投資與雲端遷移密切相關,光纖和專用LTE骨幹網路的鋪設旨在確保即時保護方案所需的確定性延遲。在本地處理邊緣資料的中間件可以降低回程傳輸成本,同時保護客戶隱私。隨著資料主權相關法規的日益嚴格,這項功能正受到越來越多的關注。雖然單一產品仍然很重要,但競爭優勢在於“無縫編配”,這使得演算法訓練、設備韌體和客戶入口網站可以作為單一的整合解決方案來處理。
預計到2031年,硬體組件的複合年成長率將達到11.02%,這反映了新興市場計量技術的加速普及以及智慧設備的改造升級。例如,印度和東南亞的電力公司正在將收入保障與電錶資料的完整性掛鉤。智慧型設備還有助於預付收費並降低應收帳款風險。同時,在成熟市場,繼電器和變電站自動化系統正朝著升級方向發展,以便在不影響電網穩定性的前提下整合可再生能源。在數位化電力市場,那些在晶片層面整合安全功能的供應商仍然備受青睞,因為他們符合監管要求,這些要求要求在授予型號認證之前評估組件層面的攻擊面。隨著平台日趨成熟,開放標準API將成為採購要求的標準,使電力業者擺脫對單一供應商生態系統的依賴。
區域分析
到2025年,北美將佔市場收入的37.45%,成為領先地區。旨在提高可靠性和整合可再生能源的各項舉措,例如國家電網公司350億美元的現代化改造計劃和第一能源公司14.2億美元的電網強化舉措,持續推動著投資成長。聯邦政府透過《基礎設施投資與就業法案》提供的資金進一步刺激了對先進導體、動態線路額定值感測器和亞秒保護方案的需求。加拿大跨境電力交易參與度的提高增加了複雜性,也推動了交易最佳化平台的應用。
亞太地區是成長的主要驅動力,預計2026年至2031年間,該地區數位電力市場將以12.25%的複合年成長率成長。中國已投資超過43億美元用於智慧電網試點項目,這些項目融合了人工智慧故障檢測和基於區塊鏈的P2P支付技術。印度計劃部署2.5億個智慧電錶,作為其全國電力基礎設施改革計畫的一部分。東南亞正在建造支援雙向輸電的待開發區電網,從而避免了老舊市場中常見的舊有系統所帶來的限制。日本和韓國正繼續試行利用邊緣人工智慧的電壓調節器方案,展示可應用於其他人口密集地區的模型。
在歐洲,基於《歐洲綠色交易》的氣候目標,各項工作正保持穩定推進。各國正加速引入高壓直流(HVDC)聯網線路和動態線路額定值,以促進可再生能源的跨境交易;同時,為應對地緣政治緊張局勢,各國也在加大對情境察覺分析的投資,以確保系統韌性。中東和非洲市場仍在發展中,但前景可期:海灣國家正透過擺脫對油氣資源的依賴來實現經濟多元化,撒哈拉以南非洲經濟體也正在整合離網太陽能和微電網。南美洲的情況則較為複雜。隨著輸電線路的擴張,巴西需要即時熱監測;而阿根廷則因可再生能源的快速成長,正在大力推廣分散式能源資源管理系統(DERMS)。在所有地區,資料管治法規都在影響架構選擇,而本地化雲端區域和邊緣運算節點正逐漸成為標準配置。
其他好處:
- Excel格式的市場預測(ME)表
- 3個月的分析師支持
目錄
第1章:引言
- 研究假設和市場定義
- 調查範圍
第2章:調查方法
第3章執行摘要
第4章 市場狀況
- 市場概覽
- 市場促進因素
- 加快對智慧電網的投資
- 可再生能源與分散式能源(DER)的整合
- 監管部門為實現脫碳和提高效率所做的努力
- 引進邊緣人工智慧進行即時電網最佳化
- 採購需求的激增凸顯了資料中心的柔軟性。
- 網路韌性需求正在推動數位孿生技術的應用。
- 市場限制因素
- 需要大量的初始資金投入。
- 舊有系統互通性的障礙
- 缺乏具備實務經驗的資料科學家
- 網路保險保費上漲
- 供應鏈分析
- 監理情勢
- 技術展望
- 波特五力模型
第5章 市場規模與成長預測
- 透過技術
- 整合解決方案
- 數位孿生平台
- 人工智慧和分析套件
- 物聯網和邊緣運算中介軟體
- 硬體
- 智慧電網設備(IED)
- 先進計量基礎設施(AMI)
- 通訊基礎設施
- 整合解決方案
- 按行業
- 發電
- 電力傳輸和分配
- 儲能
- 能源交易與零售
- 按地區
- 北美洲
- 美國
- 加拿大
- 墨西哥
- 歐洲
- 德國
- 英國
- 法國
- 義大利
- 北歐國家
- 俄羅斯
- 其他歐洲國家
- 亞太地區
- 中國
- 印度
- 日本
- 韓國
- 東南亞國協
- 其他亞太國家
- 南美洲
- 巴西
- 阿根廷
- 其他南美國家
- 中東和非洲
- 沙烏地阿拉伯
- 阿拉伯聯合大公國
- 南非
- 埃及
- 其他中東和非洲國家
- 北美洲
第6章 競爭情勢
- 市場集中度
- 策略趨勢(併購、聯盟、購電協議)
- 市場佔有率分析(主要公司的市場排名和市場佔有率)
- 公司簡介
- ABB Ltd
- Accenture PLC
- AutoGrid Systems Inc.
- Capgemini SE
- Cisco Systems Inc.
- General Electric Company
- Hitachi Energy Ltd
- Honeywell International Inc.
- IBM Corporation
- Infosys Limited
- Itron Inc.
- Landis+Gyr Group AG
- Microsoft Corporation
- Oracle Corporation
- OSI(Open Systems International)
- SAP SE
- Schneider Electric SE
- Siemens AG
- Wipro Limited
第7章 市場機會與未來展望
According to Mordor Intelligence, the digital power utility market size was valued at USD 131.60 billion in 2025 and estimated to grow from USD 142.68 billion in 2026 to reach USD 213.88 billion by 2031, at a CAGR of 8.42% during the forecast period (2026-2031).
This report is Segmented by Technology (Integrated Solutions and Hardware), Sector (Power Generation, Transmission and Distribution, Energy Storage, and Energy Trading and Retail), and Geography (North America, Europe, Asia-Pacific, South America, and Middle East and Africa). The Market Sizes and Forecasts are Provided in Terms of Value (USD).
Global Digital Power Utility Market Trends and Insights
Accelerated Smart-Grid Investments
Utilities allocated more than USD 40 billion to smart-grid upgrades during 2024, turning modernisation into the default capital-planning lens. American Electric Power's USD 350 million Ohio deployment and DTE Energy's USD 4 billion programme illustrate the pivot from hardware replacement toward interoperable, data-rich infrastructure. Investments increasingly favour platforms that fuse advanced metering, distribution automation, and situational awareness for outage mitigation. The return profile is attractive because real-time monitoring trims service-interruption minutes and curbs field-maintenance costs. Utilities also gain new revenue opportunities by monetising granular consumption data through value-added services.
Integration of Renewable Energy & DERs
FERC Order 2222 opened wholesale markets to aggregated distributed resources, demanding sophisticated orchestration that legacy systems cannot support. Millions of rooftop solar arrays, battery packs, and EV chargers now interact with the bulk grid, making bidirectional flows normal rather than exceptional. Edge devices with local processing balance micro-level variability before data flows upward to control centres. Utilities adopting these architectures report smoother renewable ramp-rates and lower curtailment. The shift also spurs customer-centric business models in which consumers receive financial incentives for flexible behaviour.
High Upfront CAPEX Requirements
Full-scale smart-grid deployments cost USD 2-5 million per thousand customers, with recovery periods stretching beyond typical regulatory cycles. Smaller cooperatives relying on municipal bonds struggle to clear financing thresholds, delaying roll-outs that could lower operating expenses in the long term. Regulatory lag-often 18 months between filing and approval-erodes purchasing power when component prices fluctuate. Emerging public-private partnerships provide partial relief, yet adoption remains sporadic.
Other drivers and restraints analyzed in the detailed report include:
- Regulatory Push for Decarbonisation & Efficiency
- Edge-AI Deployment for Real-Time Grid Optimisation
- Legacy-System Interoperability Barriers
For complete list of drivers and restraints, kindly check the Table Of Contents.
Segment Analysis
Integrated platforms held 60.35% of 2025 revenue, underscoring utilities' preference for unified systems that collapse data silos and streamline vendor management. Digital twins model asset behaviour under various loading and climate scenarios, enabling predictive maintenance that cuts unplanned outages by up to 30%. AI-driven analytics within these suites forecast component failures six to twelve months in advance, giving operators time to re-route power and schedule repairs without service disruption. The digital power utility market for hardware remains smaller today, yet it is expanding faster because millions of 5G-enabled smart meters, reclosers, and phasor measurement units are entering service across the Asia-Pacific. Communication infrastructure investments synchronize with cloud migration, laying fibre and private-LTE backbones that secure deterministic latency essential for real-time protection schemes. Middleware that processes edge data locally reduces backhaul costs while safeguarding customer privacy, a capability gaining traction as data-sovereignty regulations tighten. Although individual products still matter, the competitive edge lies in seamless orchestration, the ability to treat algorithm training, device firmware, and customer portals as one converged solution.
Hardware components are forecast to record an 11.02% CAGR through 2031, reflecting accelerated metering roll-outs and intelligent device retrofits in emerging markets. For example, utilities in India and Southeast Asia tie revenue protection to meter data integrity; intelligent devices also facilitate prepaid billing, reducing receivables risk. Meanwhile, mature markets update relay protection and substation automation to integrate renewables without compromising grid stability. The digital power utility market continues to reward vendors that embed cybersecurity features at the silicon level, satisfying regulators who now evaluate component-level attack surfaces before granting type approval. As platforms mature, open-standards APIs become default procurement requirements, so utilities are not locked into single-vendor ecosystems.
Complete Report Scope:
- By Technology
- Integrated Solutions
- Digital Twin Platforms
- AI and Analytics Suites
- IoT and Edge-Computing Middleware
- Hardware
- Intelligent Grid Devices (IEDs)
- Advanced Metering Infrastructure
- Communication Infrastructure
- Integrated Solutions
- By Sector
- Power Generation
- Transmission and Distribution
- Energy Storage
- Energy Trading and Retail
- By Geography
- North America
- United States
- Canada
- Mexico
- Europe
- Germany
- United Kingdom
- France
- Italy
- NORDIC Countries
- Russia
- Rest of Europe
- Asia-Pacific
- China
- India
- Japan
- South Korea
- ASEAN Countries
- Rest of Asia-Pacific
- South America
- Brazil
- Argentina
- Rest of South America
- Middle East and Africa
- Saudi Arabia
- United Arab Emirates
- South Africa
- Egypt
- Rest of Middle East and Africa
- North America
Geography Analysis
North America led with 37.45% market revenue in 2025. Investment has been sustained by measures such as National Grid's USD 35 billion modernisation programme and FirstEnergy's USD 1.42 billion grid enhancement initiative, aiming to fortify reliability and integrate renewables. Federal funding via the Infrastructure Investment and Jobs Act further ignites demand for advanced conductors, dynamic line-rating sensors, and sub-second protection schemes. Canada's growing participation in cross-border power trading introduces additional complexity that fuels the adoption of trading-optimization platforms.
Asia-Pacific represents the growth engine, with the digital power utility market expected to expand at a 12.25% CAGR from 2026 to 2031. China has invested over USD 4.3 billion in smart-grid pilots incorporating AI fault-detection and blockchain-enabled peer-to-peer settlement. India is targeting 250 million smart-meter installations under nationwide utility-reform programmes. Southeast Asia builds greenfield grids designed for bidirectional flows, bypassing legacy-system limitations common in older markets. Japan and South Korea continue to pilot edge-AI voltage-control schemes, demonstrating exportable blueprints for other densely populated regions.
Europe maintains steady momentum anchored by the European Green Deal's climate objectives. Nations accelerate HVDC interconnectors and dynamic line-rating deployment to unlock cross-border renewable trade, while resilience imperatives following geopolitical tensions spur investments in situational-awareness analytics. The Middle East and Africa's market remains nascent but shows promise as Gulf states diversify away from hydrocarbons and sub-Saharan economies integrate off-grid solar with mini-grids. South America exhibits mixed dynamics; Brazil's expanding transmission corridors require real-time thermal monitoring, whereas Argentina's renewable boom drives distributed-resource management system (DERMS) procurement. Across all regions, data-governance regulations influence architectural choices, making localised cloud zones and edge compute nodes standard features.
- ABB Ltd
- Accenture PLC
- AutoGrid Systems Inc.
- Capgemini SE
- Cisco Systems Inc.
- General Electric Company
- Hitachi Energy Ltd
- Honeywell International Inc.
- IBM Corporation
- Infosys Limited
- Itron Inc.
- Landis+Gyr Group AG
- Microsoft Corporation
- Oracle Corporation
- OSI (Open Systems International)
- SAP SE
- Schneider Electric SE
- Siemens AG
- Wipro Limited
Additional Benefits:
- The market estimate (ME) sheet in Excel format
- 3 months of analyst support
TABLE OF CONTENTS
1 Introduction
- 1.1 Study Assumptions & Market Definition
- 1.2 Scope of the Study
2 Research Methodology
3 Executive Summary
4 Market Landscape
- 4.1 Market Overview
- 4.2 Market Drivers
- 4.2.1 Accelerated smart-grid investments
- 4.2.2 Integration of renewable energy & DERs
- 4.2.3 Regulatory push for decarbonization & efficiency
- 4.2.4 Edge-AI deployment for real-time grid optimisation
- 4.2.5 Data-centre flexibility procurement surge
- 4.2.6 Cyber-resilience mandates driving digital-twin uptake
- 4.3 Market Restraints
- 4.3.1 High upfront CAPEX requirements
- 4.3.2 Legacy-system interoperability barriers
- 4.3.3 Utility-grade data-scientist scarcity
- 4.3.4 Rising cyber-insurance premiums
- 4.4 Supply-Chain Analysis
- 4.5 Regulatory Landscape
- 4.6 Technological Outlook
- 4.7 Porter's Five Forces
- 4.7.1 Bargaining Power of Suppliers
- 4.7.2 Bargaining Power of Consumers
- 4.7.3 Threat of New Entrants
- 4.7.4 Threat of Substitutes
- 4.7.5 Intensity of Competitive Rivalry
5 Market Size & Growth Forecasts
- 5.1 By Technology
- 5.1.1 Integrated Solutions
- 5.1.1.1 Digital Twin Platforms
- 5.1.1.2 AI and Analytics Suites
- 5.1.1.3 IoT and Edge-Computing Middleware
- 5.1.2 Hardware
- 5.1.2.1 Intelligent Grid Devices (IEDs)
- 5.1.2.2 Advanced Metering Infrastructure
- 5.1.2.3 Communication Infrastructure
- 5.1.1 Integrated Solutions
- 5.2 By Sector
- 5.2.1 Power Generation
- 5.2.2 Transmission and Distribution
- 5.2.3 Energy Storage
- 5.2.4 Energy Trading and Retail
- 5.3 By Geography
- 5.3.1 North America
- 5.3.1.1 United States
- 5.3.1.2 Canada
- 5.3.1.3 Mexico
- 5.3.2 Europe
- 5.3.2.1 Germany
- 5.3.2.2 United Kingdom
- 5.3.2.3 France
- 5.3.2.4 Italy
- 5.3.2.5 NORDIC Countries
- 5.3.2.6 Russia
- 5.3.2.7 Rest of Europe
- 5.3.3 Asia-Pacific
- 5.3.3.1 China
- 5.3.3.2 India
- 5.3.3.3 Japan
- 5.3.3.4 South Korea
- 5.3.3.5 ASEAN Countries
- 5.3.3.6 Rest of Asia-Pacific
- 5.3.4 South America
- 5.3.4.1 Brazil
- 5.3.4.2 Argentina
- 5.3.4.3 Rest of South America
- 5.3.5 Middle East and Africa
- 5.3.5.1 Saudi Arabia
- 5.3.5.2 United Arab Emirates
- 5.3.5.3 South Africa
- 5.3.5.4 Egypt
- 5.3.5.5 Rest of Middle East and Africa
- 5.3.1 North America
6 Competitive Landscape
- 6.1 Market Concentration
- 6.2 Strategic Moves (M&A, Partnerships, PPAs)
- 6.3 Market Share Analysis (Market Rank/Share for key companies)
- 6.4 Company Profiles (includes Global level Overview, Market level overview, Core Segments, Financials as available, Strategic Information, Products & Services, and Recent Developments)
- 6.4.1 ABB Ltd
- 6.4.2 Accenture PLC
- 6.4.3 AutoGrid Systems Inc.
- 6.4.4 Capgemini SE
- 6.4.5 Cisco Systems Inc.
- 6.4.6 General Electric Company
- 6.4.7 Hitachi Energy Ltd
- 6.4.8 Honeywell International Inc.
- 6.4.9 IBM Corporation
- 6.4.10 Infosys Limited
- 6.4.11 Itron Inc.
- 6.4.12 Landis+Gyr Group AG
- 6.4.13 Microsoft Corporation
- 6.4.14 Oracle Corporation
- 6.4.15 OSI (Open Systems International)
- 6.4.16 SAP SE
- 6.4.17 Schneider Electric SE
- 6.4.18 Siemens AG
- 6.4.19 Wipro Limited
7 Market Opportunities & Future Outlook
- 7.1 White-space & Unmet-Need Assessment


