


 |
市場調查報告書
商品編碼
2114088
光頻譜分析儀(OSA):市場佔有率分析、產業趨勢與統計、成長預測(2026-2031)Optical Spectrum Analyzer (OSA) - Market Share Analysis, Industry Trends & Statistics, Growth Forecasts (2026 - 2031) |
||||||

※ 本網頁內容可能與最新版本有所差異。詳細情況請與我們聯繫。
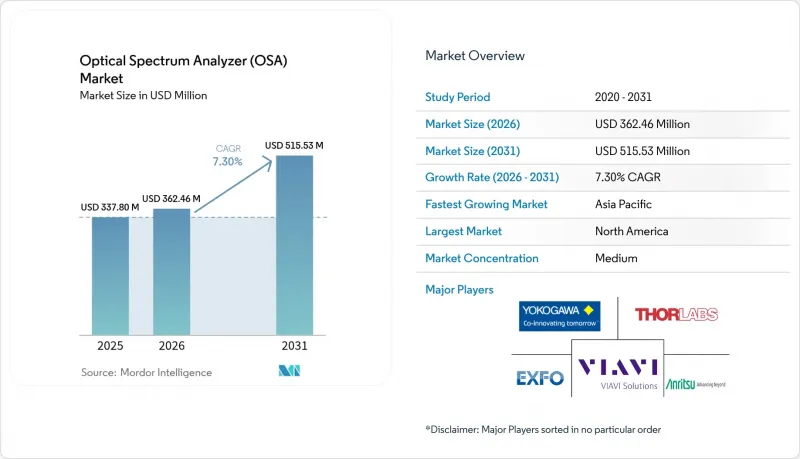
根據 Mordor Intelligence 預測,光頻譜分析儀的市場規模預計將從 2025 年的 3.378 億美元成長到 2026 年的 3.6246 億美元,到 2031 年將達到 5.1553 億美元,2026 年至 2031 年的複合年成長率為 7.30%。
本報告按類型(可攜式、手持式、桌上型)、模式(光譜儀模式、波長計模式)、波長範圍(400–700 nm(可見光)、700–1700 nm(近紅外線)和 1700–2400 nm(短波紅外線))、用戶產業(近紅外線)和 1700–2400 nm(短波紅外線))、家用電子電器和光電公司進行細分(電信用戶產業)。市場預測以美元計價。
全球光頻譜分析儀 (OSA) 市場趨勢與洞察
400/800G連貫光纖網路的擴展
隨著雲端服務供應商擴展其資料中心互連規模,400G 和 800G連貫埠的部署正在激增。 Cignal AI 預測,400G 插入式連接埠的部署將在 2026 年達到峰值,隨後 800G 的採用率將迎來爆發式成長。這些高階調製方案需要亞皮米級解析度和低偏振相關損耗,這再次推動了對高精度光頻譜分析儀 (OSA) 的需求。為了滿足這一趨勢,供應商正在其產品中整合更快的連貫接收器、自動色散補償分析功能和更寬的掃描頻寬。隨著網路向 1.6 T 介面發展,具有即時數位訊號處理 (DSP) 功能的連續掃描光頻譜分析儀對於在更窄的通道間隔下檢驗光信噪比 (OSNR) 至關重要。
5G/6G去程傳輸與回程傳輸DWDM 連結的部署
目前,DWDM是人口密集都市區5G去程傳輸的基礎,而早期6G現場測試已經需要低於50 GHz的頻道解析度。研究預測,到2030年,行動回程和去程傳輸收入將達到563.4億美元,這意味著對光測試的需求將達到前所未有的水平。除了針對1550 nm C波段通道校準的光頻譜分析儀(OSA)之外,涵蓋1310 nm點對點光纖和自由空間光(FSO)饋源的擴展儀器系列也正在推出。營運商傾向於選擇具有整合式遠端雲端控制面板的手持式設計,以便在基地台推出期間即時取得頻譜簡介。光頻譜分析儀市場正日益與被動光纖網路(PON)功率計捆綁銷售,從而打造一站式診斷套件。
亞皮米解析度OSA的初始投資和校準成本較高
亞皮米級測量儀器通常單價超過10萬美元,且需要定期進行出廠校準以保持±0.03 nm的絕對精度。這些持續的成本對於價格敏感地區的小型和中型實驗室以及網路營運商而言是一大障礙。據EXFO稱,要保持±0.5 dB的功率精度,通常需要專業供應商提供重新校準服務。供應商正試圖透過推出基於訂閱的校準程序和模組化光學組件來降低整體擁有成本,但這些方案在注重成本的買家中普及率仍然有限,阻礙了通道間隔小於100 GHz細分市場的成長。
細分市場分析
到2025年,桌上型儀器將佔總銷售額的69.35%,這得益於其無與倫比的動態範圍和掃描解析度。這些實驗室級平台將繼續用於高階連貫網路的部署前表徵和製造過程中的品管(QC)。同時,手持式儀器的複合年成長率(CAGR)為10.05%,比光頻譜分析儀市場的整體成長率高出近3個百分點。在基於MEMS的繞射光柵和基於GPU的訊號重建技術的進步推動下,手持式光頻譜分析儀市場預計將維持10.05%的複合年成長率。
可攜式設計整合了雲端原生儀錶板、Wi-Fi回程傳輸和 AI 驅動的事件標註功能,使現場技術人員能夠將追蹤資料直接上傳到故障單系統。採用模式編碼孔徑的計算光譜儀在重量小於 1 公斤的機殼內實現了 0.1 奈米的解析度。供應商也在大力推廣混合型「可攜式桌上型」儀器,這些儀器在堅固的外殼中實現了桌上型儀器的精度,從而擴大了其在中端市場的普及。這些變化表明,在整個頻譜儀市場中,解析度、預算和便攜性之間存在著長期的平衡。
光譜儀模式佔總銷售額的 64.40%,因為它能夠整體情況C 波段和L波段的功率頻譜密度。隨著 DWDM 通道數量的增加,工程師擴大將掃描測量與光譜儀結合使用,並將瞬時測量與即時波長計結合使用,以檢測負載下的漂移。波長計產品目前以每年 8.95% 的速度成長,透過將穩定的法布里-珀羅參考光源與高速光電二極體陣列相結合,可在 200 毫秒內實現 ±0.01 nm 的精度。
在光通道開通測試中,波長計檢查通常是進行詳細光譜儀分析之前的第一步,而這種工作流程正在推動雙模儀器的應用。是德科技(Keysight)近期發布的測試儀整合了兩種測量路徑,並增加了人工智慧驅動的合格/不合格判定功能,從而縮短了認證時間。隨著演算法技術能夠彌補檢測元件缺失的影響,並在保持精度的同時降低成本,預計光頻譜分析儀產業將進一步融合。
區域分析
預計到2025年,北美將佔全球銷售額的32.70%,主要得益於高密度超大規模資料中心叢集和聯邦政府支持的量子研究中心。強制要求將光層合規性整合到800G收發器中的法規進一步推動了採購動能。 Ciena公司8192連貫路由器的推出也刺激了對線上光譜檢驗的需求。此外,旨在降低零件供應風險的回流激勵措施也使區域製造商受益。
亞太地區呈現最快成長勢頭,預計到2031年將以8.78%的複合年成長率成長。 5G的大規模部署、光子晶片晶圓代工廠產能的擴張以及「中國製造2025」等國家計畫正在推動當地對高精度測試設備的投資。隨著電信業者提高回程傳輸網路密度以及高校加大對光子積體電路(PIC)的研究力度,預計到2031年,亞太地區的光頻譜分析儀市場規模將快速成長。
歐洲憑藉合作研發資金、生態設計法規以及荷蘭和德國的整合光電叢集,保持著強勁的地位。嚴格的碳減排目標迫使電信業者採用節能的連貫光技術,而這需要進行精細的頻譜平衡才能實現。中東、非洲和南美洲的發展勢頭也日益強勁,新的光纖計畫正迅速取代老舊的銅纜基礎設施。儘管投資規模相對較小,但由於網路各階段的初始設備訂單量龐大,全球光頻譜分析儀市場仍在不斷擴張。
其他好處:
- Excel格式的市場預測(ME)表
- 3個月的分析師支持
目錄
第1章:引言
- 研究假設和市場定義
- 調查範圍
第2章:調查方法
第3章執行摘要
第4章 市場狀況
- 市場概覽
- 市場促進因素
- 400/800G連貫光纖網路的擴展
- 5G/6G去程傳輸與回程傳輸DWDM 連結的部署
- 由於小型化技術的應用,OSA 可以現場實施。
- 矽光電和量子光學領域的研究與開發資金正在激增。
- 符合資料中心收發器光層標準(美國和歐盟)
- 市場限制因素
- 亞微米解析度 OSA 的高昂資本和校準成本
- 連貫系統手持設備的效能限制
- 其他即時頻寬監測(基於SWI)解決方案
- 關稅導致光子元件供應鏈出現波動
- 產業生態系分析
- 技術展望
- 波特五力分析
第5章 市場規模與成長預測
- 按類型
- 可攜式的
- 手持式
- 工作檯面
- 按模式類型
- 光譜儀模式
- 波長計模式
- 按波長範圍
- 400-700奈米(可見光)
- 700-1700 奈米(近紅外線)
- 1700~2400 nm(SWIR)
- 按最終用戶行業分類
- 電信業者和原始設備製造商
- 醫療與生命科學測量儀器
- 家用電子電器和光電裝置
- 工業和製造業中的品質保證(QA)/品管(QC)
- 航太與國防光電子學
- 學術和政府附屬研究機構
- 按地區
- 北美洲
- 美國
- 加拿大
- 墨西哥
- 歐洲
- 德國
- 英國
- 法國
- 義大利
- 西班牙
- 其他歐洲國家
- 亞太地區
- 中國
- 日本
- 韓國
- 印度
- 東南亞
- 其他亞太國家
- 南美洲
- 巴西
- 其他南美國家
- 中東和非洲
- 中東
- 阿拉伯聯合大公國
- 沙烏地阿拉伯
- 其他中東國家
- 非洲
- 南非
- 其他非洲國家
- 中東
- 北美洲
第6章 競爭情勢
- 市場集中度
- 策略趨勢
- 市佔率分析
- 公司簡介
- Yokogawa Test and Measurement Corp.
- Keysight Technologies Inc.
- VIAVI Solutions Inc.
- EXFO Inc.
- Anritsu Corp.
- Thorlabs Inc.
- Coherent(II-VI Inc.)
- Luna Innovations Inc.
- Quantifi Photonics Ltd.
- Apex Technologies
- Aragon Photonics Labs
- ID Photonics GmbH
- VeEX Inc.
- Timbercon Inc.
- Optoplex Corp.
- AMS Technologies AG
- Bristol Instruments Inc.
- Advanced Photonix(Luna)
- Finisar Corp.
- Spectris PLC
第7章 市場機會與未來展望
According to Mordor Intelligence, the optical spectrum analyzer market size is expected to grow from USD 337.8 million in 2025 to USD 362.46 million in 2026 and is forecast to reach USD 515.53 million by 2031 at 7.30% CAGR over 2026-2031.
This report is Segmented by Type (Portable, Handheld, and Benchtop), Mode Type (Spectrometer Mode, and Wavelength Meter Mode), Wavelength Range (400-700 Nm (Visible), 700-1700 Nm (Near-IR), and 1700-2400 Nm (SWIR)), End-User Industry (Telecommunication Operators and OEMs, Consumer Electronics and Photonics Devices, and More), and Geography. The Market Forecasts are Provided in Terms of Value (USD).
Global Optical Spectrum Analyzer (OSA) Market Trends and Insights
Expansion of 400/800 G Coherent Optical Networks
Installations of 400 G and 800 G coherent ports are rising sharply as cloud operators extend datacenter-interconnect footprints. Cignal AI expects 400 G pluggable port deployments to peak in 2026, followed by 800 G adoption.These higher-order modulation formats require sub-picometer resolution and low polarization-dependent loss, driving renewed demand for high-accuracy OSAs. Vendors are embedding faster coherent receivers, automated dispersion-compensation analytics, and broader sweep bandwidths to keep pace. As networks migrate toward 1.6 T interfaces, continuous-sweep instruments with real-time digital signal processing (DSP) become indispensable for validating optical signal-to-noise ratio (OSNR) under tighter channel spacing.
Roll-out of 5G/6G Fronthaul & Backhaul DWDM Links
DWDM now underpins 5G fronthaul in dense urban clusters, and early 6G field trials already demand channel granularity below 50 GHz. Research predicts mobile backhaul and fronthaul revenue to reach USD 56.34 billion by 2030, implying unprecedented optical-testing volume.OSAs calibrated for 1550 nm C-band channels are being supplemented with extended-range units that cover 1310 nm P2P fiber and free-space optics feeds. Operators favor handheld designs that integrate remote cloud dashboards, enabling immediate spectral snapshots during tower turn-ups. The optical spectrum analyzer market is seeing increased bundling with passive optical network (PON) power meters, creating one-stop diagnostic kits.
High capital and calibration cost of sub-pm resolution OSAs
Sub-picometer instruments often exceed USD 100,000 per unit and demand periodic factory calibration to maintain +-0.03 nm absolute accuracy. These recurring expenses deter smaller labs and network operators in price-sensitive regions. EXFO notes that maintaining +-0.5 dB power accuracy typically requires specialist recalibration services. Vendors are experimenting with subscription-based calibration programs and modular optics cartridges to lower ownership cost, yet adoption remains constrained among cost-conscious buyers, tempering growth in segments below 100 GHz channel spacing.
Other drivers and restraints analyzed in the detailed report include:
- Miniaturisation Enabling Field-Deployable OSAs
- Silicon Photonics and Quantum Optics R&D Funding Upsurge
- Alternative real-time spectrum monitoring (software-defined) solutions
For complete list of drivers and restraints, kindly check the Table Of Contents.
Segment Analysis
Benchtop units contributed to 69.35% of total revenue, in 2025, thanks to unmatched dynamic range and sweep resolution. High-end coherent network rollouts continue to rely on these laboratory-grade platforms for pre-deployment characterization and manufacturing QC. Yet the handheld segment is expanding at a 10.05% CAGR, nearly three percentage points above the overall optical spectrum analyzer market. The optical spectrum analyzer market size for handheld models is forecast to register a CAGR of 10,05%, propelled by MEMS-based gratings and GPU-accelerated signal reconstruction.
Portable designs integrate cloud-native dashboards, Wi-Fi backhaul, and AI-powered event annotation, letting field technicians upload traces directly into trouble-ticket systems. Computational spectrometers using pattern-encoded apertures now achieve 0.1 nm resolution in chassis weighing under 1 kg.Vendors also push hybrid "portable-bench" instruments delivering benchtop-level accuracy in a rugged case, widening mid-tier adoption. These shifts indicate a long-run balancing act between resolution, budget, and mobility across the optical spectrum analyzer market.
Spectrometer mode generated 64.40% of revenue, because it delivers a full view of power spectral density across C- and L-bands. As DWDM channel counts rise, engineers increasingly pair spectrometer sweeps with real-time wavelength-meter snapshots to catch drift under load. Wavelength-meter products, now growing at 8.95% annually, combine stabilized Fabry-Perot references with fast photodiode arrays, producing +-0.01 nm accuracy within 200 ms.
Optical channel turn-up often begins with a wavelength-meter check before deeper spectrometer analysis, a workflow that is fostering dual-mode instruments. Keysight's recent tester embeds both measurement paths, adding AI-driven pass-fail analytics that trim certification time. The optical spectrum analyzer industry is likely to see further convergence, as algorithmic techniques compensate for missing detector elements, compressing cost while maintaining precision.
Complete Report Scope:
- By Type
- Portable
- Handheld
- Benchtop
- By Mode Type
- Spectrometer Mode
- Wavelength Meter Mode
- By Wavelength Range
- 400-700 nm (Visible)
- 700-1700 nm (Near-IR)
- 1700-2400 nm (SWIR)
- By End-user Industry
- Telecommunication Operators and OEMs
- Healthcare and Life-Sciences Instrumentation
- Consumer Electronics and Photonics Devices
- Industrial and Manufacturing QA/QC
- Aerospace and Defence Optoelectronics
- Academic and Government Research Labs
- By Geography
- North America
- United States
- Canada
- Mexico
- Europe
- Germany
- United Kingdom
- France
- Italy
- Spain
- Rest of Europe
- Asia-Pacific
- China
- Japan
- South Korea
- India
- South East Asia
- Rest of Asia-Pacific
- South America
- Brazil
- Rest of South America
- Middle East and Africa
- Middle East
- United Arab Emirates
- Saudi Arabia
- Rest of Middle East
- Africa
- South Africa
- Rest of Africa
- Middle East
- North America
Geography Analysis
North America contributed 32.70% of revenue in 2025, anchored by dense hyperscale datacenter clusters and federally backed quantum-research hubs. Regulatory mandates that embed optical-layer compliance in 800 G transceivers reinforce procurement momentum, while Ciena's 8192 coherent router launch further stimulates demand for inline spectral verification. Regional manufacturers also benefit from reshoring incentives designed to de-risk component supply.
Asia Pacific shows the fastest trajectory, advancing at an 8.78% CAGR to 2031. Massive 5G rollouts, rising photonic-chip foundry capacity, and national programs such as "Made in China 2025" are propelling local spending on high-precision test gear. The optical spectrum analyzer market size for Asia Pacific is projected to grow rapidly by 2031 as carriers densify backhaul networks and universities escalate PIC research.
Europe maintains strong standing through concerted R&D funding, eco-design regulations, and integrated photonics clusters in the Netherlands and Germany. Strict carbon-reduction goals push operators to adopt energy-efficient coherent optics, a move that requires meticulous spectral balancing during deployment. Momentum also builds in the Middle East, Africa, and South America, where greenfield fiber projects leapfrog older copper infrastructure. While spending is smaller, high initial equipment orders accompany each network phase, expanding the global optical spectrum analyzer market footprint.
- Yokogawa Test and Measurement Corp.
- Keysight Technologies Inc.
- VIAVI Solutions Inc.
- EXFO Inc.
- Anritsu Corp.
- Thorlabs Inc.
- Coherent (II-VI Inc.)
- Luna Innovations Inc.
- Quantifi Photonics Ltd.
- Apex Technologies
- Aragon Photonics Labs
- ID Photonics GmbH
- VeEX Inc.
- Timbercon Inc.
- Optoplex Corp.
- AMS Technologies AG
- Bristol Instruments Inc.
- Advanced Photonix (Luna)
- Finisar Corp.
- Spectris PLC
Additional Benefits:
- The market estimate (ME) sheet in Excel format
- 3 months of analyst support
TABLE OF CONTENTS
1 INTRODUCTION
- 1.1 Study Assumptions and Market Definition
- 1.2 Scope of the Study
2 RESEARCH METHODOLOGY
3 EXECUTIVE SUMMARY
4 MARKET LANDSCAPE
- 4.1 Market Overview
- 4.2 Market Drivers
- 4.2.1 Expansion of 400/800 G Coherent Optical Networks
- 4.2.2 Roll-out of 5G/6G Fronthaul and Backhaul DWDM Links
- 4.2.3 Miniaturisation Enabling Field-Deployable OSAs
- 4.2.4 Silicon Photonics and Quantum Optics R&D Funding Upsurge
- 4.2.5 Mandatory Optical-Layer Compliance in Data-Centre Transceivers (United States and EU)
- 4.3 Market Restraints
- 4.3.1 High Capital and Calibration Cost of Sub-pm Resolution OSAs
- 4.3.2 Performance Limits of Handheld Units for Coherent Systems
- 4.3.3 Alternative Real-time Spectrum Monitoring (SWI-based) Solutions
- 4.3.4 Tariff-Driven Photonic Component Supply-Chain Volatility
- 4.4 Industry Ecosystem Analysis
- 4.5 Technological Outlook
- 4.6 Porter's Five Forces Analysis
- 4.6.1 Threat of New Entrants
- 4.6.2 Bargaining Power of Buyers
- 4.6.3 Bargaining Power of Suppliers
- 4.6.4 Threat of Substitutes
- 4.6.5 Intensity of Rivalry
5 MARKET SIZE AND GROWTH FORECASTS (VALUES)
- 5.1 By Type
- 5.1.1 Portable
- 5.1.2 Handheld
- 5.1.3 Benchtop
- 5.2 By Mode Type
- 5.2.1 Spectrometer Mode
- 5.2.2 Wavelength Meter Mode
- 5.3 By Wavelength Range
- 5.3.1 400-700 nm (Visible)
- 5.3.2 700-1700 nm (Near-IR)
- 5.3.3 1700-2400 nm (SWIR)
- 5.4 By End-user Industry
- 5.4.1 Telecommunication Operators and OEMs
- 5.4.2 Healthcare and Life-Sciences Instrumentation
- 5.4.3 Consumer Electronics and Photonics Devices
- 5.4.4 Industrial and Manufacturing QA/QC
- 5.4.5 Aerospace and Defence Optoelectronics
- 5.4.6 Academic and Government Research Labs
- 5.5 By Geography
- 5.5.1 North America
- 5.5.1.1 United States
- 5.5.1.2 Canada
- 5.5.1.3 Mexico
- 5.5.2 Europe
- 5.5.2.1 Germany
- 5.5.2.2 United Kingdom
- 5.5.2.3 France
- 5.5.2.4 Italy
- 5.5.2.5 Spain
- 5.5.2.6 Rest of Europe
- 5.5.3 Asia-Pacific
- 5.5.3.1 China
- 5.5.3.2 Japan
- 5.5.3.3 South Korea
- 5.5.3.4 India
- 5.5.3.5 South East Asia
- 5.5.3.6 Rest of Asia-Pacific
- 5.5.4 South America
- 5.5.4.1 Brazil
- 5.5.4.2 Rest of South America
- 5.5.5 Middle East and Africa
- 5.5.5.1 Middle East
- 5.5.5.1.1 United Arab Emirates
- 5.5.5.1.2 Saudi Arabia
- 5.5.5.1.3 Rest of Middle East
- 5.5.5.2 Africa
- 5.5.5.2.1 South Africa
- 5.5.5.2.2 Rest of Africa
- 5.5.5.1 Middle East
- 5.5.1 North America
6 COMPETITIVE LANDSCAPE
- 6.1 Market Concentration
- 6.2 Strategic Moves
- 6.3 Market Share Analysis
- 6.4 Company Profiles (includes Global level Overview, Market level overview, Core Segments, Financials as available, Strategic Information, Market Rank/Share for key companies, Products and Services, and Recent Developments)
- 6.4.1 Yokogawa Test and Measurement Corp.
- 6.4.2 Keysight Technologies Inc.
- 6.4.3 VIAVI Solutions Inc.
- 6.4.4 EXFO Inc.
- 6.4.5 Anritsu Corp.
- 6.4.6 Thorlabs Inc.
- 6.4.7 Coherent (II-VI Inc.)
- 6.4.8 Luna Innovations Inc.
- 6.4.9 Quantifi Photonics Ltd.
- 6.4.10 Apex Technologies
- 6.4.11 Aragon Photonics Labs
- 6.4.12 ID Photonics GmbH
- 6.4.13 VeEX Inc.
- 6.4.14 Timbercon Inc.
- 6.4.15 Optoplex Corp.
- 6.4.16 AMS Technologies AG
- 6.4.17 Bristol Instruments Inc.
- 6.4.18 Advanced Photonix (Luna)
- 6.4.19 Finisar Corp.
- 6.4.20 Spectris PLC
7 MARKET OPPORTUNITIES AND FUTURE OUTLOOK
- 7.1 White-space and Unmet-Need Assessment

 全球光頻譜分析儀市場規模、佔有率、趨勢和成長分析報告(2026-2034)
 超外差頻譜分析儀市場規模、佔有率和成長分析:按系統結構/外形尺寸、頻率性能/頻寬、動態範圍性能、最終用戶產業和地區分類-2026-2033年產業預測
 光頻譜分析儀市場規模、佔有率和趨勢分析報告:按產品類型、模式類型、波長範圍、最終用途、地區和細分市場預測(2026-2033 年)
 全球被動式射頻分析儀、射頻感測和訊號情報市場(至 2032 年):依系統類型(被動式射頻分析儀、訊號情報系統、頻譜監控系統)、平台(地面、車載、背負式、機載)、部署模式和應用分類。
 光學頻譜分析儀市場-2026-2032年全球市場預測
 頻譜分析儀市場:按產品類型、分析儀類型、頻率、技術、最終用戶、國家和地區分類-產業分析、市場規模、市場佔有率和預測(2026-2033 年)光學頻譜分析儀市場:依類型、應用、波長、解析度、國家及地區分類-全球產業分析、市場規模、市場佔有率及2026年至2033年預測
 即時頻譜分析市場規模、佔有率和成長分析:按產品類型、頻寬、技術、應用、最終用戶產業、部署模式和地區分類-2026-2033年產業預測
 頻譜分析儀市場報告:按分析儀類型、產品規格、頻率範圍、設計類型、技術類型、最終用戶產業和地區分類(2026-2034 年)
 2026年全球頻譜分析儀市場報告