


 |
市場調查報告書
商品編碼
2114085
智慧電網數據分析:市場佔有率分析、產業趨勢與統計、成長預測(2026-2031)Smart Grid Data Analytics - Market Share Analysis, Industry Trends & Statistics, Growth Forecasts (2026 - 2031) |
||||||

※ 本網頁內容可能與最新版本有所差異。詳細情況請與我們聯繫。
據 Mordor Intelligence 稱,2025 年智慧電網數據分析市值為 82.5 億美元,預計到 2031 年將達到 161.5 億美元,而 2026 年為 92.3 億美元,預測期(2026-2031 年)的複合年成長率為 11.85%。
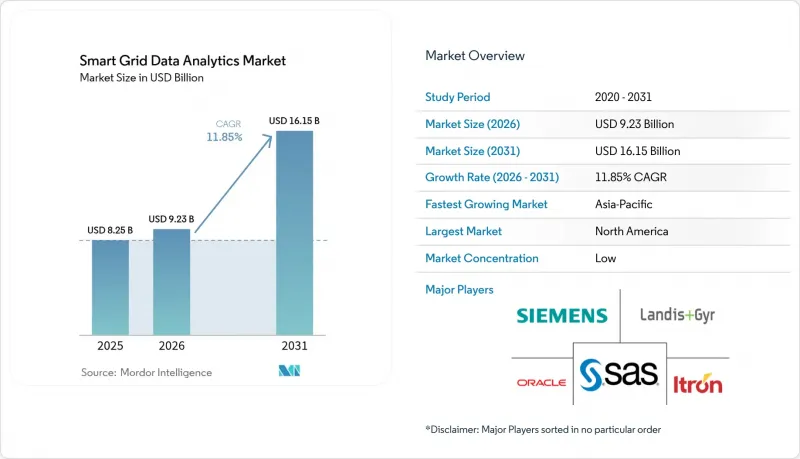
本報告按部署類型(雲端部署和本地部署)、解決方案(輸配電網路、計量分析等)、應用(進階計量基礎設施 (AMI) 分析、需量反應分析等)、最終用戶行業(公共產業和地方政府、私營電力公司等)以及地區進行分類。市場預測以美元計價。
全球智慧電網數據分析市場趨勢及洞察
公共產業公司採用高階計量基礎設施(AMI)正達到關鍵時刻。
隨著高級計量基礎設施(AMI)的全面實施,如今每天都會傳輸數百萬條帶有時間戳的電錶讀數,使電力公司能夠以前所未有的方式了解其低壓電網的運作狀況。德國遠端限電指令的成功率高達98.2%,顯示新一代電錶支援近乎即時的電網干預。因此,電力公司正在擴展其分析引擎,以便每小時從每條饋線採集15萬個資料點,從而預測過載、預防設備故障並最佳化收費系統。先導計畫表明,基於事件的分析將計劃外維護減少了28%,並推遲了400萬美元的資本支出。
遷移到雲端原生網格邊緣分析
將智慧電錶連接到 5G回程傳輸可將延遲降低至個位數毫秒級,使邊緣設備能夠過濾掉噪聲,僅將高價值事件傳輸送到雲端。電力公司無需建造昂貴的資料中心,而是以訂閱方式使用高可用性的處理能力來運行人工智慧模型,從而實現拓撲最佳化和電壓/無功功率控制。西門子已透過將其電網應用整合到安全的雲層中,累計了超過 17 億歐元(18.1 億美元)的軟體收入。
傳統SCADA/MDMS系統互通性的挑戰
電力公司通常營運來自數十家供應商的設備,每家供應商都使用其專有協議。數位化變電站的基準測試揭示了握手問題,迫使營運商購買中間件閘道器,並將整合預算增加了17%。由於電力公司需要測試從邊緣到雲端的資料路徑的確定性效能,因此嚴格的網實整合檢驗需求延長了專案週期。
細分市場分析
預計到2025年,雲端部署將佔智慧電網數據分析市場60.75%的佔有率,到2031年將以12.74%的複合年成長率成長。電力公司優先考慮無需資本投入即可啟動複雜人工智慧工作負載的能力,而超大規模雲端服務供應商則保證多層網路安全和持續的軟體升級。相較之下,當監管機構強制要求資料居住或需要本地運算能力來實現對延遲敏感的饋線自動化時,本地部署仍然普遍存在。西門子電網軟體銷售額已超過18.1億美元,投資正從一次性許可轉向分析即服務(AaaS)訂閱,後者可透過持續的洞察產生收入。
虛擬電廠 (VPP) 的日益普及清晰地表明了雲端模式擴充性。美國能源局已設定目標,到 2030 年實現 80 至 160 吉瓦的 VPP 總裝置容量,而幾乎所有平台都依賴分散式雲端微服務在數百萬台裝置上執行隨機最佳化。隨著這些要求日益嚴格,預計到 2031 年,雲端部署的智慧電網數據分析市場規模將達到 103.5 億美元,是本地部署市場總規模的三倍多。
到2025年,計量分析將佔總收入的39.65%,這反映了公用事業公司傳統上對計費準確性、竊電檢測和分時收費系統的關注。然而,資產和電網邊緣分析的成長速度最快,複合年成長率達13.35%,因為營運商會根據變壓器、重合閘和電力電子設備的狀況來優先安排維護工作。 IBM的研究表明,70%的公共產業已經在使用人工智慧來安排維護工作,這已使計劃外停電減少了23%。
邊緣運算與人工智慧的融合至關重要。目前,感測器整合了輕量級神經網路,用於在本地檢測異常情況,並將高風險事件傳輸至雲端。這種分層架構降低了頻寬成本,同時能夠在不到一秒的時間內完成故障定位。因此,預計到2031年,資產智慧領域的智慧電網數據分析市場規模將達到47.5億美元,佔總支出的29.40%,反映出電網管理正朝著主動式方向發展。
區域分析
預計到2025年,北美將成為智慧電網數據分析市場最大的收入來源,佔36.65%。這得益於其成熟的高級計量基礎設施(AMI)部署、批發市場改革以及鼓勵分散式能源(DER)協調的聯邦投資稅額扣抵。該地區的電力公司正擴大將分析服務訂閱納入收費系統的計費體系,以確保穩定的成本回收。加拿大新建的電池製造人工智慧研發中心進一步加強了區域生態系統,使本地供應商更貼近電動車供應鏈中的關鍵客戶。
亞太地區正經歷最快成長,預計到2031年複合年成長率將達到13.26%。中國國家電網公司正在將分析技術融入其超高壓計畫的各個階段,而印度的「配電部門改革計畫」已撥款400億美元用於饋線數位化。馬來西亞的人工智慧充電試點計畫表明,新興經濟體正在跨越傳統基礎設施,採用雲端原生解決方案。因此,預計到2031年,該地區對智慧電網數據分析市場的貢獻將幾乎加倍,超過44.5億美元。
歐洲正受益於嚴格的脫碳法規和資料空間舉措,這些法規和計劃都強制要求互通性。德國98.2%的基準指令成功率凸顯了歐洲的技術成熟度。南歐對開放能源資料的重視,正促使配電公司採用標準化的分析技術,向第三方服務供應商公開即時指標。
儘管目前來自南美、中東和非洲的合計收入佔有率不足10%,但不斷提高的電氣化率和可再生能源目標正在推動試點部署。智利和阿拉伯聯合大公國的電力公司正在整合基於PMU的分析技術,以穩定太陽能的高普及率,這表明改進的通訊回程傳輸將使這些市場成為供應商拓展業務的理想之地。
其他好處:
- Excel格式的市場預測(ME)表
- 3個月的分析師支持
目錄
第1章:引言
- 研究假設和市場定義
- 調查範圍
第2章:調查方法
第3章執行摘要
第4章 市場狀況
- 市場概覽
- 市場促進因素
- 電力公司在採用 AMI(自動微波整合)方面正處於關鍵時刻。
- 遷移到雲端原生網格邊緣分析
- 輸電系統營運商和配電系統營運商必須提交脫碳報告。
- 分析網路安全措施以符合 NERC-CIP 和 IEC 62443 標準。
- 人工智慧驅動的電動車併網負荷平衡試點項目
- 分散式能源(DER)(太陽能、儲能、虛擬電廠)的即時協調要求
- 市場限制因素
- 傳統SCADA/MDMS系統之間的互通性存在差距
- 本地支線線路分析流量的回程傳輸成本不斷上升。
- DSO與面向客戶的應用程式之間存在資料所有權糾紛
- 公共產業部門高技能分析人員短缺
- 產業價值鏈分析
- 監理情勢
- 技術展望
- 產業吸引力—五力分析
- 新進入者的威脅
- 供應商的議價能力
- 消費者議價能力
- 替代品的威脅
- 競爭公司之間的競爭
- 宏觀經濟因素對市場的影響
第5章 市場規模與成長預測
- 不同的發展
- 基於雲端的
- 現場
- 透過解決方案
- 輸配電網路
- 測量與分析
- 客戶分析
- 資產和電網邊緣分析
- 透過使用
- 先進計量基礎設施(AMI)分析
- 需量反應分析
- 電網最佳化和預測性維護
- 關於可再生能源與電動車融合的預測
- 按最終用戶行業分類
- 公共產業及地方政府
- 私營電力公司(IOU)
- 合作社及地方公共產業
- 大規模能源密集企業
- 按地區
- 北美洲
- 美國
- 加拿大
- 墨西哥
- 南美洲
- 巴西
- 阿根廷
- 智利
- 其他南美國家
- 歐洲
- 德國
- 英國
- 法國
- 義大利
- 西班牙
- 俄羅斯
- 其他歐洲國家
- 亞太地區
- 中國
- 印度
- 日本
- 韓國
- 新加坡
- 馬來西亞
- 澳洲
- 其他亞太國家
- 中東和非洲
- 中東
- 阿拉伯聯合大公國
- 沙烏地阿拉伯
- 土耳其
- 其他中東國家
- 非洲
- 南非
- 奈及利亞
- 其他非洲國家
- 中東
- 北美洲
第6章 競爭情勢
- 市場集中度
- 策略趨勢
- 市佔率分析
- 公司簡介
- Siemens AG
- Itron Inc.
- Landis+Gyr Group AG
- Oracle Corporation
- SAS Institute Inc.
- Schneider Electric SE
- GE Vernova
- IBM Corporation
- Hitachi Energy Ltd.
- AutoGrid Systems Inc.
- Uplight Inc.
- Uptake Technologies Inc.
- Tantalus Systems Corp.
- Amdocs Ltd.
- Sensus USA Inc.(Xylem)
- Honeywell Smart Energy
- Networked Energy Services
- Grid4C Inc.
- Atonix Digital LLC
- Gridspertise Srl
- Tollgrade Communications Inc.
- C3.ai Inc.
- Opower(Oracle Corporation)
- Accenture plc
- Enlit AI Ltd.
第7章 市場機會與未來趨勢
- 評估閒置頻段和未滿足的需求
According to Mordor Intelligence, the smart grid data analytics market size was valued at USD 8.25 billion in 2025 and estimated to grow from USD 9.23 billion in 2026 to reach USD 16.15 billion by 2031, at a CAGR of 11.85% during the forecast period (2026-2031).
This report is Segmented by Deployment (Cloud-Based and On-Premise), Solution (Transmission and Distribution Network, Metering Analytics, and More), Application (Advanced Metering Infrastructure Analysis, Demand Response Analysis, and More), End-User Vertical (Public Utilities and Municipalities, Investor-Owned Utilities, and More), and Geography. The Market Forecasts are Provided in Terms of Value (USD).
Global Smart Grid Data Analytics Market Trends and Insights
Utility AMI Roll-outs Hitting Critical Mass
Comprehensive AMI deployments now stream millions of time-stamped meter readings daily, giving utilities unprecedented visibility into low-voltage networks. Germany's 98.2% success rate in remote power-limitation commands proved that next-generation meters support near-real-time grid interventions. Utilities are therefore scaling analytics engines that ingest 150,000 data points per hour per feeder to predict overloads, preempt equipment failures, and refine tariff structures. A pilot across 20 substations and 184 feeders demonstrated that event-based analytics trimmed unscheduled maintenance by 28% and deferred USD 4 million in capex.
Shift to Cloud-Native Grid-Edge Analytics
Connecting smart meters to 5G backhaul cuts latency to single-digit milliseconds, enabling edge devices to filter noise and forward only high-value events to the cloud. Utilities avoid building costly data centers and instead subscribe to elastic processing power that runs AI models for topology optimization or volt-var control. Siemens already books over EUR 1.7 billion (USD 1.81 billion) in software-centric revenue by bundling its grid applications into a secure cloud layer.
Legacy SCADA/MDMS Interoperability Gaps
Utilities often operate devices from dozens of vendors, each using proprietary protocols. Bench tests on digital substations uncovered handshake issues that forced operators to purchase middleware gateways, inflating integration budgets by 17%. The need for rigorous cyber-physical validation extends project timelines as utilities test edge-to-cloud data paths for deterministic performance.
Other drivers and restraints analyzed in the detailed report include:
- Mandatory Decarbonization Reporting by TSOs and DSOs
- AI-Optimized EV-to-Grid Load Balancing Pilots
- Rising Analytics-Traffic Backhaul Costs in Rural Feeders
For complete list of drivers and restraints, kindly check the Table Of Contents.
Segment Analysis
Cloud deployments captured 60.75% of the smart grid data analytics market in 2025 and are forecast to grow at 12.74% CAGR to 2031. Utilities value the ability to spin up advanced AI workloads without capital outlays, while hyperscale providers guarantee multilayer cybersecurity and continuous software upgrades. In contrast, on-premise deployments persist where regulators mandate data residency or where latency-sensitive feeder automation requires local compute. As Siemens' grid-software revenue already surpasses USD 1.81 billion, investment is shifting toward "analytics-as-a-service" subscriptions that monetize continuous insights rather than one-time licenses.
Growing adoption of virtual power plants (VPPs) illustrates why the cloud model scales better. The U.S. Department of Energy targets 80-160 GW of aggregated VPP capacity by 2030, and nearly every platform relies on distributed cloud microservices to run stochastic optimization across millions of devices. As those requirements intensify, the smart grid data analytics market size for cloud deployment is projected to capture USD 10.35 billion by 2031, more than tripling the on-premise total.
Metering analytics represented 39.65% revenue in 2025, reflecting utilities' historic focus on billing accuracy, theft detection, and time-of-use tariff design. Yet, asset and grid-edge analytics is the fastest climber at 13.35% CAGR as operators prioritize condition-based maintenance for transformers, reclosers, and power electronics. IBM's survey shows 70% of digitally mature utilities already use AI to schedule maintenance windows, cutting forced outages by 23%.
The convergence of edge computing and AI is key: sensors now embed lightweight neural networks that flag anomalies locally, forwarding only high-risk events to the cloud. This tiered architecture lowers bandwidth bills while enabling sub-second fault isolation. Consequently, the smart grid data analytics market size for asset intelligence is forecast to reach USD 4.75 billion by 2031, representing 29.40% of total spending and reflecting the shift toward proactive grid stewardship.
Complete Report Scope:
- By Deployment
- Cloud-based
- On-premise
- By Solution
- Transmission and Distribution Network
- Metering Analytics
- Customer Analytics
- Asset and Grid-Edge Analytics
- By Application
- Advanced Metering Infrastructure Analysis
- Demand Response Analysis
- Grid Optimisation and Predictive Maintenance
- Renewable and EV Integration Forecasting
- By End-user Vertical
- Public Utilities and Municipalities
- Investor-Owned Utilities (IOUs)
- Cooperative and Community Utilities
- Large Energy-Intensive Enterprises
- By Geography
- North America
- United States
- Canada
- Mexico
- South America
- Brazil
- Argentina
- Chile
- Rest of South America
- Europe
- Germany
- United Kingdom
- France
- Italy
- Spain
- Russia
- Rest of Europe
- Asia-Pacific
- China
- India
- Japan
- South Korea
- Singapore
- Malaysia
- Australia
- Rest of Asia-Pacific
- Middle East and Africa
- Middle East
- United Arab Emirates
- Saudi Arabia
- Turkey
- Rest of Middle East
- Africa
- South Africa
- Nigeria
- Rest of Africa
- Middle East
- North America
Geography Analysis
North America generated the largest revenue, holding 36.65% of the smart grid data analytics market in 2025, due to mature AMI roll-outs, wholesale market reforms, and federal investment tax credits that reward DER orchestration. Utilities here increasingly bundle analytics subscriptions into rate-based filings, ensuring stable cost recovery. Canada's new AI R&D hub for battery manufacturing further strengthens the regional ecosystem, positioning local vendors near key EV-supply-chain customers.
Asia-Pacific is the fastest mover with a projected 13.26% CAGR to 2031. China's State Grid Corporation embeds analytics in every phase of its ultra-high-voltage projects, while India's Revamped Distribution Sector Scheme allocates USD 40 billion to digitalize feeders. Malaysia's AI-based charging pilots illustrate how emerging economies leapfrog legacy infrastructure to adopt cloud-native solutions. Consequently, the region's contribution to the smart grid data analytics market size will nearly double by 2031, surpassing USD 4.45 billion.
Europe benefits from stringent decarbonization rules and data-space initiatives that mandate interoperability. Germany's 98.2% command-success benchmark validates continent-wide technical maturity. Southern Europe's emphasis on open energy data is pushing distribution companies to adopt standardized analytics that expose real-time metrics to third-party service providers.
South America and the Middle East, and Africa collectively represent under 10% of revenue today, but rising electrification and renewable targets are catalyzing pilot deployments. Utilities in Chile and the United Arab Emirates now integrate PMU-based analytics to stabilize high solar penetration, signaling fertile ground for vendor expansion once telecom backhaul improves.
- Siemens AG
- Itron Inc.
- Landis + Gyr Group AG
- Oracle Corporation
- SAS Institute Inc.
- Schneider Electric SE
- GE Vernova
- IBM Corporation
- Hitachi Energy Ltd.
- AutoGrid Systems Inc.
- Uplight Inc.
- Uptake Technologies Inc.
- Tantalus Systems Corp.
- Amdocs Ltd.
- Sensus USA Inc. (Xylem)
- Honeywell Smart Energy
- Networked Energy Services
- Grid4C Inc.
- Atonix Digital LLC
- Gridspertise S.r.l.
- Tollgrade Communications Inc.
- C3.ai Inc.
- Opower (Oracle Corporation)
- Accenture plc
- Enlit AI Ltd.
Additional Benefits:
- The market estimate (ME) sheet in Excel format
- 3 months of analyst support
TABLE OF CONTENTS
1 INTRODUCTION
- 1.1 Study Assumptions and Market Definition
- 1.2 Scope of the Study
2 RESEARCH METHODOLOGY
3 EXECUTIVE SUMMARY
4 MARKET LANDSCAPE
- 4.1 Market Overview
- 4.2 Market Drivers
- 4.2.1 Utility AMI roll-outs hitting critical mass
- 4.2.2 Shift to cloud-native grid-edge analytics
- 4.2.3 Mandatory decarbonisation reporting by TSOs and DSOs
- 4.2.4 Cyber-secure analytics for NERC-CIP and IEC 62443 compliance
- 4.2.5 AI-optimised EV-to-Grid load balancing pilots
- 4.2.6 Real-time DER orchestration requirements (solar, storage, VPPs)
- 4.3 Market Restraints
- 4.3.1 Legacy SCADA/MDMS interoperability gaps
- 4.3.2 Rising analytics-traffic backhaul costs in rural feeders
- 4.3.3 Data-ownership disputes between DSOs and customer apps
- 4.3.4 Shortage of advanced analytics talent at utilities
- 4.4 Industry Value Chain Analysis
- 4.5 Regulatory Landscape
- 4.6 Technological Outlook
- 4.7 Industry Attractiveness - Porter's Five Forces Analysis
- 4.7.1 Threat of New Entrants
- 4.7.2 Bargaining Power of Suppliers
- 4.7.3 Bargaining Power of Consumers
- 4.7.4 Threat of Substitutes
- 4.7.5 Intensity of Competitive Rivalry
- 4.8 Impact of Macroeconomic Factors on the Market
5 MARKET SIZE AND GROWTH FORECASTS (VALUES)
- 5.1 By Deployment
- 5.1.1 Cloud-based
- 5.1.2 On-premise
- 5.2 By Solution
- 5.2.1 Transmission and Distribution Network
- 5.2.2 Metering Analytics
- 5.2.3 Customer Analytics
- 5.2.4 Asset and Grid-Edge Analytics
- 5.3 By Application
- 5.3.1 Advanced Metering Infrastructure Analysis
- 5.3.2 Demand Response Analysis
- 5.3.3 Grid Optimisation and Predictive Maintenance
- 5.3.4 Renewable and EV Integration Forecasting
- 5.4 By End-user Vertical
- 5.4.1 Public Utilities and Municipalities
- 5.4.2 Investor-Owned Utilities (IOUs)
- 5.4.3 Cooperative and Community Utilities
- 5.4.4 Large Energy-Intensive Enterprises
- 5.5 By Geography
- 5.5.1 North America
- 5.5.1.1 United States
- 5.5.1.2 Canada
- 5.5.1.3 Mexico
- 5.5.2 South America
- 5.5.2.1 Brazil
- 5.5.2.2 Argentina
- 5.5.2.3 Chile
- 5.5.2.4 Rest of South America
- 5.5.3 Europe
- 5.5.3.1 Germany
- 5.5.3.2 United Kingdom
- 5.5.3.3 France
- 5.5.3.4 Italy
- 5.5.3.5 Spain
- 5.5.3.6 Russia
- 5.5.3.7 Rest of Europe
- 5.5.4 Asia-Pacific
- 5.5.4.1 China
- 5.5.4.2 India
- 5.5.4.3 Japan
- 5.5.4.4 South Korea
- 5.5.4.5 Singapore
- 5.5.4.6 Malaysia
- 5.5.4.7 Australia
- 5.5.4.8 Rest of Asia-Pacific
- 5.5.5 Middle East and Africa
- 5.5.5.1 Middle East
- 5.5.5.1.1 United Arab Emirates
- 5.5.5.1.2 Saudi Arabia
- 5.5.5.1.3 Turkey
- 5.5.5.1.4 Rest of Middle East
- 5.5.5.2 Africa
- 5.5.5.2.1 South Africa
- 5.5.5.2.2 Nigeria
- 5.5.5.2.3 Rest of Africa
- 5.5.5.1 Middle East
- 5.5.1 North America
6 COMPETITIVE LANDSCAPE
- 6.1 Market Concentration
- 6.2 Strategic Moves
- 6.3 Market Share Analysis
- 6.4 Company Profiles (includes Global level Overview, Market level overview, Core Segments, Financials as available, Strategic Information, Market Rank/Share for key companies, Products and Services, and Recent Developments)
- 6.4.1 Siemens AG
- 6.4.2 Itron Inc.
- 6.4.3 Landis + Gyr Group AG
- 6.4.4 Oracle Corporation
- 6.4.5 SAS Institute Inc.
- 6.4.6 Schneider Electric SE
- 6.4.7 GE Vernova
- 6.4.8 IBM Corporation
- 6.4.9 Hitachi Energy Ltd.
- 6.4.10 AutoGrid Systems Inc.
- 6.4.11 Uplight Inc.
- 6.4.12 Uptake Technologies Inc.
- 6.4.13 Tantalus Systems Corp.
- 6.4.14 Amdocs Ltd.
- 6.4.15 Sensus USA Inc. (Xylem)
- 6.4.16 Honeywell Smart Energy
- 6.4.17 Networked Energy Services
- 6.4.18 Grid4C Inc.
- 6.4.19 Atonix Digital LLC
- 6.4.20 Gridspertise S.r.l.
- 6.4.21 Tollgrade Communications Inc.
- 6.4.22 C3.ai Inc.
- 6.4.23 Opower (Oracle Corporation)
- 6.4.24 Accenture plc
- 6.4.25 Enlit AI Ltd.
7 MARKET OPPORTUNITIES AND FUTURE TRENDS
- 7.1 White-Space and Unmet-Need Assessment

 2026-2034年全球人工智慧市場規模、佔有率、趨勢和成長分析報告(電力系統管理)
 2034年智慧電網人工智慧市場預測-全球分析(按組件、人工智慧技術、部署模型、電網層、應用、公用事業功能、資料來源、電網類型、企業規模、最終用戶和地區分類)頻率調節市場預測至2034年-按調節類型、控制機制、技術、應用、最終用戶和地區分類的全球分析
 人工智慧在電網管理的應用:市場機會、成長要素、產業趨勢分析及2026-2035年預測
 網格最佳化解決方案市場規模、佔有率和成長分析:按解決方案、技術、最終用戶、部署類型和地區分類-2026-2033年產業預測
 智慧電網數據分析市場:按部署類型、應用、解決方案、最終用戶產業和地區分類
 2026年智慧電網巨量資料分析全球市場報告
 網格最佳化解決方案市場報告:按類型、應用和地區分類 2026-2034 年2026年全球網格分析軟體市場報告2026年全球電網邊緣相位辨識分析市場報告