


 |
市場調查報告書
商品編碼
2113935
深度學習:市場佔有率分析、產業趨勢與統計、成長預測(2026-2031)Deep Learning - Market Share Analysis, Industry Trends & Statistics, Growth Forecasts (2026 - 2031) |
||||||

※ 本網頁內容可能與最新版本有所差異。詳細情況請與我們聯繫。
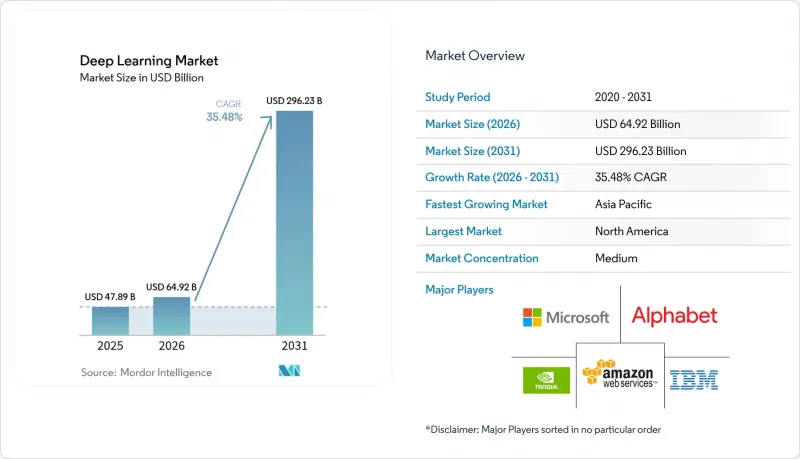
據 Mordor Intelligence 稱,2025 年深度學習市場價值 478.9 億美元,預計到 2031 年將達到 2962.3 億美元,而 2026 年為 649.2 億美元,預測期(2026-2031 年)複合年成長率為 35.48%。
本報告按交付方式(硬體、軟體、服務)、最終用戶產業(銀行、金融服務和保險、零售/電子商務、製造業等)、應用領域(影像/影片辨識、語音辨識、自然語言處理/文字分析等)、部署方式(雲端、本地部署)和地區(北美、南美等)進行細分。市場預測以美元計價。
全球深度學習市場趨勢與洞察
非結構化資料量呈爆炸性成長
企業每天產生 2.5 兆位元組的訊息,其中約 80% 的資料仍為非結構化資料。光學神經網路處理器如今的處理能力已達每秒 1.57 千兆次運算,能夠對自主系統和工業監控中的影片、音訊和文字進行即時分析。金融機構報告稱,衛星影像和社群媒體情緒分析等替代資料饋送的數量增加了 300%,這需要能夠分析不同資訊來源之間相關性的專用模型。隨著企業從批量分析轉向低延遲推理,邊緣運算的採用率比去年同期成長了 34%。由此產生的回饋循環在提高模型精度的同時,也擴展了可處理的工作負載。
AI加速器:降低成本並顯著提升效能
先進的3奈米製程、堆疊式HBM記憶體和光子互連技術每年可降低40%的運算成本。 NVIDIA的「Blackwell Ultra」性能是其前代產品的1.5倍。 AMD的MI350系列吞吐量是上一代晶片的35倍。這些突破使得即使是中型企業也能在單節點系統上運行1000億參數模型,而無需分散式叢集。資本支出的減少擴大了基本客群,採購週期的縮短使得硬體成為深度學習市場中成長最快的領域。
高能耗和冷氣成本
預計到2025年,人工智慧叢集的能耗將達到46-82太瓦時(TWh),2030年可能會增加至1,050太瓦時。目前,單次訓練運行的耗電量高達兆瓦時,配備GPU的機架需要40-140千瓦的功率,而普通伺服器僅需10千瓦。直接液冷和浸沒式液冷會使資本投資成本增加15-20%,而可再生能源供應的波動性也帶來了可靠性方面的挑戰。目前,能源成本佔人工智慧總擁有成本的40%之多,這迫使買家在擴大規模之前仔細考慮電費和碳排放目標。
細分市場分析
受GPU、客製化ASIC和晶圓級引擎需求的驅動,硬體市場預計到2031年將達到36.1%的複合年成長率。 NVIDIA的GB10 Grace Blackwell超級晶片被應用於售價3000美元的個人AI工作站,能夠處理包含2000億個參數的模型。 Cerebras Systems在其晶圓級平台上實現了每秒1500個令牌的推理處理速度,與傳統GPU叢集相比,速度提升了57倍。電信業者、汽車OEM廠商和雲端服務供應商正在採用這些加速器來減少面積和能耗。新創公司則利用資本支出(Capex)的降低,開發產業專用的解決方案原型,並加快特定產業應用的上市速度。
軟體和服務仍然佔據收入的大部分,因為經常性訂閱、託管平台和整合專案能夠產生可預測的現金流。醫療保健、金融和製造業等垂直行業的基礎設施模式正在推動服務需求,因為客戶需要領域專業知識。雲端供應商正在將模型即服務 (MaaS) 產品與編配工具捆綁在一起,使企業能夠避免基礎設施管理的負擔。諮詢支援對於客製化至關重要,儘管硬體成長在百分比上超過了諮詢行業,但諮詢行業仍然保持著兩位數的成長。硬體創新和軟體貨幣化之間的協同作用確保了深度學習市場的均衡擴張。
到2025年,銀行、金融和保險(BFSI)產業正利用詐欺偵測、風險建模和演算法交易,力求佔據深度學習市場24.12%的佔有率。各大銀行正在部署基於變壓器的客戶服務代理,在首次聯繫時即可解決70%的諮詢,從而提高客戶滿意度並降低成本。支付網路正在將異常偵測功能整合到串流資料中,在毫秒內攔截非法貿易。
醫療和生命科學領域以36.75%的複合年成長率領先,主要得益於診斷技術核准數量的激增。曾經需要人工驗證的放射診斷工作流程如今實現了即時分診,基因組負責人利用基礎模型在數週而非數月內識別出有前景的藥物標靶。醫院正在部署隱私保護型聯邦學習技術,以保護病患記錄並滿足監管和保險要求。製藥公司正在投資人工智慧驅動的蛋白質折疊和模擬工具,以加速臨床試驗進程。這一發展勢頭正使醫療保健產業成為深度學習市場的重要收入來源。
區域分析
到2025年,北美將佔據深度學習市場32.12%的佔有率。隨著台積電投資1,650億美元擴建其位於亞利桑那州的工廠以降低供應鏈風險,半導體製造業正在國內擴張。加拿大正利用其強大的研發能力扶持自然語言處理(NLP)新創企業的孵化,而墨西哥則正在成為人工智慧硬體的近岸組裝中心。區域電網,尤其是維吉尼亞和德克薩斯州的電網,正努力應對高達140千瓦的機架式設備,促使電力公司加快可再生能源發電能力的擴張。
亞太地區正經歷最快的成長,預計複合年成長率將達到35.92%。印度正透過建立國家人工智慧中心,為新創公司提供補貼運算資源,掀起金融科技和農業技術解決方案的浪潮。日本正利用其機器人技術傳統,將服務型機器人商業化,以因應老齡化社會的需求;韓國則將其在5G領域的領先地位與智慧工廠中邊緣人工智慧的部署相結合。在澳大利亞,自動駕駛礦用卡車正在進行試點;東南亞的電商公司正在利用建議引擎來觸及其龐大的行動用戶群。這些多元化的應用案例支撐著該地區對深度學習解決方案的持續需求。
儘管歐盟人工智慧法案帶來了沉重的合規負擔,違規者可能面臨高達全球銷售額3%的罰款,但歐洲仍在穩步推進人工智慧發展。德國汽車製造商正將解釋人工智慧整合到安全至關重要的電動車的感測功能中,義大利機械製造商則正在應用預測性維護分析技術。北歐國家正利用水力和風能資源為資料中心運作,並部署碳中和人工智慧服務,以滿足具有永續性意識的客戶的需求。英國正在實施靈活的脫歐後框架,吸引尋求進入歐洲和英聯邦市場的美國和亞洲公司。所有這些發展共同推動歐洲成為負責任且節能的深度學習市場成長中心。
其他好處:
- Excel格式的市場預測(ME)表
- 3個月的分析師支持
目錄
第1章:引言
- 研究假設和市場定義
- 調查範圍
第2章:調查方法
第3章執行摘要
第4章 市場狀況
- 市場概覽
- 市場促進因素
- 非結構化資料量的爆炸性成長
- AI加速器成本更低,效能顯著提升
- 面向消費者的深度學習整合(語音、影像、物聯網)
- 醫學影像和診斷技術的應用正在迅速成長。
- 針對特定產業的利基市場開發基礎模型
- 邊緣/裝置端下載,實現隱私保護和超低延遲
- 市場限制因素
- 高能耗和冷氣成本
- 專業DL人員短缺
- 加強全球人工智慧監管(例如,歐盟人工智慧法)
- 關於培訓資料的智慧財產權/版權責任
- 供應鏈分析
- 監理情勢
- 技術展望
- 波特五力分析
- 供應商的議價能力
- 買方的議價能力
- 新進入者的威脅
- 替代品的威脅
- 競爭公司之間的競爭
- 對影響市場的宏觀經濟因素進行評估
第5章 市場規模與成長預測
- 以規定形式
- 硬體
- 軟體服務
- 按最終用戶行業分類
- BFSI
- 零售與電子商務
- 製造業
- 醫療保健和生命科學
- 汽車和運輸業
- 通訊與媒體
- 安全監控
- 其他用途
- 透過使用
- 圖像和影片識別
- 語音辨識
- 自然語言處理和文本分析
- 自主系統與機器人
- 預測分析和預測
- 其他用途
- 按實現類型
- 雲
- 現場
- 按地區
- 北美洲
- 美國
- 加拿大
- 墨西哥
- 南美洲
- 巴西
- 阿根廷
- 其他南美國家
- 歐洲
- 德國
- 英國
- 法國
- 義大利
- 西班牙
- 俄羅斯
- 其他歐洲國家
- 亞太地區
- 中國
- 日本
- 印度
- 韓國
- 澳洲
- 其他亞太國家
- 中東和非洲
- 中東
- 沙烏地阿拉伯
- 阿拉伯聯合大公國
- 土耳其
- 其他中東國家
- 非洲
- 南非
- 奈及利亞
- 埃及
- 其他非洲國家
- 中東
- 北美洲
第6章 競爭情勢
- 市場集中度
- 策略趨勢
- 市佔率分析
- 公司簡介
- NVIDIA Corporation
- Google LLC(Alphabet)
- Amazon Web Services, Inc.
- Microsoft Corporation
- IBM Corporation
- Meta Platforms, Inc.
- Intel Corporation
- Advanced Micro Devices, Inc.
- SAS Institute Inc.
- RapidMiner, Inc.
- Baidu, Inc.
- Qualcomm Technologies, Inc.
- Huawei Technologies Co., Ltd.
- Graphcore Ltd.
- Cerebras Systems, Inc.
- Xilinx(part of AMD)
- Samsung Electronics Co., Ltd.
- Oracle Corporation
- H2O.ai
- Databricks, Inc.
- SenseTime Group
- OpenAI LP
- Tesla, Inc.
- NEC Corporation
- Darktrace plc
第7章 市場機會與未來展望
According to Mordor Intelligence, the deep learning market size was valued at USD 47.89 billion in 2025 and estimated to grow from USD 64.92 billion in 2026 to reach USD 296.23 billion by 2031, at a CAGR of 35.48% during the forecast period (2026-2031).
This report is Segmented by Offering (Hardware, Software, and Services), End User Industry (BFSI, Retail and ECommerce, Manufacturing, and More), Application (Image and Video Recognition, Speech and Voice Recognition, NLP and Text Analytics, and More), Deployment (Cloud, and On-Premises), and by Geography (North America, South America, and More). The Market Forecasts are Provided in Terms of Value (USD).
Global Deep Learning Market Trends and Insights
Explosive Growth in Unstructured Data Volumes
Every day enterprises generate 2.5 quintillion bytes of information, and roughly 80% of that data remains unstructured. Optical neural processors now reach 1.57 peta-operations per second, enabling real-time video, audio, and text analysis for autonomous systems and industrial monitoring. Financial institutions report a 300% increase in alternative data feeds, including satellite imagery and social sentiment, which demands specialized models able to correlate disparate sources. Edge computing deployments rise 34% year over year as firms shift from batch analytics to low-latency inference. The resulting feedback loop boosts model accuracy while expanding addressable workloads.
Declining Cost and Performance Leap of AI Accelerators
Advanced 3-nanometer designs, stacked HBM memory, and photonic interconnects push compute costs down by 40% annually. NVIDIA's Blackwell Ultra delivers 1.5X performance over its prior generation. AMD's MI350 series posts 35X throughput gains versus earlier chips . These leaps allow mid-market companies to run 100-billion-parameter models on single-node systems instead of distributed clusters. Lower capital outlays widen the customer base and shorten procurement cycles, turning hardware into the fastest-growing deep learning market segment.
High Energy Footprint and Cooling Costs
AI clusters are projected to consume 46-82 TWh in 2025 and could rise to 1,050 TWh by 2030. Individual training runs now draw megawatt-hours of power, and racks outfitted for GPUs require 40-140 kW versus 10 kW for typical servers. Direct-liquid and immersion cooling add 15-20% to capital costs, while fluctuating renewable supply creates reliability challenges. Energy now represents up to 40% of total AI ownership costs, forcing buyers to weigh electricity tariffs and carbon objectives before scaling.
Other drivers and restraints analyzed in the detailed report include:
- Consumer-Grade DL Integration
- Medical-Imaging and Diagnostics Adoption Surge
- Scarcity of Specialized DL Talent
For complete list of drivers and restraints, kindly check the Table Of Contents.
Segment Analysis
Hardware posted a 36.1% CAGR forecast through 2031, propelled by demand for GPUs, custom ASICs, and wafer-scale engines. NVIDIA's GB10 Grace Blackwell superchip powers personal AI stations priced at USD 3,000 that can handle 200-billion-parameter models . Cerebras Systems demonstrates inference at 1,500 tokens per second on its wafer-scale platform, representing a 57-fold speed improvement over legacy GPU clusters. Telecommunication operators, automotive OEMs, and cloud providers adopt these accelerators to shrink floor space and energy consumption. Start-ups leverage lower capex to prototype vertical solutions, narrowing time-to-market for industry-specific applications.
Software and Services still command most revenues because recurring subscriptions, managed platforms, and integration projects generate predictable cash-flows. Vertical foundation models for healthcare, finance, and manufacturing drive service demand as clients seek domain expertise. Cloud vendors bundle model-as-a-service offerings with orchestration tools, letting enterprises avoid infrastructure management. Customization mandates consulting help, sustaining double-digit growth even as hardware outpaces in percentage terms. The symbiosis between hardware innovation and software monetization ensures balanced expansion across the deep learning market.
BFSI controlled 24.12% of deep learning market share in 2025, leveraging fraud detection, risk modeling, and algorithmic trading. Large banks integrate transformer-based customer-service agents that resolve 70% of queries on first contact, raising satisfaction scores and trimming costs. Payment networks embed anomaly detection on streaming data to block fraudulent transactions within milliseconds.
Healthcare and Life Sciences display the fastest 36.75% CAGR as diagnostic approvals surge. Radiology workflows that once required manual review now achieve instant triage, while genomic analysts deploy foundation models to identify promising drug targets in weeks instead of months. Hospitals adopt privacy-preserving federated learning to safeguard patient records, satisfying regulators and insurance providers. Pharmaceutical firms invest in AI-driven protein-folding and simulation tools, accelerating clinical trial timelines. This momentum positions healthcare as a pivotal revenue engine for the deep learning market.
Complete Report Scope:
- By Offering
- Hardware
- Software and Services
- By End-user Industry
- BFSI
- Retail and eCommerce
- Manufacturing
- Healthcare and Life Sciences
- Automotive and Transportation
- Telecom and Media
- Security and Surveillance
- Other Applications
- By Application
- Image and Video Recognition
- Speech and Voice Recognition
- NLP and Text Analytics
- Autonomous Systems and Robotics
- Predictive Analytics and Forecasting
- Other Applications
- By Deployment Mode
- Cloud
- On-Premise
- By Geography
- North America
- United States
- Canada
- Mexico
- South America
- Brazil
- Argentina
- Rest of South America
- Europe
- Germany
- United Kingdom
- France
- Italy
- Spain
- Russia
- Rest of Europe
- Asia-Pacific
- China
- Japan
- India
- South Korea
- Australia
- Rest of Asia-Pacific
- Middle East and Africa
- Middle East
- Saudi Arabia
- United Arab Emirates
- Turkey
- Rest of Middle East
- Africa
- South Africa
- Nigeria
- Egypt
- Rest of Africa
- Middle East
- North America
Geography Analysis
North America held 32.12% of the deep learning market in 2025, semiconductor fabrication expands domestically as TSMC invests USD 165 billion in Arizona plants, reducing supply-chain risk. Canada capitalizes on research excellence to spin out NLP start-ups, while Mexico becomes a near-shore assembly base for AI hardware. Regional energy grids, especially in Virginia and Texas, struggle to accommodate racks drawing up to 140 kW, prompting utilities to accelerate renewable capacity.
Asia-Pacific is the fastest climber with a 35.92% CAGR forecas. India implements national AI centers that offer subsidized compute credits to start-ups, spawning a wave of fintech and agritech solutions. Japan leverages robotics heritage to commercialize service robots for aging populations, while South Korea couples 5G leadership with edge AI deployments in smart factories. Australia experiments with autonomous mining trucks, and Southeast Asian e-commerce firms apply recommendation engines to vast mobile consumer bases. The diversity of use cases underpins sustained regional demand for deep learning solutions.
Europe advances at a steady pace despite compliance overhead from the EU AI Act, which can impose fines up to 3% of global turnover for violations. German automakers integrate explainable AI for safety-critical perception in electric vehicles, while Italian machinery makers embed predictive maintenance analytics. Nordic countries power data centers with hydro and wind resources, marketing carbon-neutral AI services that appeal to sustainability-minded clients. The United Kingdom operates a flexible post-Brexit framework, attracting US and Asian firms seeking access to both European and Commonwealth markets. Collectively, these dynamics position Europe as a hub for responsible and energy-efficient deep learning market growth.
- NVIDIA Corporation
- Google LLC (Alphabet)
- Amazon Web Services, Inc.
- Microsoft Corporation
- IBM Corporation
- Meta Platforms, Inc.
- Intel Corporation
- Advanced Micro Devices, Inc.
- SAS Institute Inc.
- RapidMiner, Inc.
- Baidu, Inc.
- Qualcomm Technologies, Inc.
- Huawei Technologies Co., Ltd.
- Graphcore Ltd.
- Cerebras Systems, Inc.
- Xilinx (part of AMD)
- Samsung Electronics Co., Ltd.
- Oracle Corporation
- H2O.ai
- Databricks, Inc.
- SenseTime Group
- OpenAI LP
- Tesla, Inc.
- NEC Corporation
- Darktrace plc
Additional Benefits:
- The market estimate (ME) sheet in Excel format
- 3 months of analyst support
TABLE OF CONTENTS
1 INTRODUCTION
- 1.1 Study Assumptions and Market Definition
- 1.2 Scope of the Study
2 RESEARCH METHODOLOGY
3 EXECUTIVE SUMMARY
4 MARKET LANDSCAPE
- 4.1 Market Overview
- 4.2 Market Drivers
- 4.2.1 Explosive growth in unstructured data volumes
- 4.2.2 Declining cost and performance leap of AI accelerators
- 4.2.3 Consumer grade DL integration (voice, vision, IoT)
- 4.2.4 Medical-imaging and diagnostics adoption surge
- 4.2.5 Vertical foundation models unlocking niche markets
- 4.2.6 Edge/on-device DL for privacy and ultra-low latency
- 4.3 Market Restraints
- 4.3.1 High energy footprint and cooling costs
- 4.3.2 Scarcity of specialised DL talent
- 4.3.3 Tightening global AI regulation (e.g., EU AI Act)
- 4.3.4 IP/copyright liability for training data
- 4.4 Supply Chain Analysis
- 4.5 Regulatory Landscape
- 4.6 Technological Outlook
- 4.7 Porter's Five Force Analysis
- 4.7.1 Bargaining Power of Suppliers
- 4.7.2 Bargaining Power of Buyers
- 4.7.3 Threat of New Entrants
- 4.7.4 Threat of Substitutes
- 4.7.5 Intensity of Competitive Rivalry
- 4.8 Assesment of Macroeconomic Factors on the market
5 MARKET SIZE AND GROWTH FORECASTS (VALUE)
- 5.1 By Offering
- 5.1.1 Hardware
- 5.1.2 Software and Services
- 5.2 By End-user Industry
- 5.2.1 BFSI
- 5.2.2 Retail and eCommerce
- 5.2.3 Manufacturing
- 5.2.4 Healthcare and Life Sciences
- 5.2.5 Automotive and Transportation
- 5.2.6 Telecom and Media
- 5.2.7 Security and Surveillance
- 5.2.8 Other Applications
- 5.3 By Application
- 5.3.1 Image and Video Recognition
- 5.3.2 Speech and Voice Recognition
- 5.3.3 NLP and Text Analytics
- 5.3.4 Autonomous Systems and Robotics
- 5.3.5 Predictive Analytics and Forecasting
- 5.3.6 Other Applications
- 5.4 By Deployment Mode
- 5.4.1 Cloud
- 5.4.2 On-Premise
- 5.5 By Geography
- 5.5.1 North America
- 5.5.1.1 United States
- 5.5.1.2 Canada
- 5.5.1.3 Mexico
- 5.5.2 South America
- 5.5.2.1 Brazil
- 5.5.2.2 Argentina
- 5.5.2.3 Rest of South America
- 5.5.3 Europe
- 5.5.3.1 Germany
- 5.5.3.2 United Kingdom
- 5.5.3.3 France
- 5.5.3.4 Italy
- 5.5.3.5 Spain
- 5.5.3.6 Russia
- 5.5.3.7 Rest of Europe
- 5.5.4 Asia-Pacific
- 5.5.4.1 China
- 5.5.4.2 Japan
- 5.5.4.3 India
- 5.5.4.4 South Korea
- 5.5.4.5 Australia
- 5.5.4.6 Rest of Asia-Pacific
- 5.5.5 Middle East and Africa
- 5.5.5.1 Middle East
- 5.5.5.1.1 Saudi Arabia
- 5.5.5.1.2 United Arab Emirates
- 5.5.5.1.3 Turkey
- 5.5.5.1.4 Rest of Middle East
- 5.5.5.2 Africa
- 5.5.5.2.1 South Africa
- 5.5.5.2.2 Nigeria
- 5.5.5.2.3 Egypt
- 5.5.5.2.4 Rest of Africa
- 5.5.5.1 Middle East
- 5.5.1 North America
6 COMPETITIVE LANDSCAPE
- 6.1 Market Concentration
- 6.2 Strategic Moves
- 6.3 Market Share Analysis
- 6.4 Company Profiles (includes Global level Overview, Market level overview, Core Segments, Financials as available, Strategic Information, Market Rank/Share for key companies, Products and Services, and Recent Developments)
- 6.4.1 NVIDIA Corporation
- 6.4.2 Google LLC (Alphabet)
- 6.4.3 Amazon Web Services, Inc.
- 6.4.4 Microsoft Corporation
- 6.4.5 IBM Corporation
- 6.4.6 Meta Platforms, Inc.
- 6.4.7 Intel Corporation
- 6.4.8 Advanced Micro Devices, Inc.
- 6.4.9 SAS Institute Inc.
- 6.4.10 RapidMiner, Inc.
- 6.4.11 Baidu, Inc.
- 6.4.12 Qualcomm Technologies, Inc.
- 6.4.13 Huawei Technologies Co., Ltd.
- 6.4.14 Graphcore Ltd.
- 6.4.15 Cerebras Systems, Inc.
- 6.4.16 Xilinx (part of AMD)
- 6.4.17 Samsung Electronics Co., Ltd.
- 6.4.18 Oracle Corporation
- 6.4.19 H2O.ai
- 6.4.20 Databricks, Inc.
- 6.4.21 SenseTime Group
- 6.4.22 OpenAI LP
- 6.4.23 Tesla, Inc.
- 6.4.24 NEC Corporation
- 6.4.25 Darktrace plc
7 MARKET OPPORTUNITIES AND FUTURE OUTLOOK
- 7.1 White-space and Unmet-Need Assessment

 自編碼器市場報告:趨勢、預測和競爭分析(至2035年)
 全球深度學習晶片組市場規模、佔有率、趨勢和成長分析報告(2026-2034)資料中心處理器市場報告:趨勢、預測與競爭分析(至2035年)
 監督學習市場規模、佔有率和成長分析:按演算法類型、部署模式、應用、企業規模、最終用戶和地區分類-2026-2033年產業預測
 資料中心處理器市場預測至2034年-全球分析(按處理器類型、處理器架構、資料中心類型、部署模式、應用程式、最終用戶、銷售管道和地區分類)
 深度學習市場-2026-2032年全球市場預測
 深度學習市場-全球產業規模、佔有率、趨勢、機會、預測:產品、應用、終端用戶產業、架構、區域及競爭格局(2021-2031年)
 2026年全球小樣本學習市場報告2026年全球深度學習晶片組市場報告
 深度學習市場:按組件、應用、最終用戶和地區分類