


 |
市場調查報告書
商品編碼
2113931
LNG接收站:市佔率分析、產業趨勢與統計、成長預測(2026-2031)LNG Terminal - Market Share Analysis, Industry Trends & Statistics, Growth Forecasts (2026 - 2031) |
||||||

※ 本網頁內容可能與最新版本有所差異。詳細情況請與我們聯繫。
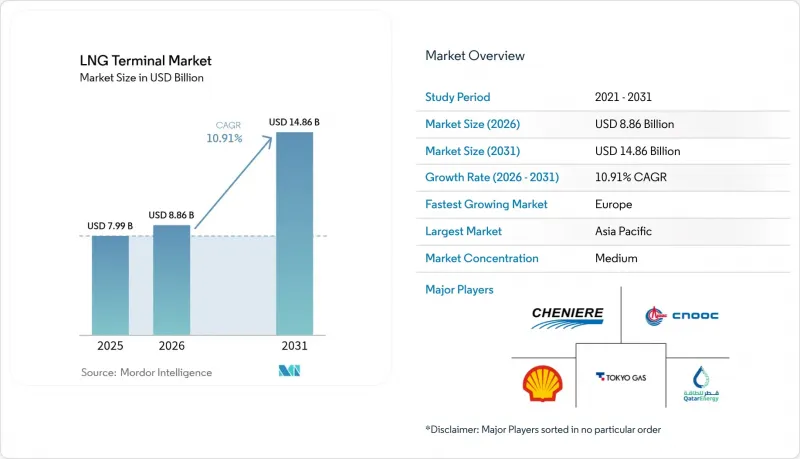
據 Mordor Intelligence 稱,2025 年LNG接收站市值為 79.9 億美元,預計到 2031 年將從 2026 年的 88.6 億美元成長至 148.6 億美元,預測期(2026-2031 年)複合年成長率為 10.91%。
本報告按終端類型(陸上和浮體式)、服務(液化、再氣化、燃料庫和小規模樞紐)、處理能力範圍(小於 200 萬噸/年、200 萬至 500 萬噸/年以及 500 萬噸/年及以上)、最終用戶行業(發電、工業和製造業、運輸和船舶燃料供應、城市(北美住宅和其他地區)。
全球LNG接收站市場趨勢與洞察
歐洲對能源安全的日益關注正在推動碼頭的擴張。
烏克蘭衝突促使歐洲天然氣戰略轉變,各國政府紛紛投資興建多個液化天然氣(LNG)設施以確保供應連續性。德國在18個月內部署了5座浮體式儲存再氣化裝置(FSRU),而荷蘭則將碳捕獲技術整合到其EemsEnergy中心,展示了一種能夠利用氫氣的多能源設計。波蘭將其Šwynowyzcze的加工能力提升至83億立方米,創造了區域貿易機會並改變了管道輸送速度。在南歐,義大利和希臘的平行計畫使歐洲的整體進口能力提升至超過短期需求的水準。這種結構性供應過剩使歐洲大陸能夠將剩餘貨物再出口,從而在LNG接收站市場創造了新的套利機會。
快速採用FSRU解決方案以確保短期再氣化能力
與同等規模的陸上工廠相比,浮式儲存再氣化裝置(FSRU)的建設週期縮短至1-2年,平均成本僅3.3億美元。超過50座運作的FSRU凸顯了商業性成熟度,使愛沙尼亞等國得以在永久性設施建成前保障能源供應。新加坡已採用第二個浮體式天然氣(LNG)泊位以避免土地短缺,而加拿大LNG公司則整合了數位孿生技術,以即時追蹤整個船體系統的動態。高性能低溫二氧化碳捕集模組進一步降低了整個生命週期的排放,提高了投資者對可作為永久性設施而非臨時措施的浮體式資產的興趣。這些進步正推動LNG接收站市場朝著專案投資回收期縮短和地域覆蓋範圍擴大的方向發展。
大型液化LNG接收站的高額資本投資(Capex)和營運成本(Opex)。
新建出口設施需要10億至30億美元的投資,以及超過1億美元的年度營運預算,即使對於大型綜合企業而言,這也給其財務狀況帶來了壓力。一艘17.4萬立方公尺的新油輪價格已達2.69億美元,而且運輸成本也已計入天然氣交付價格。鋼鐵和技術工人價格的上漲正在擠壓利潤空間,迫使美國開發商重新談判工程採購合約。由於融資緊張和需求預測下調,韓國礦業和石油工業公司(KOMIPO)取消了原計劃的進口碼頭建設,凸顯了LNG接收站行業的資金籌措風險。新興市場的外匯風險不斷上升,加重了債務償還負擔,即使需求基本面強勁,也抑制了最終的投資決策。
細分市場分析
預計到2031年,浮體式接收站的複合年成長率將達到14.18%,截至2025年,陸上LNG接收站接收站仍佔據68.20%的市場佔有率。預計2026年至2031年間,浮體式LNG接收站的市場規模將增加27.4億美元,反映了其快速部署的優勢。 24個月的建設週期有助於應對波羅的海和地中海地區的國家安全挑戰。 2008年,Gollar平台改造為浮動儲存再氣化裝置(FSRU),2018年,FLNG平台整修,這標誌著海上液化和再氣化技術實現了商業規模化應用。目前,數位孿生分析技術能夠追蹤蒸發氣和泵浦循環,使運轉率提升至98%以上。在美國墨西哥灣沿岸和卡達的運輸路線上,擁有高額定產能和直接管道連接的陸上設施仍然佔據主導地位。然而,政策制定者更傾向於先建造可轉型為石化或氫氣業務的浮體式初始設施,這維持了LNG接收站市場對新船的需求。
愛沙尼亞的帕爾迪斯基案例凸顯了一種雙管齊下的部署策略。在陸上儲槽的土木工程推進的同時,租用的浮動儲存再氣化裝置(FSRU)確保了即時進口。菲律賓和哥倫比亞的類似計畫則展示了從浮體式設施向陸上設施過渡的途徑。競爭性競標傾向於承包租賃模式,這既能幫助企業進入天然氣貨幣化領域,又能最大限度地降低財務負擔。因此,隨著浮體式設施在亞洲和非洲的部署進一步擴展,擁有模組化上部模組和低壓再液化技術專長的船東和造船廠正逐漸獲得優勢。
2025年,液化工廠在LNG接收站市場中佔據59.60%的佔有率,主要得益於美國和卡達的大型企劃。隨著路易斯安那州、德克薩斯州和拉斯拉凡的生產線擴建,預計到2030年,總出口量將超過2億噸/年。相關營運商已簽訂長期使用契約,確保了拖航業務的現金流。同時,由於國際海事組織(IMO)的硫排放法規和碳排放指數,船隊正轉向使用LNG,預計船舶燃料庫和小規模樞紐將以16.35%的複合年成長率成長。位於蘇哈爾、耗資16億美元的設施主要面向航行於霍爾木茲海峽的貨櫃船,而新加坡正在開發第二個碼頭,專門用於駁船加註燃料。
在消費量超過國內供應量的地區,再氣化仍發揮至關重要的作用,尤其是在中國,目前有39個項目正在建設中。因此,服務分層反映了能源轉型的方向:出口國將未使用的天然氣貨幣化,進口國實現能源來源多元化,而燃料庫設施則支持航運業的脫碳。將這些商業模式整合到同一地點的綜合開發商有望獲得協同效應,並在競爭日益激烈的LNG接收站市場中保持獲利能力。
區域分析
至2025年,亞太地區將維持48.10%的LNG接收站市場。這主要得益於中國29個已投入運作中的接收站和39個新建設施,這些設施將顯著提升再氣化能力,使其超過2億噸/年。印度將把其恩諾亞接收站的處理能力加倍,達到1000萬噸/年,並加快東海岸管道的建設,以促進LNG向內陸地區的滲透。日本計劃在2030年將其LNG交易量擴大到500萬噸/年,從而鞏固其作為流動性樞紐的地位;新加坡將在海峽建造第二個用於貨物再利用的泊位。這些項目將有助於在可再生能源成長的背景下維持區域天然氣分配的穩定性,並鞏固該地區作為整個LNG接收站市場進口天然氣基本負載。
預計到2031年,歐洲將以12.85%的複合年成長率實現最高增速,這得益於其逐步擺脫對管道供應的依賴。德國的五座浮動儲存再氣化裝置(FSRU)將使短期閘門吞吐能力提升至250億立方公尺。 Stade公司採用的氫能就緒型設計以及二氧化碳捕集與儲存(CCS)技術的整合,展現了其前瞻性,吸引了許多低碳投資者的目光。波蘭和荷蘭正在透過引入碳捕獲模組重新定義永續發展基準,這些模組有望顯著減少範圍1的排放。法國敦克爾克(吞吐能力130億立方公尺)連接了法國和比利時的天然氣管網,凸顯了跨境最佳化在LNG接收站市場的重要性。
北美仍以供應為導向,Calcachieux Pass、Prakmins 和 CP2 等項目將美國的出口能力提升至每年 1.9 億噸。巴西正與 TAG-Eneva 公司合作,率先建造一條私營管道連接線;阿拉伯聯合大公國國家石油公司 (ADNOC) 正在將魯瓦伊斯碼頭的吞吐能力擴建至每年 960 萬噸;Vopak 公司則在南非主導理查茲灣進口碼頭。這些項目各具特色,展現了根據當地政策、資金籌措和需求促進因素量身定做的精細化架構。
其他好處
- Excel格式的市場預測(ME)表
- 3個月的分析師支持
目錄
第1章:引言
- 研究假設和市場定義
- 調查範圍
第2章:調查方法
第3章執行摘要
第4章 市場狀況
- 市場概覽
- 市場促進因素
- 歐洲對能源安全的日益擔憂推動了碼頭建設的激增。
- 快速採用FSRU解決方案以確保短期再氣化能力
- 美國和卡達的液化天然氣建設熱潮正在擴大全球供應。
- 模組化微型液化天然氣樞紐將滿足沿海地區未充分滿足的需求。
- 碳中和液化天然氣認證帶來的溢價正在吸引投資。
- 採用氫能相容設計提高了現有設施擴建的可行性。
- 市場限制因素
- 大型液化LNG接收站需要高額的資本投資和高度集中的營運成本。
- 現貨液化天然氣價格的波動正在拉低終端運轉率。
- 由於甲烷排放問題受到審查,該項目批准被推遲。
- 由於管道輸送方向改變和生物甲烷污染,液化天然氣需求正在下降。
- 供應鏈分析
- 監理情勢
- 技術趨勢(浮式液化天然氣裝置、浮動儲存再氣化裝置、模組化)
- 波特五力模型
第5章 市場規模與成長預測
- 按終端類型
- 陸上
- 浮體式(FSRU/FLNG)
- 按服務
- 液化(出口)
- 再氣化(進口)
- 燃料庫和小規模樞紐
- 按生產能力範圍分類
- 低於200萬噸/年
- 2~5MMTPA
- 5MMTPA 或更高
- 按最終用戶行業分類
- 發電
- 工業和製造業
- 運輸和船舶燃料供應
- 城市燃氣和住宅
- 按地區
- 北美洲
- 美國
- 加拿大
- 墨西哥
- 歐洲
- 德國
- 英國
- 法國
- 義大利
- 北歐國家
- 俄羅斯
- 其他歐洲國家
- 亞太地區
- 中國
- 印度
- 日本
- 韓國
- ASEAN
- 其他亞太國家
- 南美洲
- 巴西
- 阿根廷
- 其他南美國家
- 中東和非洲
- 沙烏地阿拉伯
- 阿拉伯聯合大公國
- 卡達
- 南非
- 奈及利亞
- 其他中東和非洲國家
- 北美洲
第6章 競爭情勢
- 市場集中度
- 策略趨勢(併購、聯盟、購電協議)
- 市場佔有率分析(主要公司的市場排名和市場佔有率)
- 公司簡介
- Cheniere Energy Inc.
- QatarEnergy(incl. Qatargas)
- Royal Dutch Shell plc
- CNOOC Gas & Power
- Tokyo Gas Co., Ltd.
- Korea Gas Corporation(KOGAS)
- TotalEnergies SE
- Petronet LNG Ltd.
- Egyptian Natural Gas Holding Co.(EGAS)
- Toho Gas Co., Ltd.
- Sempra Infrastructure
- Exxon Mobil Corp.
- BW LNG
- Hoegh LNG
- Golar LNG Ltd.
- Bechtel Corporation
- Technip Energies NV
- Larsen & Toubro Ltd.
- Samsung C&T Corp.
- McDermott International Inc.
- JGC Holdings Corp.
- Saipem SpA
- KBR Inc.
第7章 市場機會與未來展望
According to Mordor Intelligence, the lNG terminal market size was valued at USD 7.99 billion in 2025 and estimated to grow from USD 8.86 billion in 2026 to reach USD 14.86 billion by 2031, at a CAGR of 10.91% during the forecast period (2026-2031).
This report is Segmented by Terminal Type (Onshore and Floating), Service (Liquefaction, Regasification, and Bunkering and Small-Scale Hub), Capacity Range (Below 2 MMTPA, 2 To 5 MMTPA, and Above 5 MMTPA), End-User Sector (Power Generation, Industrial and Manufacturing, Transportation and Marine Bunkering, and City-Gas and Residential), and Geography (North America, Europe, Asia-Pacific, South America, and More)
Global LNG Terminal Market Trends and Insights
Surge in European Energy-Security Driven Terminal Additions
Europe redirected its natural gas strategy after the Ukraine conflict, and governments financed multiple LNG facilities to safeguard supply continuity. Germany deployed 5 floating storage and regasification units within 18 months, while the Netherlands integrated carbon capture at the EemsEnergy hub, demonstrating a multi-energy design that supports hydrogen readiness. Poland lifted Swinoujscie capacity to 8.3 billion m3, creating regional trading slack that alters pipeline flows. Southern Europe followed with parallel projects in Italy and Greece, raising aggregate European import capability beyond short-term demand. Structural overcapacity positions the continent to re-export surplus cargoes, shaping new arbitrage routes for the LNG terminals market.
Rapid Uptake of FSRU Solutions for Near-Term Regas Capacity
Floating storage and regasification units shorten construction to 1-2 years and average USD 330 million, compared with USD 1 billion for equivalent onshore plants. More than 50 operational units confirm commercial maturity, enabling states such as Estonia to secure energy while permanent sites are being built. Singapore adopted a second LNG berth with a floating design to bypass land scarcity, while LNG Canada integrated digital twins that track real-time thermodynamics across hull systems. Enhanced cryogenic CO2 capture modules further reduce lifecycle emissions, driving investor preference for floating assets that now serve as enduring fixtures rather than stop-gaps. These advances propel the LNG terminals market toward faster project payback and broader geographic reach.
High Capex and Opex Intensity of Large-Scale LNG Terminals
Greenfield export facilities demand USD 1-3 billion and yearly operating budgets beyond USD 100 million, stretching balance sheets even for integrated majors. Carrier newbuilds climbed to USD 269 million for 174 000 m3 hulls, tacking shipping premiums onto delivered gas costs. Inflation in steel and skilled labour erodes margins, forcing US developers to renegotiate engineering procurement contracts. South Korea's KOMIPO cancelled a planned import quay, citing capital stress and weaker demand projections, underscoring financing risk for the LNG terminals industry. Developing economies face heightened currency-translation risk, which amplifies the debt service load, curbing final investment decisions even when demand fundamentals remain strong.
Other drivers and restraints analyzed in the detailed report include:
- US and Qatari Liquefaction Wave Expanding Global Supply
- Modular Micro-LNG Hubs Unlocking Underserved Coastal Demand
- Volatile Spot LNG Prices Depressing Terminal Utilisation
For complete list of drivers and restraints, kindly check the Table Of Contents.
Segment Analysis
Floating terminals delivered a 14.18% CAGR through 2031, while onshore plants retained 68.20% of the LNG terminal market share in 2025. The LNG terminals market size for floating assets is projected to increase by USD 2.74 billion between 2026 and 2031, reflecting the advantages of quick mobilization. Construction windows of 24 months underpin national security agendas in the Baltic and Mediterranean. Golar's 2008 FSRU conversion and 2018 FLNG refit validated seaworthy liquefaction and regasification at commercial scale. Digital twin analytics now track boil-off gas and pump cycling, raising uptime above 98%. Onshore counterparts still dominate volume corridors from the US Gulf Coast and Qatar, due to their higher nameplate capacities and direct pipe tie-ins. Yet policymakers prefer floating starter capacity that later migrates to petrochemical or hydrogen service, sustaining demand for novel hull orders within the LNG terminal market.
Estonia's Paldiski case highlights a dual-track deployment approach; a chartered FSRU secures immediate imports while civil works progress for land-based tanks. Similar blueprints in the Philippines and Colombia showcase floating-to-shore migration pathways. Competitive tendering tilts toward turnkey leasing, allowing treasury-light entry into gas monetisation. Consequently, vessel owners and yards that master modular topsides and low-pressure reliquefaction gain advantage as floating uptake spreads deeper into Asia and Africa.
Liquefaction plants retained a 59.60% share of the LNG terminals market size in 2025, supported by US and Qatari mega-projects. Train additions across Louisiana, Texas, and Ras Laffan push aggregate export availability beyond 200 MTPA by 2030. Portfolio players secure long-term tenure agreements that lock in tolling cash flows. Conversely, bunkering and small-scale hubs are expected to widen at a 16.35% CAGR as the IMO's sulfur cap and carbon index steer fleets toward LNG propulsion. Sohar's USD 1.6 billion facility targets container lines on the Strait of Hormuz, and Singapore prepares a second jetty optimised for fueled barges.
Regasification remains relevant where consumption outpaces domestic supply, notably in China, where 39 projects are currently under construction. Service stratification, therefore, reflects energy transition vectors: exporters monetize stranded gas, importers diversify their procurement, and bunkering nodes feed maritime decarbonization. Integrated developers that co-locate these modes will capture synergies and defend margins in an increasingly competitive LNG terminal market.
Complete Report Scope:
- By Terminal Type
- Onshore
- Floating (FSRU/FLNG)
- By Service
- Liquefaction (Export)
- Regasification (Import)
- Bunkering and Small-scale Hubs
- By Capacity Range
- Below 2 MMTPA
- 2 to 5 MMTPA
- Above 5 MMTPA
- By End-user Sector
- Power Generation
- Industrial and Manufacturing
- Transportation and Marine Bunkering
- City-Gas and Residential
- By Geography
- North America
- United States
- Canada
- Mexico
- Europe
- Germany
- United Kingdom
- France
- Italy
- NORDIC Countries
- Russia
- Rest of Europe
- Asia-Pacific
- China
- India
- Japan
- South Korea
- ASEAN Countries
- Rest of Asia-Pacific
- South America
- Brazil
- Argentina
- Rest of South America
- Middle East and Africa
- Saudi Arabia
- United Arab Emirates
- Qatar
- South Africa
- Nigeria
- Rest of Middle East and Africa
- North America
Geography Analysis
The Asia-Pacific region retained a 48.10% share of the LNG terminals market in 2025, underpinned by China's 29 active docks and 39 additions that will significantly increase regas capacity to well past 200 MTPA. India doubles Ennore to 10 MTPA and accelerates east-coast pipe links that extend LNG penetration inland. Japan scales trading desks to 5 MTPA by 2030, reinforcing its role as a liquidity hub, while Singapore builds a second berth to recycle cargoes in the Straits. These projects maintain regional send-out stability even as renewables increase, preserving a baseload role for imported gas across the LNG terminals market.
Europe is projected to post the fastest 12.85% CAGR to 2031, following a pivot from pipeline supply. Germany's 5 FSRU fleet raises short-term gate capacity to 25 billion m3. Stade's hydrogen-ready design, combined with CCS integration, signals a future-proof approach that attracts low-carbon investors. Poland and the Netherlands add carbon-capture modules that may slash Scope 1 emissions, reshaping sustainability benchmarks. France's Dunkerque, at 13 billion m3, bridges French and Belgian grids, highlighting cross-border optimisation inside the LNG terminals market.
North America remains supply-centric, as Calcasieu Pass, Plaquemines, and CP2 push the US export plateau toward 190 MTPA. Brazil pioneers private pipe links with TAG-Eneva, while ADNOC advances Ruwais to 9.6 MTPA in the UAE, and Vopak leads South Africa's Richards Bay import quay. These diverse projects demonstrate tailored architectures that cater to local policy, financing, and demand drivers.
- Cheniere Energy Inc.
- QatarEnergy (incl. Qatargas)
- Royal Dutch Shell plc
- CNOOC Gas & Power
- Tokyo Gas Co., Ltd.
- Korea Gas Corporation (KOGAS)
- TotalEnergies SE
- Petronet LNG Ltd.
- Egyptian Natural Gas Holding Co. (EGAS)
- Toho Gas Co., Ltd.
- Sempra Infrastructure
- Exxon Mobil Corp.
- BW LNG
- Hoegh LNG
- Golar LNG Ltd.
- Bechtel Corporation
- Technip Energies NV
- Larsen & Toubro Ltd.
- Samsung C&T Corp.
- McDermott International Inc.
- JGC Holdings Corp.
- Saipem SpA
- KBR Inc.
Additional Benefits:
- The market estimate (ME) sheet in Excel format
- 3 months of analyst support
TABLE OF CONTENTS
1 Introduction
- 1.1 Study Assumptions & Market Definition
- 1.2 Scope of the Study
2 Research Methodology
3 Executive Summary
4 Market Landscape
- 4.1 Market Overview
- 4.2 Market Drivers
- 4.2.1 Surge in European energy-security driven terminal additions
- 4.2.2 Rapid uptake of FSRU solutions for near-term regas capacity
- 4.2.3 US & Qatari liquefaction wave expanding global supply
- 4.2.4 Modular micro-LNG hubs unlocking underserved coastal demand
- 4.2.5 Carbon-neutral LNG certification premiums attracting investment
- 4.2.6 Hydrogen-ready designs boosting brownfield expansion viability
- 4.3 Market Restraints
- 4.3.1 High capex & opex intensity of large-scale LNG terminals
- 4.3.2 Volatile spot LNG prices depressing terminal utilisation
- 4.3.3 Methane-emission scrutiny delaying project approvals
- 4.3.4 Pipeline reversals & biomethane blending eroding LNG demand
- 4.4 Supply-Chain Analysis
- 4.5 Regulatory Landscape
- 4.6 Technological Outlook (FLNG, FSRU & modularisation)
- 4.7 Porter's Five Forces
- 4.7.1 Bargaining Power of Suppliers
- 4.7.2 Bargaining Power of Consumers
- 4.7.3 Threat of New Entrants
- 4.7.4 Threat of Substitutes
- 4.7.5 Intensity of Competitive Rivalry
5 Market Size & Growth Forecasts
- 5.1 By Terminal Type
- 5.1.1 Onshore
- 5.1.2 Floating (FSRU/FLNG)
- 5.2 By Service
- 5.2.1 Liquefaction (Export)
- 5.2.2 Regasification (Import)
- 5.2.3 Bunkering and Small-scale Hubs
- 5.3 By Capacity Range
- 5.3.1 Below 2 MMTPA
- 5.3.2 2 to 5 MMTPA
- 5.3.3 Above 5 MMTPA
- 5.4 By End-user Sector
- 5.4.1 Power Generation
- 5.4.2 Industrial and Manufacturing
- 5.4.3 Transportation and Marine Bunkering
- 5.4.4 City-Gas and Residential
- 5.5 By Geography
- 5.5.1 North America
- 5.5.1.1 United States
- 5.5.1.2 Canada
- 5.5.1.3 Mexico
- 5.5.2 Europe
- 5.5.2.1 Germany
- 5.5.2.2 United Kingdom
- 5.5.2.3 France
- 5.5.2.4 Italy
- 5.5.2.5 NORDIC Countries
- 5.5.2.6 Russia
- 5.5.2.7 Rest of Europe
- 5.5.3 Asia-Pacific
- 5.5.3.1 China
- 5.5.3.2 India
- 5.5.3.3 Japan
- 5.5.3.4 South Korea
- 5.5.3.5 ASEAN Countries
- 5.5.3.6 Rest of Asia-Pacific
- 5.5.4 South America
- 5.5.4.1 Brazil
- 5.5.4.2 Argentina
- 5.5.4.3 Rest of South America
- 5.5.5 Middle East and Africa
- 5.5.5.1 Saudi Arabia
- 5.5.5.2 United Arab Emirates
- 5.5.5.3 Qatar
- 5.5.5.4 South Africa
- 5.5.5.5 Nigeria
- 5.5.5.6 Rest of Middle East and Africa
- 5.5.1 North America
6 Competitive Landscape
- 6.1 Market Concentration
- 6.2 Strategic Moves (M&A, Partnerships, PPAs)
- 6.3 Market Share Analysis (Market Rank/Share for key companies)
- 6.4 Company Profiles (includes Global level Overview, Market level overview, Core Segments, Financials as available, Strategic Information, Products & Services, and Recent Developments)
- 6.4.1 Cheniere Energy Inc.
- 6.4.2 QatarEnergy (incl. Qatargas)
- 6.4.3 Royal Dutch Shell plc
- 6.4.4 CNOOC Gas & Power
- 6.4.5 Tokyo Gas Co., Ltd.
- 6.4.6 Korea Gas Corporation (KOGAS)
- 6.4.7 TotalEnergies SE
- 6.4.8 Petronet LNG Ltd.
- 6.4.9 Egyptian Natural Gas Holding Co. (EGAS)
- 6.4.10 Toho Gas Co., Ltd.
- 6.4.11 Sempra Infrastructure
- 6.4.12 Exxon Mobil Corp.
- 6.4.13 BW LNG
- 6.4.14 Hoegh LNG
- 6.4.15 Golar LNG Ltd.
- 6.4.16 Bechtel Corporation
- 6.4.17 Technip Energies NV
- 6.4.18 Larsen & Toubro Ltd.
- 6.4.19 Samsung C&T Corp.
- 6.4.20 McDermott International Inc.
- 6.4.21 JGC Holdings Corp.
- 6.4.22 Saipem SpA
- 6.4.23 KBR Inc.
7 Market Opportunities & Future Outlook
- 7.1 White-space & Unmet-need Assessment

 小規模LNG接收站市場:按類型、供應形式、位置和應用分類-2026-2032年全球市場預測
 大型LNG接收站市場規模、佔有率和成長分析:按接收站類型、營運模式、技術、儲存槽類型、應用、最終用戶和地區分類-2026-2033年產業預測大型液化LNG接收站市場:2026-2032年全球市場預測(依接收站類型、設施類型、所有權、接收站容量及應用分類)
 液化天然氣基礎設施市場-全球產業規模、佔有率、趨勢、機會、預測:按類型、最終用戶產業、地區和競爭格局分類,2021-2031年
 2026年全球液化天然氣(LNG)虛擬管道市場報告LNG接收站市場-全球產業規模、佔有率、趨勢、機會、預測:按類型、位置、應用、地區和競爭格局分類,2021-2031年
 液化天然氣(LNG)基礎設施市場規模、佔有率和成長分析(按類型、應用、所有權和地區分類)-2026-2033年產業預測大型液化天然氣接收站市場-全球產業規模、佔有率、趨勢、機會及預測(依技術、地點、應用、地區及競爭格局分類,2020-2030年預測)全球LNG接收站市場(按終端類型、技術、儲存容量、位置和最終用途)預測 2025-2030
 全球大型液化LNG接收站市場