


 |
市場調查報告書
商品編碼
2113905
商業衛星影像:市場佔有率分析、產業趨勢與統計、成長預測(2026-2031)Commercial Satellite Imaging - Market Share Analysis, Industry Trends & Statistics, Growth Forecasts (2026 - 2031) |
||||||

※ 本網頁內容可能與最新版本有所差異。詳細情況請與我們聯繫。
根據 Mordor Intelligence 預測,商業衛星影像市場規模預計將在 2026 年達到 74.9 億美元,到 2031 年達到 136.2 億美元,複合年成長率為 12.7%。
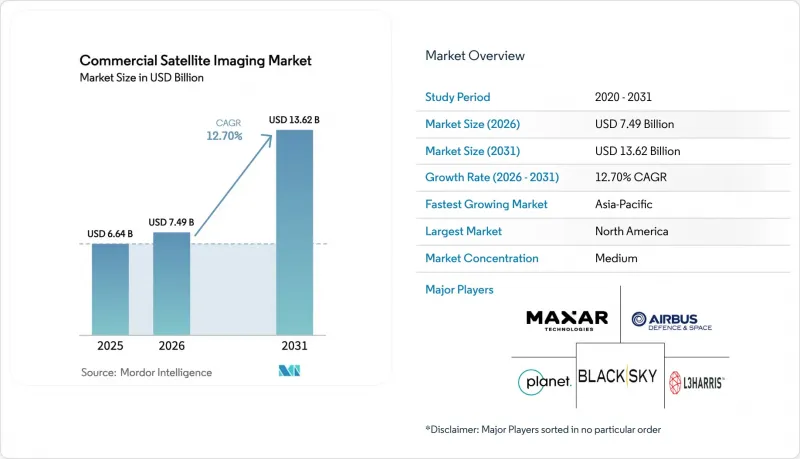
本報告按應用領域(地理空間資料收集與測繪、自然資源管理、監控與安防及其他)、最終用戶(政府、建築、交通運輸與物流及其他)、成像類型(光學、雷達/SAR及其他)、空間解析度(0.3米及以下、0.3米至1米及其他)和地區進行細分。市場預測以美元計價。
全球商業衛星影像市場趨勢與洞察
強制利用衛星檢驗甲烷排放量
監管義務已將衛星影像從一項可選的永續發展措施轉變為一項強制性合規要求。美國環保署 (EPA) 的「超級發送器計畫」要求石油和天然氣業者在收到第三方衛星警報後五天內做出回應,這些警報檢測到的排放量超過每小時 100 公斤,這使得支出從自願抵消轉向了衛星服務合約。歐盟的甲烷法規引入了季度報告要求,支持為專用甲烷探測衛星星系簽訂多年合約。 GHGSat 營運 17 顆專門用於短波紅外線感測的衛星,將關鍵盆地的重觀測間隔縮短至三天。國際能源總署 (IEA) 預測,到 2028 年,經衛星檢驗的「超級發送器」事件將減少一半,這表明對高頻熱成像的需求將持續存在。二疊紀盆地和北海的營運商現在每年撥出 2 億至 3 億美元用於第三方檢驗,這有助於他們確保持續的收入,並保護供應商免受商品圖像價格波動的影響。
人工智慧驅動的「提示和排隊」任務正在推動不到一小時內的重新觀察的經濟效益。
人工智慧 (AI) 驅動的任務分配正在縮短事件偵測和高解析度影像擷取之間的時間,從而創造近乎即時的資訊價值。美國太空總署 (NASA) 的 ConstellAI 計畫展示了自主野火監測能力,可在 30 分鐘內發射高解析度衛星,將延遲降低 80%。 Planet Labs 公司正在整合 Dove 立方衛星和 SkySat 的資源,以在一小時內提供亞米級解析度的圖像,這項加值服務的價格比每日重觀測服務高出 40%。美國太空軍的合約案例表明,軍方對 AI 驅動的任務分配以支援動態目標選擇表現出濃厚的興趣。其經濟效益包括減少不必要的資料收集、降低下行鏈路成本以及快速獲取可操作的洞察,這些因素加起來可以將每次事件的資訊取得成本降低約 60%。保險承銷商、緊急應變機構和物流公司也開始效仿國防層級的流程,這表明 AI 驅動的任務分配在商業領域得到更廣泛的應用指日可待。
資本密集型衛星星系部署和發射成本
衛星的製造、發射和管理地面基礎設施在產生初始收入之前可能需要花費1億至5億美元,這給資產負債表帶來了沉重的負擔。 Satellogic在完成2,500萬美元的D輪資金籌措後透露,它還需要4億美元才能實現部署300顆衛星的願景。 BlackSky 2024年的淨虧損達到4,800萬美元,顯示儘管收入成長,但快速擴張帶來的折舊免稅額負擔正在產生影響。即使SpaceX的共乘發射價格接近每200公斤100萬美元,發射仍然是主要成本,由100顆衛星組成的網路需要5000萬美元。保險費還要增加10%至15%的成本,而軌道異常可能會使多年的投資付諸東流。預計2024年太空科技的創業融資將下降35%,迫使業者優先考慮資本保全和策略合作。
細分市場分析
預計國防和資訊領域的支出將以13.04%的複合年成長率成長。這反映出一種策略轉變,即轉向成本更低、重測頻率更高的商業訂閱模式,以取代政府擁有的衛星。地理空間資料擷取與測繪在2025年仍佔據商業衛星影像市場24.73%的營收佔有率,但隨著全球基礎地圖覆蓋率接近飽和,其成長速度正在放緩。在亞洲和中東地區,監視和安全相關合約正在不斷擴大,尤其青睞合成孔徑雷達(SAR)和「提示與引導」工作流程,這些技術即使在夜間或惡劣天氣條件下也能提供可操作的資訊。隨著私人救災預算日益趨向於軍用級影像標準,救災機構正在加快整合超高解析度影像和無人機影像,以加快災害評估。
國防採購負責人將商業圖像數據視為“填補空白的工具”和“突破性進展”,他們重新思考了機密預算的分配方式,以便在不承擔生命週期相關所有權風險的情況下快速執行任務。情報分析人員現在利用雲端平台上整合的光學、合成孔徑雷達 (SAR) 和高光譜遙測圖層組成的多感測器鑲嵌圖,這種發展趨勢優先考慮分析價值而非原始像素資料。地理空間新創公司正與整合商合作,提供專門針對邊防安全、海上情境察覺和非法活動偵測等領域的儀錶板。同時,測繪機構正從週期性的全國更新周期轉向持續更新模式,採用自動變化檢測演算法來檢測基礎設施擴張、土地利用變化和環境法規違規行為。儘管公共部門免費資料集激增,但這些工作流程確保了商業衛星圖像市場對政府現代化仍然至關重要。
預計軍事和國防機構的複合年成長率將達到13.11%,進一步鞏固其在商業衛星圖像市場高價細分領域的佔有率。政府私部門機構(預計到2025年將佔銷售額的23.72%)對環境監測、地籍資料更新和災害應變的需求依然旺盛,但預算緊縮給單幅影像定價帶來了壓力。能源公司正成為成長的加速器,透過購買甲烷檢測和基礎設施健康監測的訂閱服務,將合規挑戰轉化為可預測的營運成本。物流業者利用人工智慧驅動的船舶數量估算和交通熱力圖,透過每日影像資料進行路線最佳化和港口擁塞預測。南美洲的林業和農業合作社正在購買歸一化植被指數(NDVI)儀表板,其價格按面積而非像素計算,從而創造了一種基於銷售但利潤率較低的收入來源。
在建築和通訊領域,尤其是在亞太地區的智慧城市專案中,頻繁更新的中解析度影像正被用於位置和網路覆蓋規劃。保險承銷商正在採用邊緣處理技術進行損害評估,以加快理賠速度並減少詐欺行為。國防領域的總承包商正在將商業資料來源整合到指揮控制軟體中,從而推動了對「安全存取」合約的需求,這些合約旨在保護供應商免受商品化循環的影響。非政府組織(NGO)正在使用開放原始碼分析技術來監測人道走廊和衝突地區的人權侵犯情況,儘管這些工作的收入有限。總體而言,業務多元化降低了集中風險,但也加劇了對企業客戶的競爭,迫使供應商在利潤豐厚的國防相關合約和擴充性的民用交易量之間尋求平衡。
區域分析
到2025年,北美將佔總收入的38.73%,這得益於美國政府多年交易量保障的採購架構。美國國家地理空間資訊局(NGA)的「商業地理空間情報策略」正在推動供應商多元化,打破傳統壟斷,資金正流入BlackSky、Planet和Capella等公司的資料發送服務領域。加拿大正在利用合成孔徑雷達(SAR)影像進行北極地區的自主巡邏,並藉助ICEYE和MDA的服務來彌補其破冰船隊的不足。墨西哥地方政府正在將中等解析度光學影像整合到緩解熱島效應的專案中,這表明整個北美大陸的需求正在不斷成長。美國國家海洋暨大氣總署(NOAA)遙感探測法規和聯邦通訊委員會(FCC)許可製度的澄清正在促進風險投資,但《國際武器貿易條例》(ITAR)仍然限制著高解析度資料的出口。
亞太地區預計將以13.67%的複合年成長率成長,成長速度在所有地區中最高。印度的「Bhuvan-NICES 2.0」入口網站整合了國內和商業數據,為城市規劃和災害救援提供數據看板。中國的「吉林一號」衛星群由108顆衛星組成,可為整個「一帶一路」沿線提供亞米級解析度的衛星覆蓋,對參與東南亞競標的西方供應商構成挑戰。日本的ALOS-4 SAR平台為國家災害應變及相關商業服務提供支援。印尼、泰國和越南試點建設的智慧城市網路利用每日影像資料進行洪水風險緩解、城市交通建模和環境法規遵從,基礎設施的擴張持續推動影像資料需求的成長。貨幣穩定和數位政府的推動進一步促進了支出成長。
歐洲的需求得益於哥白尼開放資料平台和通用安全與防務政策(CSDP)下的採購。德國大地測量與製圖局正在利用商業合成孔徑雷達(SAR)技術補充哨兵-1衛星的數據,以應對日益嚴重的洪災。在英國國防採購中,為了確保主權,在資料本地化問題引發爭議後,優先考慮區域供應商。法國國家太空研究中心(CNES)正共同投資高光譜遙測相關項目,以提升農業競爭力。此外,儘管宏觀經濟波動,巴西和阿根廷仍在利用植被指數分析來促進大豆和玉米的生產。中東和非洲的成長主要集中在沙烏地阿拉伯和阿拉伯聯合大公國,兩國正利用石油收入,透過其航太機構的努力,建構國內的影像能力。
其他好處
- Excel格式的市場預測(ME)表
- 3個月的分析師支持
目錄
第1章:引言
- 研究假設和市場定義
- 調查範圍
第2章:調查方法
第3章執行摘要
第4章 市場狀況
- 市場概覽
- 市場促進因素
- 對大片土地進行高效監測的需求日益成長
- 隨著智慧城市理念的推進,對地理空間資訊的需求日益成長。
- 介紹跨產業的巨量資料和影像分析。
- SAR衛星群的廣泛應用將使全天候重觀測成為可能。
- 透過人工智慧驅動的「提示排隊」任務,推動不到一小時的重複觀察的經濟效益
- 強制使用衛星檢驗甲烷排放量(2025年起實施的ESG法規)
- 市場限制因素
- 可從其他飛機平台取得高解析度影像
- 資本密集型衛星星系部署和發射成本
- 軌道擁塞和頻率管理瓶頸
- 資料隱私法規正在減緩商業許可的普及。
- 產業價值鏈分析
- 監理情勢
- 技術展望
- 波特五力分析
第5章 市場規模與成長預測
- 透過使用
- 地理空間資料的採集與製圖
- 自然資源管理
- 監控與安全
- 保護與研究
- 建設與開發
- 災害管理
- 國防與資訊
- 最終用戶
- 政府
- 建造
- 運輸/物流
- 軍事/國防
- 能源
- 林業和農業
- 其他
- 按成像類型
- 光學(頻譜/全色)
- 雷達/合成孔徑雷達
- 高光譜遙測
- 熱的
- 按空間解析度
- 0.3米或更低(超高)
- 0.3米~1米(高)
- 1米-5米(中)
- 5米或以上(低)
- 按地區
- 北美洲
- 美國
- 加拿大
- 墨西哥
- 南美洲
- 巴西
- 阿根廷
- 其他南美國家
- 歐洲
- 德國
- 英國
- 法國
- 義大利
- 西班牙
- 其他歐洲國家
- 亞太地區
- 中國
- 日本
- 印度
- 韓國
- ASEAN
- 其他亞太國家
- 中東和非洲
- 中東
- 沙烏地阿拉伯
- 阿拉伯聯合大公國
- 其他中東國家
- 非洲
- 南非
- 其他非洲國家
- 中東
- 北美洲
第6章 競爭情勢
- 市場集中度
- 策略趨勢
- 市佔率分析
- 公司簡介
- Maxar Technologies Inc.
- Airbus Defence and Space SAS
- Planet Labs PBC
- BlackSky Technology Inc.
- L3Harris Technologies Inc.
- ICEYE Oy
- Capella Space Corp.
- Satellogic Inc.
- Ursa Space Systems Inc.
- European Space Imaging GmbH
- ImageSat International NV
- Galileo Group, Inc.
- SpaceKnow Inc.
- SI Imaging Services Co., Ltd.
- Deimos Imaging SLU
- GHGSat Inc.
- Spire Global, Inc.
- Umbra Lab, Inc.
- Earth-i Ltd.
- Capella Federal LLC
- Satellogic USA Inc.
- Orbital Insight, Inc.
- Pixxel Space Technologies Pvt. Ltd.
- Kuva Space Oy
第7章 市場機會與未來展望
According to Mordor Intelligence, the commercial satellite imaging market size reached USD 7.49 billion in 2026 and is projected to attain USD 13.62 billion by 2031, reflecting a 12.7% CAGR.
This report is Segmented by Application (Geospatial Data Acquisition and Mapping, Natural Resource Management, Surveillance and Security, and More), End-User (Government, Construction, Transportation and Logistics, and More), Imaging Type (Optical, Radar/SAR, and More), Spatial Resolution (Below 0. 3 M, 0. 3 M To 1 M, and More), and Geography. Market Forecasts are Provided in Terms of Value (USD).
Global Commercial Satellite Imaging Market Trends and Insights
Mandatory Methane-Emissions Verification Via Satellite
Regulatory mandates have transformed satellite imaging from an optional sustainability measure into a compliance necessity. The United States Environmental Protection Agency Super Emitter Program obliges oil and gas operators to respond within five days to third-party satellite alerts that detect discharges above 100 kilograms per hour, redirecting spend from voluntary offsets to contracted satellite services. The European Union Methane Regulation introduced quarterly reporting duties that underpin multi-year subscriptions for dedicated methane-detection constellations. GHGSat operates 17 satellites focused on shortwave-infrared sensing, reducing revisit over major basins to three days. The International Energy Agency projects satellite-verified super-emitter events will halve by 2028, implying sustained demand for high-cadence thermal imagery. Operators in the Permian Basin and North Sea now allocate annual budgets of USD 200-300 million for third-party verification, securing recurring revenue and insulating suppliers from commodity imagery price swings.
AI Tip-and-Cue Tasking Driving Sub-Hour Revisit Economics
Artificial-intelligence tasking shortens the interval between event detection and high-resolution capture, creating near-real-time intelligence value. NASA's ConstellAI project demonstrated autonomous wildfire monitoring that cues higher-resolution satellites within 30 minutes, cutting latency by 80%. Planet Labs integrates Dove cubesats with SkySat assets to deliver sub-meter imagery inside one hour, a premium service tier priced 40% above daily revisit. United States Space Force contracts illustrate military appetite for AI-driven tasking that supports dynamic targeting. The economic upside arises from fewer unnecessary collects, lower downlink costs, and faster actionable insights, a combination that can cut acquisition cost per intelligence event by roughly 60%. Insurance underwriters, emergency-response agencies, and logistics firms are beginning to replicate defense-grade workflows, signaling broader commercial adoption.
Capital-Intensive Constellation Deployment and Launch Costs
Satellite manufacturing, launch, and ground infrastructure consume USD 100-500 million before first revenue, burdening balance sheets. Satellogic disclosed an additional USD 400 million in funding requirements to achieve its 300-satellite vision following a USD 25 million Series D round. BlackSky's 2024 net loss of USD 48 million, despite top-line growth, illustrates depreciation drag under rapid expansion. Launch remains a gating cost even as SpaceX rideshare pricing approaches USD 1 million per 200 kilograms, implying USD 50 million in lift fees for a 100-satellite network. Insurance premiums add another 10-15%, and on-orbit anomalies can erase years of investment. Venture funding for space technology fell 35% in 2024, forcing operators to prioritize cash preservation and strategic partnerships.
Other drivers and restraints analyzed in the detailed report include:
- Proliferation of SAR Micro-Constellations Enabling All-Weather Revisit
- Big-Data and Imagery-Analytics Adoption Across Industries
- Data-Privacy Regulations Slowing Commercial Licensing
For complete list of drivers and restraints, kindly check the Table Of Contents.
Segment Analysis
Defense and intelligence spending is projected to expand at a 13.04% CAGR, reflecting a strategic pivot toward commercial subscriptions that furnish higher revisit rates at lower cost compared with bespoke government satellites. Geospatial data acquisition and mapping, which secured 24.73% of 2025 revenue, remains the largest slice of the commercial satellite imaging market, yet its growth is moderating as global basemap coverage approaches saturation. Surveillance and security contracts across Asia and the Middle East are scaling, favoring SAR and tip-and-cue workflows that deliver actionable intelligence during night or adverse weather. Disaster-relief agencies increasingly integrate ultra-high-resolution captures with drone footage to expedite damage assessments, aligning civil-protection budgets with military-grade imaging standards.
The defense buyer community views commercial feeds as both gap-filler and disrupter, reallocating classified budgets to obtain responsive tasking without lifecycle ownership risk. Intelligence analysts now consume multi-sensor mosaics comprising optical, SAR, and hyperspectral layers stitched in cloud platforms, an evolution that elevates analytics value over raw pixels. Geospatial startups partner with integrators to deliver domain-specific dashboards for border security, maritime domain awareness, and illicit-activity detection. Meanwhile, mapping agencies migrate from periodic nationwide refresh cycles to continuous update models, employing automated change-detection algorithms that flag infrastructure growth, land-use shifts, and environmental compliance violations. These workflows ensure that the commercial satellite imaging market remains integral to governmental modernization even as free public-sector datasets proliferate.
Military and defense entities are forecast to record a 13.11% CAGR, reinforcing their premium-priced weighting within the commercial satellite imaging market. Government civil agencies, holding 23.72% of revenue in 2025, maintain demand for environmental monitoring, cadastral updates, and disaster response, but face budget scrutiny that pressures per-scene pricing. Energy companies have emerged as growth accelerants, purchasing methane-detection and infrastructure-integrity subscriptions that convert compliance pain points into predictable operating expenses. Logistics operators deploy daily imagery for route-optimization and port-congestion forecasting, using AI-derived vessel counts and traffic heat maps. Forestry and agriculture cooperatives in South America buy normalized-difference vegetation index dashboards priced on acreage rather than pixels, creating volume-based but lower-margin revenue streams.
The construction and telecom sectors exploit frequent, medium-resolution imagery for site selection and network coverage planning, particularly in Asia-Pacific smart-city projects. Insurance underwriters embrace edge-processed damage assessments that accelerate claims resolution and reduce fraud. Defense prime contractors integrate commercial feeds into command-and-control software, reinforcing demand for assured-access contracts that insulate providers from commodity cycles. Non-governmental organizations leverage open-source analytics to monitor humanitarian corridors and conflict-zone violations, although these engagements generate limited revenue. Overall, diversification lowers concentration risk while intensifying competition for enterprise accounts, compelling providers to balance high-margin defense deals with scalable civilian volumes.
Complete Report Scope:
- By Application
- Geospatial Data Acquisition and Mapping
- Natural Resource Management
- Surveillance and Security
- Conservation and Research
- Construction and Development
- Disaster Management
- Defense and Intelligence
- By End-User
- Government
- Construction
- Transportation and Logistics
- Military and Defense
- Energy
- Forestry and Agriculture
- Other End-Users
- By Imaging Type
- Optical (Multispectral / Panchromatic)
- Radar / SAR
- Hyperspectral
- Thermal
- By Spatial Resolution
- Below 0.3 m (Ultra-High)
- 0.3 m - 1 m (High)
- 1 m - 5 m (Medium)
- Above 5 m (Low)
- By Geography
- North America
- United States
- Canada
- Mexico
- South America
- Brazil
- Argentina
- Rest of South America
- Europe
- Germany
- United Kingdom
- France
- Italy
- Spain
- Rest of Europe
- Asia-Pacific
- China
- Japan
- India
- South Korea
- ASEAN
- Rest of Asia-Pacific
- Middle East and Africa
- Middle East
- Saudi Arabia
- United Arab Emirates
- Rest of Middle East
- Africa
- South Africa
- Rest of South Africa
- Middle East
- North America
Geography Analysis
North America captured 38.73% of 2025 revenue, anchored by United States government procurement frameworks that guarantee multi-year volume commitments. The National Geospatial-Intelligence Agency's Commercial GEOINT Strategy diversified suppliers beyond legacy monopolies, channeling funds toward BlackSky, Planet, and Capella feeds. Canada employs SAR imagery for Arctic sovereignty patrols, leveraging ICEYE and MDA services to complement limited icebreaker fleets. Mexico's metropolitan governments integrate medium-resolution optical scenes into heat-island mitigation programs, signaling spillover demand across the continent. Regulatory clarity under NOAA remote-sensing and Federal Communications Commission licensing has encouraged venture investment, although International Traffic in Arms Regulations still curb high-resolution exports.
Asia-Pacific is projected to grow at a 13.67% CAGR, the fastest among regions. India's Bhuvan-NICES 2.0 portal combines domestic and commercial data for urban-planning and disaster-relief dashboards. China's Jilin-1 constellation of 108 satellites supplies sub-meter coverage across Belt and Road corridors, challenging western vendors in Southeast Asian tenders. Japan's ALOS-4 SAR platform supports national disaster countermeasures and adjacent commercial services. Smart-city network pilots across Indonesia, Thailand, and Vietnam employ daily imagery for flood-risk mitigation, urban-transport modeling, and environmental compliance, translating infrastructural expansion into enduring imaging demand. Currency stability and digital-government mandates further underpin spending momentum.
European demand benefits from the Copernicus open-data backbone and Common Security and Defence Policy procurements. Germany's Cartography and Geodesy agency complements Sentinel-1 with commercial SAR as flood events intensify. United Kingdom defense procurement favors regional providers to ensure sovereignty following data-localization debates. France's CNES co-invests in hyperspectral ventures to support agricultural competitiveness. Elsewhere, Brazil and Argentina leverage vegetation-index analytics for soy and corn production despite macroeconomic volatility. Middle East and Africa growth centers on Saudi Arabia and the United Arab Emirates, where space-agency initiatives channel oil-derived capital into domestic imaging capability.
- Maxar Technologies Inc.
- Airbus Defence and Space SAS
- Planet Labs PBC
- BlackSky Technology Inc.
- L3Harris Technologies Inc.
- ICEYE Oy
- Capella Space Corp.
- Satellogic Inc.
- Ursa Space Systems Inc.
- European Space Imaging GmbH
- ImageSat International N.V.
- Galileo Group, Inc.
- SpaceKnow Inc.
- SI Imaging Services Co., Ltd.
- Deimos Imaging S.L.U.
- GHGSat Inc.
- Spire Global, Inc.
- Umbra Lab, Inc.
- Earth-i Ltd.
- Capella Federal LLC
- Satellogic USA Inc.
- Orbital Insight, Inc.
- Pixxel Space Technologies Pvt. Ltd.
- Kuva Space Oy
Additional Benefits:
- The market estimate (ME) sheet in Excel format
- 3 months of analyst support
TABLE OF CONTENTS
1 INTRODUCTION
- 1.1 Study Assumptions and Market Definition
- 1.2 Scope of the Study
2 RESEARCH METHODOLOGY
3 EXECUTIVE SUMMARY
4 MARKET LANDSCAPE
- 4.1 Market Overview
- 4.2 Market Drivers
- 4.2.1 Increasing requirement for efficient monitoring of vast land areas
- 4.2.2 Rising smart-city initiatives fueling geospatial demand
- 4.2.3 Big-data and imagery-analytics adoption across industries
- 4.2.4 Proliferation of SAR micro-constellations enabling all-weather revisit
- 4.2.5 AI tip-and-cue tasking driving sub-hour revisit economics
- 4.2.6 Mandatory methane-emissions verification via satellite (post-2025 ESG rules)
- 4.3 Market Restraints
- 4.3.1 High-resolution imagery available from alternative airborne platforms
- 4.3.2 Capital-intensive constellation deployment and launch costs
- 4.3.3 Orbital-congestion and spectrum-management bottlenecks
- 4.3.4 Data-privacy regulations slowing commercial licensing
- 4.4 Indusy Value Chain Analysis
- 4.5 Regulatory Landscape
- 4.6 Technological Outlook
- 4.7 Porter's Five Forces Analysis
- 4.7.1 Bargaining Power of Buyers
- 4.7.2 Bargaining Power of Suppliers
- 4.7.3 Threat of New Entrants
- 4.7.4 Threat of Substitute Products
- 4.7.5 Intensity of Competitive Rivalry
5 MARKET SIZE AND GROWTH FORECASTS (VALUE)
- 5.1 By Application
- 5.1.1 Geospatial Data Acquisition and Mapping
- 5.1.2 Natural Resource Management
- 5.1.3 Surveillance and Security
- 5.1.4 Conservation and Research
- 5.1.5 Construction and Development
- 5.1.6 Disaster Management
- 5.1.7 Defense and Intelligence
- 5.2 By End-User
- 5.2.1 Government
- 5.2.2 Construction
- 5.2.3 Transportation and Logistics
- 5.2.4 Military and Defense
- 5.2.5 Energy
- 5.2.6 Forestry and Agriculture
- 5.2.7 Other End-Users
- 5.3 By Imaging Type
- 5.3.1 Optical (Multispectral / Panchromatic)
- 5.3.2 Radar / SAR
- 5.3.3 Hyperspectral
- 5.3.4 Thermal
- 5.4 By Spatial Resolution
- 5.4.1 Below 0.3 m (Ultra-High)
- 5.4.2 0.3 m - 1 m (High)
- 5.4.3 1 m - 5 m (Medium)
- 5.4.4 Above 5 m (Low)
- 5.5 By Geography
- 5.5.1 North America
- 5.5.1.1 United States
- 5.5.1.2 Canada
- 5.5.1.3 Mexico
- 5.5.2 South America
- 5.5.2.1 Brazil
- 5.5.2.2 Argentina
- 5.5.2.3 Rest of South America
- 5.5.3 Europe
- 5.5.3.1 Germany
- 5.5.3.2 United Kingdom
- 5.5.3.3 France
- 5.5.3.4 Italy
- 5.5.3.5 Spain
- 5.5.3.6 Rest of Europe
- 5.5.4 Asia-Pacific
- 5.5.4.1 China
- 5.5.4.2 Japan
- 5.5.4.3 India
- 5.5.4.4 South Korea
- 5.5.4.5 ASEAN
- 5.5.4.6 Rest of Asia-Pacific
- 5.5.5 Middle East and Africa
- 5.5.5.1 Middle East
- 5.5.5.1.1 Saudi Arabia
- 5.5.5.1.2 United Arab Emirates
- 5.5.5.1.3 Rest of Middle East
- 5.5.5.2 Africa
- 5.5.5.2.1 South Africa
- 5.5.5.2.2 Rest of South Africa
- 5.5.5.1 Middle East
- 5.5.1 North America
6 COMPETITIVE LANDSCAPE
- 6.1 Market Concentration
- 6.2 Strategic Moves
- 6.3 Market Share Analysis
- 6.4 Company Profiles (includes Global level Overview, Market level overview, Core Segments, Financials as available, Strategic Information, Market Rank/Share for key companies, Products and Services, and Recent Developments)
- 6.4.1 Maxar Technologies Inc.
- 6.4.2 Airbus Defence and Space SAS
- 6.4.3 Planet Labs PBC
- 6.4.4 BlackSky Technology Inc.
- 6.4.5 L3Harris Technologies Inc.
- 6.4.6 ICEYE Oy
- 6.4.7 Capella Space Corp.
- 6.4.8 Satellogic Inc.
- 6.4.9 Ursa Space Systems Inc.
- 6.4.10 European Space Imaging GmbH
- 6.4.11 ImageSat International N.V.
- 6.4.12 Galileo Group, Inc.
- 6.4.13 SpaceKnow Inc.
- 6.4.14 SI Imaging Services Co., Ltd.
- 6.4.15 Deimos Imaging S.L.U.
- 6.4.16 GHGSat Inc.
- 6.4.17 Spire Global, Inc.
- 6.4.18 Umbra Lab, Inc.
- 6.4.19 Earth-i Ltd.
- 6.4.20 Capella Federal LLC
- 6.4.21 Satellogic USA Inc.
- 6.4.22 Orbital Insight, Inc.
- 6.4.23 Pixxel Space Technologies Pvt. Ltd.
- 6.4.24 Kuva Space Oy
7 MARKET OPPORTUNITIES AND FUTURE OUTLOOK
- 7.1 White-space and Unmet-Need Assessment

 商業衛星影像市場:依成像方法、解析度等級、軌道等級和應用領域分類-全球預測,2026-2032年
 商業衛星影像市場規模、佔有率、趨勢和預測:按技術、應用、最終用戶和地區分類,2026-2034年
 2026年全球商業衛星影像市場報告
 商業衛星成像市場分析及預測(至2035年):按類型、產品、服務、技術、組件、應用、最終用戶、部署類型和功能分類
 全球商業衛星影像市場規模、佔有率、趨勢和成長分析報告(2026-2034年)
 商業衛星成像市場 - 全球產業規模、佔有率、趨勢、機會和預測(2021-2031 年)(按技術、應用、最終用戶、地區和競爭格局分類)
 商業衛星成像市場規模、佔有率和成長分析(按類型、最終用戶、應用和地區分類)—2026-2033年產業預測