


 |
市場調查報告書
商品編碼
2113888
穿戴式感測器:市場佔有率分析、行業趨勢和統計數據、成長預測(2026-2031 年)Wearable Sensors - Market Share Analysis, Industry Trends & Statistics, Growth Forecasts (2026 - 2031) |
||||||

※ 本網頁內容可能與最新版本有所差異。詳細情況請與我們聯繫。
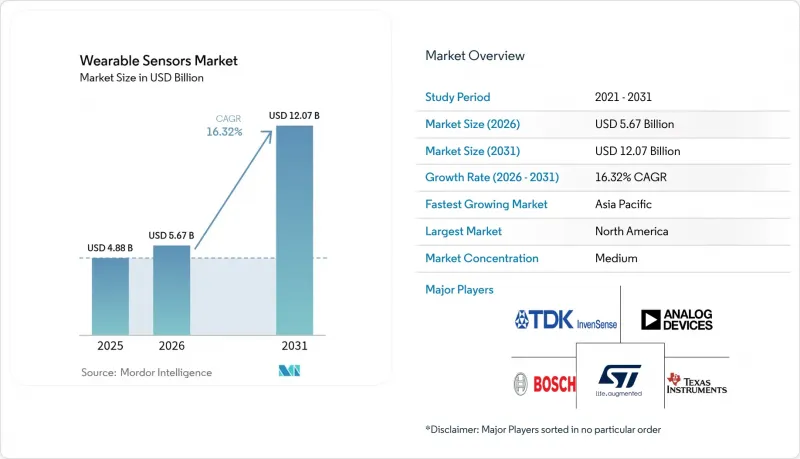
據 Mordor Intelligence 稱,穿戴式感測器市場預計到 2026 年價值 56.7 億美元,高於 2025 年的 48.8 億美元,預計到 2031 年將達到 120.7 億美元。
預計 2026 年至 2031 年的複合年成長率為 16.32%。
本報告按感測器類型(化學/氣體、壓力等)、應用領域(醫療保健等)、設備外形規格(智慧型手錶等)、終端用戶產業(一般消費者、醫療服務提供者等)、連接技術(NFC等)和地區進行細分。市場預測以美元計價。
全球穿戴式感測器市場趨勢及洞察
健身和預防醫學的蓬勃發展
消費者正從一次性治療轉向持續的健康管理,這推動了對智慧型手錶和貼片的持續需求,這些產品能夠追蹤代謝、睡眠和壓力徵兆。各公司正透過大規模的健康部署來加速這些產品的普及,這些部署在生產力和安全性方面帶來了可衡量的投資報酬率。例如,雪佛龍的補水貼片減少了中暑事件的發生。三星等公司推出的人工智慧指導模組可以將原始資料轉化為個人化指導,鼓勵用戶持續日常使用,並擴大演算法訓練的資料池。醫療保健提供者也從中受益。一項針對高血壓患者的遠端患者監護(RPM)計畫由於減少了急診就診次數,實現了22.2%的投資回報率,建立了報銷機制,並進一步推動了穿戴式感測器市場的擴張。
智慧型手錶出貨量激增。
隨著蘋果、三星以及新興的指環式智慧手錶廠商紛紛將血壓和神經訊號感測器整合到智慧手錶中,以在競爭激烈的外形規格中脫穎而出,全球智慧型手錶出貨量持續成長。意法半導體(STMicroelectronics)2024年第四季的MEMS(微機電系統)出貨收益增加至11.98億美元,凸顯了製造流程的韌性和價格彈性正在抑制平均售價。諸如三星對Oura提起的先發制人式訴訟等智慧財產權糾紛,顯示智慧手錶市場日趨成熟,專利和產品上市速度都成為至關重要的策略工具。
加強資料隱私監管
華盛頓州的《我的健康我的資料法案》和歐盟的《醫療設備法規》(MDR)增加了重複的知情同意和文件要求,提高了合規成本,並減緩了跨地區的推廣速度。在歐洲,僅有43家認證機構負責約50萬種醫療設備,造成了認證瓶頸。這使得已獲得傳統認證的公司擁有顯著優勢。
細分市場分析
到2025年,動作感測器將佔據穿戴式感測器市場33.60%的佔有率,為健身手環和手勢控制介面提供使用者運動分析支援。加速計、陀螺儀和磁力計的成本曲線已趨於穩定,儘管平均售價(ASP)面臨壓力,但仍能維持較高的毛利率。同時,生物感測器的複合年成長率(CAGR)預計將達到18.85%,隨著其應用範圍從血糖值測量擴展到透過皮膚接觸化學技術監測皮質醇,它們有望對現有市場格局產生挑戰。
生物感測器的發展勢頭源於聚合物微流體技術,該技術無需靜脈穿刺即可提供實驗室級的精確度。化學感測器和氣體感測器填補了工業安全領域的細分市場,而壓力感測器則支援無袖帶血壓測量應用。溫度感測器滿足職業健康領域預防熱應激的要求。成像和光學感測器正從用於心率監測的光學容積描記法轉向基於光學相干方法的創傷護理,預示著多模態融合時代的到來,這將擴大穿戴式感測器市場。
健康與保健領域佔銷售額的45.40%,反映了消費者成熟的消費習慣以及智慧型手機應用程式帶來的協同效應,從而降低了解約率。預計到2025年,健康與保健領域穿戴式感測器的市場規模將達到22.2億美元,並持續成長,這主要得益於高價值教練服務將硬體和訂閱服務打包銷售的趨勢。
遠端患者監護正以19.35%的複合年成長率快速發展,隨著保險公司尋求透過早期檢測降低成本,遠距病患監護的重要性日益凸顯。多感測器閘道可將資料傳送至雲端人工智慧系統,從而縮短醫療專業人員的回應時間,並透過提供與門診就診同等的保險報銷,提高醫療服務提供者的盈利。運動分析技術正持續擴展至動態領域,而用於工業安全的穿戴式設備也因其可衡量的工傷減少效果(例如,試點工廠的肌肉骨骼工傷賠償申請減少了30%)而獲得採購預算。
區域分析
預計到2025年,北美將佔全球收入的37.70%,這主要得益於聯邦醫療保險(Medicare)的遠距病患監護(RPM)代碼(用於報銷持續監測費用)以及企業健康預算對設備部署的津貼。創業投資的集中湧入正在扶持新創企業,推動神經介面等專用感測器技術的發展。然而,各州的資料相關法律正在加重合規負擔,並可能削弱跨境資料科學的綜效。
亞太地區正以18.05%的複合年成長率引領成長,這主要得益於中國零件工廠前置作業時間的縮短以及印度中產階級對低成本腕帶的接受度。日本的銀髮經濟推動了醫院對用於持續生命徵象監測的貼片的投資,而韓國不斷擴大的5G覆蓋範圍則加速了從雲端到邊緣的數據分析循環。電池供應方面的區域優勢也降低了成本上升的風險,但地緣政治摩擦可能會阻礙出口流動。
歐洲保持中等個位數的成長。醫療設備法規 (MDR) 帶來的產能限制阻礙了 CE 標誌的更新周期,實際上延長了醫療設備的更換週期,並減緩了創新步伐。然而,公共部門對電子醫療的需求仍然強勁,尤其是在德國《數位醫療法》的框架下,該法案為可連接應用程式的醫療設備提供津貼。在南歐和東歐,隨著遠端醫療彌合醫療服務取得的差距,需求正在逐步成長。
其他好處:
- Excel格式的市場預測(ME)表
- 3個月的分析師支持
目錄
第1章:引言
- 研究假設和市場定義
- 調查範圍
第2章:調查方法
第3章執行摘要
第4章 市場狀況
- 市場概覽
- 市場促進因素
- 健身和預防醫學蓬勃發展
- 智慧型手錶銷售激增
- MEMS成本降低和小型化
- 強制遠端患者監護
- 可黏附於皮膚的生物感測器取得了突破性進展。
- 企業ESG相關穿戴式裝置部署計劃
- 市場限制因素
- 加強資料隱私監管
- 多模態感測器的平均售價(ASP)較高。
- 鋰離子電池長期供不應求
- 演算法導致的種族偏見引發的訴訟風險
- 價值供應鏈分析
- 監理情勢
- 技術展望
- 波特五力分析
第5章 市場規模與成長預測
- 依感測器類型
- 化學品和氣體
- 壓力
- 影像/光學
- 運動
- 溫度
- 生物感測器
- 透過使用
- 健康與保健
- 安全監控
- 運動與健身
- 軍事和工業用途
- 按設備外形尺寸
- 智慧型手錶
- 修補
- 智慧服裝
- 智慧眼鏡
- 可聽見的
- 鞋類
- 按最終用戶行業分類
- 一般消費者
- 醫療服務提供方
- 行業/公司
- 國防和緊急應變機構
- 透過連接技術
- Bluetooth
- Wi-Fi
- NFC
- 蜂窩網路(LTE/5G)
- ANT+/專有標準
- 按地區
- 北美洲
- 美國
- 加拿大
- 墨西哥
- 南美洲
- 巴西
- 阿根廷
- 其他南美國家
- 歐洲
- 德國
- 英國
- 法國
- 義大利
- 西班牙
- 俄羅斯
- 其他歐洲國家
- 亞太地區
- 中國
- 日本
- 印度
- 韓國
- 澳洲
- 其他亞太國家
- 中東和非洲
- 中東
- 沙烏地阿拉伯
- UAE
- 土耳其
- 其他中東國家
- 非洲
- 南非
- 奈及利亞
- 其他非洲國家
- 中東
- 北美洲
第6章 競爭情勢
- 市場集中度
- 策略趨勢
- 市佔率分析
- 公司簡介
- STMicroelectronics
- Texas Instruments
- Infineon Technologies
- Analog Devices
- TDK/InvenSense
- AMS-OSRAM
- Panasonic
- NXP Semiconductors
- TE Connectivity
- Bosch Sensortec
- Apple
- Fitbit(Google)
- Samsung Electronics
- Huawei
- Sensirion
- Knowles Corporation
- Valencell
- Murata Manufacturing
- Honeywell International
- Qualcomm
第7章 市場機會與未來展望
According to Mordor Intelligence, wearable sensors market size in 2026 is estimated at USD 5.67 billion, growing from 2025 value of USD 4.88 billion with 2031 projections showing USD 12.07 billion, growing at 16.32% CAGR over 2026-2031.
This report is Segmented by Sensor Type (Chemical and Gas, Pressure and More), Application (Health and More), Device Form Factor (Smartwatches and More), End-User Industry (Consumer, Healthcare Providers and More), Connectivity Technology (NFC and More) and Geography. The Market Forecasts are Provided in Terms of Value (USD).
Global Wearable Sensors Market Trends and Insights
Fitness & Preventive-Health Boom
Consumers are shifting from episodic treatment toward continuous wellness management, driving recurring demand for smartwatches and patches that track metabolic, sleep, and stress signals. Corporations reinforce uptake through large-scale wellness deployments that deliver measurable ROI in productivity and safety, such as Chevron's hydration patches that lowered heat-related incidents. AI-powered coaching modules from Samsung and others convert raw metrics into personalized guidance, which sustains day-to-day engagement and expands data pools for algorithm training . Health-plan providers also gain: a hypertension RPM program posted a 22.2% ROI through reduced emergency visits, validating reimbursement pathways that further enlarge the wearable sensors market .
Smart-Watch Unit Surge
Global smartwatch shipments continue to climb as Apple, Samsung, and emerging ring vendors integrate blood-pressure and neuro-signal sensors to differentiate in a saturating form-factor race. STMicroelectronics' MEMS volume increased to USD 1.198 billion in Q4 2024, underscoring manufacturing resilience and price elasticity that keep average selling prices in check. IP battles, such as Samsung's pre-emptive lawsuit against Oura, signal a maturing arena where patents become a key strategic lever rather than speed-to-market alone
Data-Privacy Regulation Tightenings
Washington's My Health My Data Act and the EU MDR add overlapping consent and documentation obligations that lift compliance spend and slow multi-region rollouts. Only 43 notified bodies cover roughly 500,000 devices in Europe, creating certification bottlenecks that reward incumbents with legacy approvals
Other drivers and restraints analyzed in the detailed report include:
- MEMS Cost Downsizing
- Remote-Patient-Monitoring Mandates
- High ASP for Multimodal Sensors
For complete list of drivers and restraints, kindly check the Table Of Contents.
Segment Analysis
Motion sensors captured 33.60% of wearable sensors market share in 2025, anchoring user motion analytics across fitness bands and gesture-controlled interfaces. Accelerometers, gyroscopes, and magnetometers hold mature cost curves, preserving gross margins despite ASP pressure. Biosensors, however, post a 18.85% CAGR and will challenge this hierarchy as skin-conformal chemistry extends use cases from glucose to cortisol monitoring.
Biosensor momentum derives from polymer microfluidics that deliver laboratory-grade specificity without venipuncture. Chemical and gas sensors fill industrial safety niches, while pressure devices support cuff-less blood-pressure applications. Temperature sensors win occupational-health mandates for heat-stress prevention. Image and optical sensors migrate from heart-rate photoplethysmography toward optical coherence-based wound care, foreshadowing multimodal fusion that enlarges the wearable sensors market.
Health and wellness held 45.40% revenue, reflecting entrenched consumer behavior and smartphone app synergies that keep churn low. The wearable sensors market size for health and wellness reached USD 2.22 billion in 2025 and still expands as value-added coaching services bundle subscriptions with hardware.
Remote patient monitoring, advancing at 19.35% CAGR, gains ground as payers seek cost-avoidance through early detection. Multi-sensor gateways feeding cloud AI shorten clinician response times, and reimbursement parity with in-clinic visits strengthens provider economics. Sports analytics continue to grow into biomechanics, while industrial safety wearables earn procurement budgets through measurable injury reduction, such as 30% fewer musculoskeletal claims in pilot factories
Complete Report Scope:
- By Sensor Type
- Chemical and Gas
- Pressure
- Image / Optical
- Motion
- Temperature
- Biosensors
- By Application
- Health and Wellness
- Safety Monitoring
- Sports and Fitness
- Military and Industrial
- By Device Form Factor
- Smartwatches
- Patches
- Smart Clothing
- Smart Glasses
- Hearables
- Footwear
- By End-User Industry
- Consumer
- Healthcare Providers
- Industrial/Enterprise
- Defense and First Responders
- By Connectivity Technology
- Bluetooth
- Wi-Fi
- NFC
- Cellular (LTE/5G)
- ANT+ / Proprietary
- By Geography
- North America
- United States
- Canada
- Mexico
- South America
- Brazil
- Argentina
- Rest of South America
- Europe
- Germany
- United Kingdom
- France
- Italy
- Spain
- Russia
- Rest of Europe
- APAC
- China
- Japan
- India
- South Korea
- Australia
- Rest of APAC
- Middle East and Africa
- Middle East
- Saudi Arabia
- UAE
- Turkey
- Rest of Middle East
- Africa
- South Africa
- Nigeria
- Rest of Africa
- Middle East
- North America
Geography Analysis
North America commands 37.70% of 2025 revenue, underpinned by Medicare RPM codes that reimburse continuous monitoring and corporate wellness budgets that subsidize device rollouts. Venture-capital density anchors a startup pipeline that feeds specialized sensor modalities such as neural interfaces. Nonetheless, state-level data laws amplify compliance overhead and could dilute cross-border data-science synergies.
Asia-Pacific leads growth with an 18.05% CAGR as China's component factories compress lead times and India's middle-income cohort adopts low-cost wristbands. Japan's silver-economy drives hospital investments in continuous vitals patches, while South Korea's 5G coverage accelerates cloud-to-edge analytic loops. Regional dominance in battery supply also moderates cost inflation risks, though geopolitical frictions could disrupt export flows.
Europe sustains mid-single-digit growth. MDR capacity constraints impede CE-mark renewal cycles, effectively lengthening device replacement lifetimes and slowing innovation churn. Yet public-sector appetite for e-health remains strong, especially in Germany's Digital Healthcare Act framework that subsidizes app-linked devices. Southern and Eastern Europe see incremental demand as telemedicine fills provider-access gaps.
- STMicroelectronics
- Texas Instruments
- Infineon Technologies
- Analog Devices
- TDK / InvenSense
- AMS-OSRAM
- Panasonic
- NXP Semiconductors
- TE Connectivity
- Bosch Sensortec
- Apple
- Fitbit (Google)
- Samsung Electronics
- Huawei
- Sensirion
- Knowles Corporation
- Valencell
- Murata Manufacturing
- Honeywell International
- Qualcomm
Additional Benefits:
- The market estimate (ME) sheet in Excel format
- 3 months of analyst support
TABLE OF CONTENTS
1 INTRODUCTION
- 1.1 Study Assumptions and Market Definition
- 1.2 Scope of the Study
2 RESEARCH METHODOLOGY
3 EXECUTIVE SUMMARY
4 MARKET LANDSCAPE
- 4.1 Market Overview
- 4.2 Market Drivers
- 4.2.1 Fitness and preventive-health boom
- 4.2.2 Smart-watch unit surge
- 4.2.3 MEMS cost downsizing
- 4.2.4 Remote-patient-monitoring mandates
- 4.2.5 Skin-conformal bio-sensor breakthroughs
- 4.2.6 Corporate ESG-linked wearables programs
- 4.3 Market Restraints
- 4.3.1 Data-privacy regulation tightenings
- 4.3.2 High ASP for multimodal sensors
- 4.3.3 Chronic Li-ion cell shortages
- 4.3.4 Algorithmic racial-bias litigation risk
- 4.4 Value / Supply-Chain Analysis
- 4.5 Regulatory Landscape
- 4.6 Technological Outlook
- 4.7 Porters Five Forces Analysis
- 4.7.1 Threat of New Entrants
- 4.7.2 Bargaining Power of Suppliers
- 4.7.3 Bargaining Power of Buyers
- 4.7.4 Threat of Substitutes
- 4.7.5 Intensity of Rivalry
5 MARKET SIZE AND GROWTH FORECASTS (VALUE)
- 5.1 By Sensor Type
- 5.1.1 Chemical and Gas
- 5.1.2 Pressure
- 5.1.3 Image / Optical
- 5.1.4 Motion
- 5.1.5 Temperature
- 5.1.6 Biosensors
- 5.2 By Application
- 5.2.1 Health and Wellness
- 5.2.2 Safety Monitoring
- 5.2.3 Sports and Fitness
- 5.2.4 Military and Industrial
- 5.3 By Device Form Factor
- 5.3.1 Smartwatches
- 5.3.2 Patches
- 5.3.3 Smart Clothing
- 5.3.4 Smart Glasses
- 5.3.5 Hearables
- 5.3.6 Footwear
- 5.4 By End-User Industry
- 5.4.1 Consumer
- 5.4.2 Healthcare Providers
- 5.4.3 Industrial/Enterprise
- 5.4.4 Defense and First Responders
- 5.5 By Connectivity Technology
- 5.5.1 Bluetooth
- 5.5.2 Wi-Fi
- 5.5.3 NFC
- 5.5.4 Cellular (LTE/5G)
- 5.5.5 ANT+ / Proprietary
- 5.6 By Geography
- 5.6.1 North America
- 5.6.1.1 United States
- 5.6.1.2 Canada
- 5.6.1.3 Mexico
- 5.6.2 South America
- 5.6.2.1 Brazil
- 5.6.2.2 Argentina
- 5.6.2.3 Rest of South America
- 5.6.3 Europe
- 5.6.3.1 Germany
- 5.6.3.2 United Kingdom
- 5.6.3.3 France
- 5.6.3.4 Italy
- 5.6.3.5 Spain
- 5.6.3.6 Russia
- 5.6.3.7 Rest of Europe
- 5.6.4 APAC
- 5.6.4.1 China
- 5.6.4.2 Japan
- 5.6.4.3 India
- 5.6.4.4 South Korea
- 5.6.4.5 Australia
- 5.6.4.6 Rest of APAC
- 5.6.5 Middle East and Africa
- 5.6.5.1 Middle East
- 5.6.5.1.1 Saudi Arabia
- 5.6.5.1.2 UAE
- 5.6.5.1.3 Turkey
- 5.6.5.1.4 Rest of Middle East
- 5.6.5.2 Africa
- 5.6.5.2.1 South Africa
- 5.6.5.2.2 Nigeria
- 5.6.5.2.3 Rest of Africa
- 5.6.5.1 Middle East
- 5.6.1 North America
6 COMPETITIVE LANDSCAPE
- 6.1 Market Concentration
- 6.2 Strategic Moves
- 6.3 Market Share Analysis
- 6.4 Company Profiles (includes Global level Overview, Market level overview, Core Segments, Financials as available, Strategic Information, Market Rank/Share, Products & Services, Recent Developments)
- 6.4.1 STMicroelectronics
- 6.4.2 Texas Instruments
- 6.4.3 Infineon Technologies
- 6.4.4 Analog Devices
- 6.4.5 TDK / InvenSense
- 6.4.6 AMS-OSRAM
- 6.4.7 Panasonic
- 6.4.8 NXP Semiconductors
- 6.4.9 TE Connectivity
- 6.4.10 Bosch Sensortec
- 6.4.11 Apple
- 6.4.12 Fitbit (Google)
- 6.4.13 Samsung Electronics
- 6.4.14 Huawei
- 6.4.15 Sensirion
- 6.4.16 Knowles Corporation
- 6.4.17 Valencell
- 6.4.18 Murata Manufacturing
- 6.4.19 Honeywell International
- 6.4.20 Qualcomm
7 MARKET OPPORTUNITIES AND FUTURE OUTLOOK
- 7.1 White-Space and Unmet-Need Assessment

 穿戴式感測器市場分析及預測(至2035年):按類型、產品、服務、技術、組件、應用、形狀、材料類型、最終用戶和功能分類
 穿戴式感測器市場規模、佔有率、成長及全球產業分析:按感測器類型、裝置類型、最終用戶和地區劃分的洞察與預測(2026-2034年)
 穿戴式感測器市場規模、佔有率和成長分析(按應用、感測器類型、最終用戶、外形規格和地區分類)—2026-2033年產業預測
 穿戴式感測器市場-全球產業規模、佔有率、趨勢、機會及預測(按類型、應用、地區和競爭格局分類,2020-2030 年預測)
 穿戴式裝置市場中的 HMI 感測器,按感測器類型、穿戴式裝置類型、應用、技術、國家和地區分類 - 2025 年至 2032 年全球產業分析、市場規模、市場佔有率及預測
 穿戴式裝置中的 HMI 感測器市場規模、佔有率、趨勢分析報告:按感測器類型、裝置類型、應用、最終用途、地區、細分市場預測,2025 年至 2030 年2026 年至 2032 年穿戴式感測器市場類型、裝置、應用和地區分佈
 中東和非洲穿戴式感測器市場佔有率分析、產業趨勢、統計數據和成長預測(2025-2030 年)北美穿戴式感測器:市場佔有率分析、產業趨勢和成長預測(2025-2030)拉丁美洲穿戴式感測器:市場佔有率分析、產業趨勢、產業趨勢、成長預測(2025-2030)