


 |
市場調查報告書
商品編碼
2113765
壓接端子:市場佔有率分析、產業趨勢與統計、成長預測(2026-2031 年)Cable Lugs - Market Share Analysis, Industry Trends & Statistics, Growth Forecasts (2026 - 2031) |
||||||

※ 本網頁內容可能與最新版本有所差異。詳細情況請與我們聯繫。
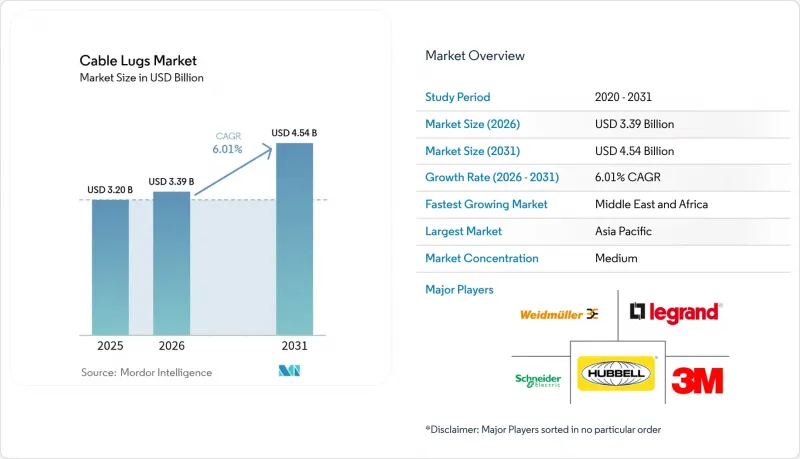
2025 年壓接端子市場價值為 32 億美元,預計到 2031 年將達到 45.4 億美元,而 2026 年為 33.9 億美元,預測期(2026-2031 年)複合年成長率為 6.01%。
本報告按材質(銅、鋁等)、接線端子類型(環形接線端子、叉形接線端子等)、終端用戶行業(建築、汽車、能源和公共產業等)、安裝方式(壓接接線端子、焊接接線端子等)、絕緣類型(非絕緣、部分絕緣、全絕緣)和區域進行細分。市場預測以美元(USD)為單位。
全球壓接端子市場趨勢與洞察
電網現代化並加速可再生能源併網
美國、歐盟和亞太地區的電力公司正在更換老舊輸電線路中的導線,並開發高壓直流 (HVDC) 輸電線路,這些線路需要能夠承受 500 千伏或更高電壓的認證壓接端子。電網韌性與夥伴關係夥伴關係計畫已撥款 105 億美元用於 2024 年的變電站現代化改造,這推動了對壓接端子的需求,這種端子能夠承受比傳統鋼芯鋁絞線 (ACSR) 導線高 40% 的熱膨脹係數。北海和台灣海峽的離岸風力發電網正在使用矽絕緣鍍錫銅端子,即使在鹽水環境中,其介電強度也能保持在 10 kV/mm 或更高。電力研究院 (EPRI) 建議在帶電作業中使用機械端子,這可以將每次接頭的停電時間從 8 小時縮短到 90 分鐘。因此,壓接端子市場受益於與法規和可再生能源目標相關的穩定採購週期,從而增強了電網的容錯能力。
商用車動力傳動系統的電氣化
電池驅動的電動卡車和巴士正在向 800 伏特架構過渡,這需要額定電流為 500 安培或更高的壓接端子,以及能夠在 150 度C下連續工作的絕緣材料。 ISO 6469-3 和 IEEE 2030.1 標準要求端子加工必須具備接觸安全功能和二次鎖定功能,這促使原始設備製造商 (OEM) 採用全絕緣環形接線片。 2024 年生效的歐洲法規強制要求 12 噸以上的車輛使用帶有可追溯標記的 UL 認證壓接端子,這提高了低成本供應商的准入門檻。電池組中使用的壓縮式壓接方法可將組裝時間縮短 25%,但需要使用噸位公差在 5% 以內的液壓接機。隨著車隊電氣化程度的提高,重型行動應用領域的壓接端子市場可望盈利成長。
銅鋁價格波動
2024年,銅現貨價格在每噸8,400美元至1,0,200美元之間波動,而鋁的價格則在每噸2,300美元至2,700美元之間波動。壓接端子製造商的毛利率為18%至22%,這意味著在不增加利潤的情況下,他們幾乎沒有空間來消化不斷上漲的原物料價格。承包商通常在開工前90天最終確定材料,如果在此期間銅價上漲兩位數,專案的利潤率可能會下降多達4個百分點。因此,儘管鋁製端子的筒體直徑比銅製端子大60%,但一些買家仍選擇使用鋁製端子。由於市場持續波動,壓接端子市場的短期前景仍然不明朗,但銅包鋁混合端子正在緩解部分問題。
細分市場分析
銅的導電率為 58 MS/m,適用於變電站和資料中心的大電流電路,預計到 2025 年將佔總銷售額的 44.85%。隨著汽車製造商將動力傳動系統重量減輕 3-5 公斤,預計到 2031 年,塑膠接線端子的複合年成長率將達到 7.84%。鋁製接線端子在公用事業規模的太陽能發電領域市場佔有率不斷成長,其 35% 的成本優勢彌補了直徑較大的劣勢。不銹鋼接線端子目前仍屬於小眾產品,但在化學和船舶應用領域,其價格溢價高達 200%。銅壓接端子的市場規模預計將穩定成長,但會被塑膠和鋁製替代品蠶食幾個百分點的市場佔有率。複合材料接線端子採用玻璃纖維增強尼龍和黃銅嵌件,定位為中價位產品,重量減輕 40%,同時符合 IEC 61238-1 拉拔強度標準。銅包鋁混合產品具有銅90%的導電率,重量卻只有銅的一半,但由於美國電氣規範 (NEC) 的規定,其應用僅限於400安培以下的電路。因此,供應商正在調整產品線,以在不斷變化的法規要求下,平衡導電率、耐腐蝕性和成本。
當ETP和OFHC等銅等級的溢價推高平均售價時,壓接端子市場也會受益。然而,一旦大宗商品價格波動導致專案預算緊張,這些正面影響就會被抵消。製造商正透過利用虛擬倉庫計畫來對沖業務風險並穩定收入來源,這些計畫可在下單時鎖定金屬價格。塑膠接線片也為耐溫等級高於150 度C的熱縮套管創造了新的售後市場,為經銷商帶來了額外的收入。總而言之,材料的多樣化確保了市場即使在銅價長期持續上漲的情況下也能保持強勁成長。
到2025年,環形接線端子將佔總銷售額的33.25%,因為其360度接觸面滿足變電站嚴格的接地故障和短路要求。對接式接線端子的複合年成長率預計將達到8.79%,因為太陽能和風能開發商更傾向於使用模組化線束,這種線束可以減少35%的現場人工。叉形接線端子適用於需要頻繁斷開的控制面板,而針形接線端子則廣泛用於歐洲機械中常見的螺絲式接線端子。偏置舌片式和旗形接線端子適用於空間有限的電池機殼和通訊櫃。儘管環形接線端子在壓接端子市場的佔有率預計會略有下降,但由於電力公司和工業企業高度重視其數十年來久經考驗的性能,預計它們仍將保持主導地位。開發商目前正在導線更換專案中採用對接式接線端子,以便在尖峰負載期前加快施工進度,這種方法也得到了EPRI現場試驗的支持。
隨著接接頭需求的成長,製造商被迫向市場推出符合UL 486A-486B標準的、壓縮比保持在75-85%的新型模具。快速更換模具頭可將工具停機時間減少20%,進而提高施工人員的生產效率。叉形接線端子正面臨彈簧籠式連接器的競爭壓力,後者允許在低電流電路中進行免工具安裝。儘管如此,由於老舊控制面板的維修,預計到2031年,對叉形和針式連接器的需求仍將持續。因此,均衡開發各種接線端子類型的產品對於掌握壓接端子市場的整體機會仍然至關重要。
區域分析
2025年,亞太地區佔全球銷售額的39.85%。這主要得益於中國新增120吉瓦太陽能發電和75吉瓦風電裝置容量,這兩項工程均需每兆瓦300-500個接線端子用於逆變器和接地迴路。印度在2024年新增18吉瓦可再生能源裝置容量,並計畫在2030年實現500吉瓦非石化燃料發電裝置容量,將持續推動對33千伏和66千伏額定壓接式接線端子的需求。日本和韓國都在推進超過5吉瓦的離岸風力發電項目,需要耐鹽霧的鍍錫銅接線端子。在東南亞,為滿足每年7%的負載成長,新建的煤電和燃氣電廠正在興建中,發電機升壓變壓器需要使用機械式接線端子。澳洲計畫在2030年安裝3吉瓦的電池儲能系統,每兆瓦時使用200-300個接線端子。這些遍布亞太地區的項目鞏固了主導地位。
受沙烏地阿拉伯58.7吉瓦可再生能源發展藍圖和阿拉伯聯合大公國5吉瓦阿達夫拉太陽能發電廠的推動,中東和非洲地區預計將以8.05%的複合年成長率成長,這將提振市場需求。埃及1.8吉瓦的本班綜合體已在其中壓電網中使用了超過50萬個壓接端子。同時,南非的再生能源獨立電力生產商採購計畫(REIPPP)已採納一項2.6吉瓦的項目,該項目需要為200公里長的輸電線路配備132千伏終端。奈及利亞正在升級其變電站,以容納4吉瓦的新增發電容量,並使用機械端子進行帶電維護。土耳其將在2024年生產的15萬輛電動車中使用全絕緣端子,以符合出口法規。這些趨勢正在推動該地區壓接端子市場佔有率的成長。
北美和歐洲合計約佔市場佔有率的5.00%。美國電網韌性與創新夥伴關係(GRIP)計畫正在資助58個項目,訂購約200萬個接線端子,用於輸電線路和變電站的升級改造。到2024年,德國離岸風力發電裝置容量將達到8.5吉瓦,每颱風力發電機組將配備80至120個用於機艙佈線的接線端子。英國2024年建築安全法案強制要求承包商使用經過工廠測試且有可追溯序號的接線端子。南美洲的需求成長較為溫和,巴西在2024年新增了4.5吉瓦的風電裝置容量,而阿根廷的瓦卡穆爾塔加斯計畫則強制要求在偏遠變電站使用機械式接線端子。因此,地理多樣性使得壓接端子市場能夠減輕特定地區需求放緩的影響。
其他好處:
- Excel格式的市場預測(ME)表
- 3個月的分析師支持
目錄
第1章:引言
- 研究假設和市場定義
- 調查範圍
第2章:調查方法
第3章執行摘要
第4章 市場狀況
- 市場概覽
- 市場促進因素
- 電網現代化並加速可再生能源併網
- 商用車動力傳動系統的電氣化
- 資料中心建設激增,對低電阻接地提出了更高的要求
- 模組化建築中預製線束的迅速普及
- 嚴格的安全標準要求使用絕緣壓接端子。
- 政府對工業節能維修的誘因
- 市場限制因素
- 銅鋁價格波動
- 雷射直接焊接端子正在蠶食對接線片的需求。
- 高品質仿冒品的氾濫
- 缺乏技術純熟勞工進行正確的壓接和安裝。
- 產業價值鏈分析
- 宏觀經濟因素的影響
- 監管狀態(IEC、BS 和其他主要標準)
- 技術展望
- 波特五力分析
第5章 市場規模與成長預測
- 材料類型
- 銅
- 鋁
- 塑膠
- 其他材料類型(例如不銹鋼)
- 按地毯類型
- 環形凸耳
- 民間地毯
- 銷滯後
- 對接接頭耳片
- 其他
- 按最終用戶行業分類
- 建造
- 車
- 能源公用事業
- 製造/加工
- 其他終端用戶產業
- 透過安裝方法
- 褶皺地毯
- 焊片
- 壓縮地毯
- 機械式凸耳
- 按隔熱材料類型
- 非絕緣
- 部分絕緣
- 完全隔熱
- 按地區
- 北美洲
- 美國
- 加拿大
- 墨西哥
- 南美洲
- 巴西
- 阿根廷
- 其他南美國家
- 歐洲
- 德國
- 英國
- 法國
- 義大利
- 西班牙
- 俄羅斯
- 其他歐洲國家
- 亞太地區
- 中國
- 日本
- 印度
- 韓國
- 澳洲
- 其他亞太國家
- 中東和非洲
- 中東
- 沙烏地阿拉伯
- 阿拉伯聯合大公國
- 土耳其
- 其他中東國家
- 非洲
- 南非
- 奈及利亞
- 埃及
- 其他非洲國家
- 中東
- 北美洲
第6章 競爭情勢
- 市場集中度
- 策略趨勢
- 市佔率分析
- 公司簡介
- The 3M Company
- Weidmuller Interface GmbH and Co. KG
- Legrand SA
- Schneider Electric SE
- Hubbell Incorporated
- ABB Ltd.
- Eaton Corporation plc
- Klauke GmbH(Emerson Electric Co.)
- Chatsworth Products Inc
- Amphenol Corporation
- Panduit Corp.
- TE Connectivity Ltd.
- Burndy LLC
- Molex LLC
- HellermannTyton Group PLC
- NKT A/S
- Nicomatic SA
- Glenair Inc.
第7章 市場機會與未來展望
According to Mordor Intelligence, the cable lugs market size was valued at USD 3.20 billion in 2025 and estimated to grow from USD 3.39 billion in 2026 to reach USD 4.54 billion by 2031, at a CAGR of 6.01% during the forecast period (2026-2031).
This report is Segmented by Material Type (Copper, Aluminum, and More), Lug Type (Ring Lugs, Fork Lugs, and More), End-User Industry (Construction, Automotive, Energy and Utilities, and More), Installation Method (Crimp Lugs, Solder Lugs, and More), Insulation Type (Non-Insulated, Partially Insulated, and Fully Insulated), and Geography. The Market Forecasts are Provided in Terms of Value (USD).
Global Cable Lugs Market Trends and Insights
Accelerated Grid Modernization And Renewable Energy Interconnections
Utilities in the United States, the European Union, and the Asia-Pacific are reconductoring legacy lines and adding high-voltage direct-current corridors that require cable lugs qualified for voltages above 500 kilovolts. The Grid Resilience and Innovation Partnerships program allocated USD 10.5 billion in 2024 to modernize substations, which boosts demand for compression lugs that withstand thermal expansion 40% higher than traditional ACSR conductors. Offshore wind interconnections in the North Sea and Taiwan Strait utilize tinned-copper lugs with silicone insulation, which maintain dielectric strength above 10 kV/mm in saltwater environments. The Electric Power Research Institute recommends mechanical lugs for live-line work to reduce outage windows from eight hours to 90 minutes per splice. Consequently, the cable lugs market benefits from steady procurement cycles tied to grid-hardening mandates and renewable energy targets.
Electrification Of Commercial Vehicle Powertrains
Battery-electric trucks and buses are transitioning to 800-volt architectures, which require cable lugs rated above 500 amperes and insulation materials capable of continuous operation at 150 °C. ISO 6469-3 and IEEE 2030.1 standards require touch-safe terminations with secondary locking features, steering OEMs toward fully insulated ring lugs. European regulations introduced in 2024 require vehicles exceeding 12 tons to utilize UL-listed cable lugs with traceability markings, which raises entry barriers for low-cost suppliers. The compression approach used in battery packs reduces assembly time by 25% but relies on hydraulic crimpers that are calibrated within a 5% tonnage tolerance. As fleet electrification scales, the cable lugs market gains a lucrative growth avenue in heavy-duty mobility applications.
Volatility In Copper And Aluminum Prices
Copper spot prices oscillated between USD 8,400 and USD 10,200 t-1 during 2024, while aluminum traded from USD 2,300 to USD 2,700 t-1. Cable lug manufacturers operate on gross margins of 18-22%, leaving limited room to absorb raw material spikes without incurring price surcharges. Contractors typically lock materials 90 days before mobilization, but double-digit copper hikes during that window can erode project margins by up to 4 percentage points. Some buyers, therefore, switch to aluminum lugs despite 60% larger barrel diameters. Persistent volatility clouds the short-term outlook for the cable lugs market, although hybrid copper-clad aluminum lugs offer partial relief.
Other drivers and restraints analyzed in the detailed report include:
- Surge In Data-Center Construction Requiring Low-Impedance Grounding
- Rapid Adoption Of Prefabricated Wiring Harnesses In Modular Buildings
- Direct Laser-Welded Terminals Cannibalizing Lug Demand
For complete list of drivers and restraints, kindly check the Table Of Contents.
Segment Analysis
Copper still accounts for 44.85% of 2025 revenue, as its 58 MS m-1 conductivity supports high-ampere circuits in substations and data centers. Plastic lugs are projected to expand at an 7.84% CAGR to 2031, as automakers reduce the weight of powertrains by 3-5 kg. Aluminum lugs gain market share in utility-scale solar, where a 35% cost advantage offsets their larger diameter. Stainless-steel lugs remain a niche product but command a 200% price premium for use in chemical and marine applications. The cable lugs market size for copper products is poised to rise steadily, but it will lose a few points of market share to plastic and aluminum alternatives. Composite lugs pairing glass-fiber-reinforced nylon with brass inserts cut weight by 40% while satisfying IEC 61238-1 pull-out thresholds, positioning them as mid-range options. Copper-clad aluminum hybrids deliver 90% of copper conductivity at half the weight, yet National Electrical Code rules confine them to circuits below 400 A. Suppliers therefore juggle portfolios that balance conductivity, corrosion resistance, and cost under shifting regulatory rules.
The cable lugs market benefits when copper grades, such as ETP and OFHC, command price premiums that lift average selling prices; however, the upside is offset whenever volatile commodity swings squeeze project budgets. Manufacturers hedge their operations with virtual warehousing programs that lock in metal at the time of purchase order placement, thereby smoothing revenue flows. Plastic lugs also open up a new aftermarket for heat-shrink sleeves rated above 150 °C, providing distributors with complementary revenue. Altogether, material diversification ensures resilient market growth even if copper prices trend upward for prolonged periods.
Ring lugs account for 33.25% of 2025 revenue, as their 360-degree contact profile meets stringent ground-fault and short-circuit requirements in substations. Butt splice lugs are recording a 8.79% CAGR as solar and wind developers favor modular harnesses that cut site labor by 35%. Fork lugs address control panels that require frequent disconnections, whereas pin lugs populate screw-clamp terminal blocks commonly found in European machinery. Offset-tongue and flag styles are suitable for confined battery enclosures and telecom cabinets. The cable lugs market share for ring lugs will erode modestly yet remain dominant, as utilities and industrial plants value the decades of proven performance. Developers now deploy butt splice lugs on reconductoring projects to speed work before peak-load seasons, a practice supported by EPRI field trials.
Growth in butt splice demand compels manufacturers to launch new die sets that maintain compression ratios of 75-85% per UL 486A-486B. Quick-change die heads cut tool downtime by 20%, enhancing contractor productivity. Fork lugs face shared pressure from spring-cage connectors, which offer tool-less installation in low-current circuits. Still, retrofit work on aging control panels will support fork and pin variants through 2031. Balanced product development across lug types thus remains vital to capture opportunities throughout the cable lugs market.
Complete Report Scope:
- By Material Type
- Copper
- Aluminum
- Plastic
- Other Material Types (Stainless Steel and Others)
- By Lug Type
- Ring Lugs
- Fork Lugs
- Pin Lugs
- Butt Splice Lugs
- Others
- By End-user Industry
- Construction
- Automotive
- Energy and Utilities
- Manufacturing and Processing
- Other End-user Verticals
- By Installation Method
- Crimp Lugs
- Solder Lugs
- Compression Lugs
- Mechanical Lugs
- By Insulation Type
- Non-Insulated
- Partially Insulated
- Fully Insulated
- By Geography
- North America
- United States
- Canada
- Mexico
- South America
- Brazil
- Argentina
- Rest of South America
- Europe
- Germany
- United Kingdom
- France
- Italy
- Spain
- Russia
- Rest of Europe
- Asia-Pacific
- China
- Japan
- India
- South Korea
- Australia
- Rest of Asia-Pacific
- Middle East and Africa
- Middle East
- Saudi Arabia
- United Arab Emirates
- Turkey
- Rest of Middle East
- Africa
- South Africa
- Nigeria
- Egypt
- Rest of Africa
- Middle East
- North America
Geography Analysis
Asia-Pacific accounted for 39.85% of 2025 revenue thanks to China's 120 GW solar and 75 GW wind additions that each need 300-500 lugs per megawatt for inverter and grounding circuits. India installed 18 GW of renewables in 2024 and targets 500 GW non-fossil capacity by 2030, keeping compression lugs rated 33 and 66 kV in continuous demand. Japan and South Korea advance offshore wind pipelines beyond 5 GW each, requiring salt-spray-resistant tinned-copper lugs. Southeast Asia adds coal and gas plants to meet 7% annual load growth, thus buying mechanical lugs for generator step-up transformers. Australia plans 3 GW of battery storage by 2030, employing 200-300 lugs per megawatt-hour. Collectively, Asia-Pacific projects cement the region's lead in the cable lugs market.
The Middle East and Africa are projected to grow at an 8.05% CAGR, driven by Saudi Arabia's 58.7 GW renewables roadmap and the United Arab Emirates' 5 GW Al Dhafra solar park, which boosts demand. Egypt's 1.8 GW Benban complex used more than 500,000 compression lugs for medium-voltage grids, while South Africa's REIPPP awarded 2.6 GW of projects that need 132 kV terminations spanning 200 km lines. Nigeria upgrades substations to accommodate 4 GW of new capacity, opting for mechanical lugs for live-line maintenance. Turkey's 150,000 EVs built in 2024 rely on fully insulated lugs for export compliance. These developments propel regional share in the cable lugs market.
North America and Europe collectively account for approximately 5.00% of the market. The U.S. Grid Resilience and Innovation Partnerships program funds 58 projects that will order roughly 2 million lugs for reconductoring and substation upgrades. Germany's offshore wind fleet reached 8.5 GW in 2024, with each turbine carrying 80-120 lugs of nacelle wiring. The UK Building Safety Act 2024 requires contractors to use factory-tested lugs with traceable serial numbers. South America experiences a moderate uptake, as Brazil added 4.5 GW of wind in 2024, whereas Argentina's Vaca Muerta gas program requires mechanical lugs for remote substations. Geographic diversity thus cushions the cable lugs market against localized slowdowns.
- The 3M Company
- Weidmuller Interface GmbH and Co. KG
- Legrand SA
- Schneider Electric SE
- Hubbell Incorporated
- ABB Ltd.
- Eaton Corporation plc
- Klauke GmbH (Emerson Electric Co.)
- Chatsworth Products Inc
- Amphenol Corporation
- Panduit Corp.
- TE Connectivity Ltd.
- Burndy LLC
- Molex LLC
- HellermannTyton Group PLC
- NKT A/S
- Nicomatic SA
- Glenair Inc.
Additional Benefits:
- The market estimate (ME) sheet in Excel format
- 3 months of analyst support
TABLE OF CONTENTS
1 INTRODUCTION
- 1.1 Study Assumptions and Market Definition
- 1.2 Scope of the Study
2 RESEARCH METHODOLOGY
3 EXECUTIVE SUMMARY
4 MARKET LANDSCAPE
- 4.1 Market Overview
- 4.2 Market Drivers
- 4.2.1 Accelerated grid modernization and renewable energy interconnections
- 4.2.2 Electrification of commercial vehicle powertrains
- 4.2.3 Surge in data-center construction requiring low-impedance grounding
- 4.2.4 Rapid adoption of prefabricated wiring harnesses in modular buildings
- 4.2.5 Stringent safety codes mandating insulated compression lugs
- 4.2.6 Government incentives for industrial energy-efficiency retrofits
- 4.3 Market Restraints
- 4.3.1 Volatility in copper and aluminum prices
- 4.3.2 Direct laser-welded terminals cannibalising lug demand
- 4.3.3 Proliferation of quality counterfeits
- 4.3.4 Skilled-labour shortage for correct crimping and installation
- 4.4 Industry Value Chain Analysis
- 4.5 Impact of Macroeconomic Factors
- 4.6 Regulatory Landscape (IEC, BS and other major standards)
- 4.7 Technological Outlook
- 4.8 Porter's Five Forces Analysis
- 4.8.1 Bargaining Power of Suppliers
- 4.8.2 Bargaining Power of Buyers
- 4.8.3 Threat of New Entrants
- 4.8.4 Threat of Substitute Products
- 4.8.5 Intensity of Competitive Rivalry
5 MARKET SIZE AND GROWTH FORECASTS (VALUE)
- 5.1 By Material Type
- 5.1.1 Copper
- 5.1.2 Aluminum
- 5.1.3 Plastic
- 5.1.4 Other Material Types (Stainless Steel and Others)
- 5.2 By Lug Type
- 5.2.1 Ring Lugs
- 5.2.2 Fork Lugs
- 5.2.3 Pin Lugs
- 5.2.4 Butt Splice Lugs
- 5.2.5 Others
- 5.3 By End-user Industry
- 5.3.1 Construction
- 5.3.2 Automotive
- 5.3.3 Energy and Utilities
- 5.3.4 Manufacturing and Processing
- 5.3.5 Other End-user Verticals
- 5.4 By Installation Method
- 5.4.1 Crimp Lugs
- 5.4.2 Solder Lugs
- 5.4.3 Compression Lugs
- 5.4.4 Mechanical Lugs
- 5.5 By Insulation Type
- 5.5.1 Non-Insulated
- 5.5.2 Partially Insulated
- 5.5.3 Fully Insulated
- 5.6 By Geography
- 5.6.1 North America
- 5.6.1.1 United States
- 5.6.1.2 Canada
- 5.6.1.3 Mexico
- 5.6.2 South America
- 5.6.2.1 Brazil
- 5.6.2.2 Argentina
- 5.6.2.3 Rest of South America
- 5.6.3 Europe
- 5.6.3.1 Germany
- 5.6.3.2 United Kingdom
- 5.6.3.3 France
- 5.6.3.4 Italy
- 5.6.3.5 Spain
- 5.6.3.6 Russia
- 5.6.3.7 Rest of Europe
- 5.6.4 Asia-Pacific
- 5.6.4.1 China
- 5.6.4.2 Japan
- 5.6.4.3 India
- 5.6.4.4 South Korea
- 5.6.4.5 Australia
- 5.6.4.6 Rest of Asia-Pacific
- 5.6.5 Middle East and Africa
- 5.6.5.1 Middle East
- 5.6.5.1.1 Saudi Arabia
- 5.6.5.1.2 United Arab Emirates
- 5.6.5.1.3 Turkey
- 5.6.5.1.4 Rest of Middle East
- 5.6.5.2 Africa
- 5.6.5.2.1 South Africa
- 5.6.5.2.2 Nigeria
- 5.6.5.2.3 Egypt
- 5.6.5.2.4 Rest of Africa
- 5.6.5.1 Middle East
- 5.6.1 North America
6 COMPETITIVE LANDSCAPE
- 6.1 Market Concentration
- 6.2 Strategic Moves
- 6.3 Market Share Analysis
- 6.4 Company Profiles (includes Global level Overview, Market level overview, Core Segments, Financials as available, Strategic Information, Market Rank/Share for key companies, Products and Services, and Recent Developments)
- 6.4.1 The 3M Company
- 6.4.2 Weidmuller Interface GmbH and Co. KG
- 6.4.3 Legrand SA
- 6.4.4 Schneider Electric SE
- 6.4.5 Hubbell Incorporated
- 6.4.6 ABB Ltd.
- 6.4.7 Eaton Corporation plc
- 6.4.8 Klauke GmbH (Emerson Electric Co.)
- 6.4.9 Chatsworth Products Inc
- 6.4.10 Amphenol Corporation
- 6.4.11 Panduit Corp.
- 6.4.12 TE Connectivity Ltd.
- 6.4.13 Burndy LLC
- 6.4.14 Molex LLC
- 6.4.15 HellermannTyton Group PLC
- 6.4.16 NKT A/S
- 6.4.17 Nicomatic SA
- 6.4.18 Glenair Inc.
7 MARKET OPPORTUNITIES AND FUTURE OUTLOOK
- 7.1 White-space and Unmet-need Assessment

 編織屏蔽電纜市場報告:趨勢、預測和競爭分析(至2035年)
 混合電纜市場規模、佔有率、成長、全球產業分析、區域趨勢及2026-2034年預測
 公用事業規模非金屬導線管市場機會、成長促進因素、產業趨勢分析及 2026-2035 年預測。
 電纜及配件市場:2026-2032年全球市場預測(依電纜類型、材質、電壓等級、安裝類型、最終用戶產業及通路分類)
 非金屬電氣導管市場規模、佔有率和成長分析:按產品類型、導管尺寸、應用、最終用戶產業、安裝類型、分銷管道和地區分類-2026-2033年產業預測
 電纜及附件市場預測至2034年-按電壓、功率範圍、最終用戶及地區分類的全球分析大電流電連接器市場報告:趨勢、預測與競爭分析(至2035年)
 塑膠導管市場報告:按類型、材料、產業和地區分類,2026-2034年磁性數據電纜市場報告:趨勢、預測和競爭分析(至2035年)軟性扁平電纜市場:依產品類型、材質、導體數量、間距尺寸、寬度及最終用途產業分類-2026-2032年全球市場預測