


 |
市場調查報告書
商品編碼
2113750
藍牙LED燈泡:市佔率分析、產業趨勢與統計及成長預測(2026-2031年)Bluetooth LED Bulb - Market Share Analysis, Industry Trends & Statistics, Growth Forecasts (2026 - 2031) |
||||||

※ 本網頁內容可能與最新版本有所差異。詳細情況請與我們聯繫。
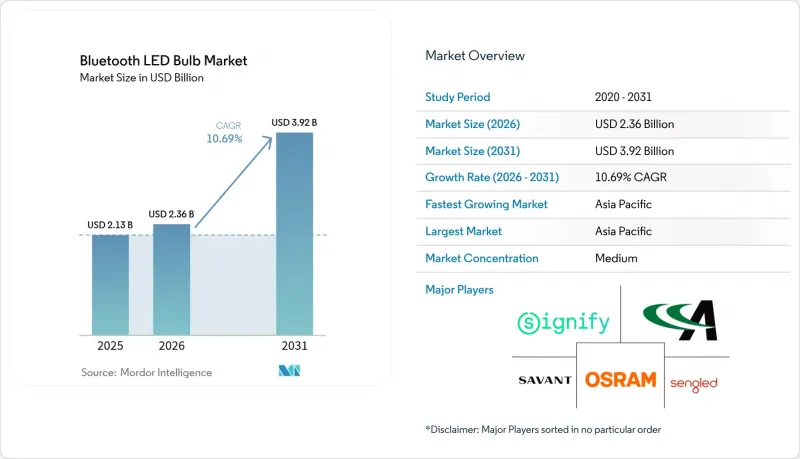
據 Mordor Intelligence 稱,2025 年藍牙 LED 燈泡的市場規模為 21.3 億美元,預計到 2031 年將從 2026 年的 23.6 億美元成長至 39.2 億美元,預測期(2026-2031 年)的複合年成長率為 10.69%。
本報告按最終用戶(工業、商業、住宅)、燈泡類型(標準 A19/A60、反射式 BR/PAR、蠟燭型、裝飾型等)、功率(9W 以下、9W-14W 及其他)、連接協議(經典藍牙、低功耗藍牙及其他)、銷售管道(線上零售、線下零售及其他)和地區進行細分。市場預測以美元計價。
全球藍牙LED燈泡市場趨勢及洞察
智慧家庭對節能照明的需求日益成長
儘管2024年照明用電量僅佔住宅用電量的不到8%,但由於語音助理生態系統和電力公司的補貼,每戶家庭的智慧燈具數量加倍。隨著歐盟生態設計指令禁止使用鹵素燈和螢光管,藍牙LED燈的普及率大幅提升,這些燈具無需重新佈線即可實現調光和色溫調節。德國和法國的維修率均超過3%,並且正在將智慧控制面板整合到新的佈線方案中。在美國,每個智慧燈泡可獲得15至25美元的補貼,將投資回收期縮短至不到12個月。這些措施共同促成了住宅領域主導力量。
物聯網和智慧建築基礎設施的普及
開發者將藍牙Mesh照明視為基礎架構,因為照明設備本身也具備分散式感測器平台的功能。國際能源總署(IEA)的測量數據顯示,維修的辦公大樓透過基於人員佔用數據控制暖通空調(HVAC)運作時間表,實現了18%至22%的節能效果。超過6公尺高的工廠天花板需要功率超過14瓦的燈泡才能滿足500勒克斯的照明要求,這推動了對高功率燈泡的需求。目前,廣東省一家工廠正在運作一個擁有超過1萬個節點、延遲低於50毫秒的藍牙Mesh網路,展現了其擴充性。隨著企業環境、社會和治理(ESG)目標的日益嚴格,整合照明資料的能源儀錶板將成為主流。
消費者認為初始實施成本較高。
藍牙智慧燈泡的價格仍比無線LED燈泡高出150%到200%。英國和澳洲的調查顯示,儘管投資回收期預計為三年,但48%的受訪者表示初始成本是最大的障礙。在印度和巴西,每月電費不到30美元,限制了節能效果,並將投資回收期延長至五年以上。在老房住宅,重新佈線通常需要進行電氣工程,每個房間增加75到150美元的費用,這使得自行安裝的吸引力降低。除非零件價格進一步下降或補貼計劃擴大,否則價格敏感度可能會減緩短期成長。
細分市場分析
雖然住宅領域佔據最大的市場佔有率,達到 47.70%,但工業領域預計將以 11.68% 的複合年成長率成長,在藍牙 LED 燈泡市場中超越其他所有領域。德國和韓國的汽車組裝廠目前正在透過在製程切換期間調整高功率照明設備的亮度,將能耗降低高達 30%。商業設施的下照燈維修也持續進行,以實現基於人員佔用情況的照明控制,並保持著個位數的成長率。由於捆綁式套餐簡化了初始購買流程,住宅領域的應用仍然十分顯著。
在工廠中,藍牙Mesh技術備受青睞,因為即使在節點數量高達10,000個的網路中,直接轉送也能確保回應時間小於100毫秒。預測性維護警報可在燈具故障導致生產中斷之前送達工廠主管。酒店和零售商店正利用照明進行導航和氛圍營造,從而創造出超越簡單照明之外的商機。
預計到2025年,相容於愛迪生螺口和卡口插座的標準A19/A60型號藍牙LED燈泡將佔據38.20%的市場。同時,反射式BR/PAR燈泡正以12.35%的複合年成長率推動市場成長,因為商業客戶需要可調光白光照明以提高顯示精度。飯店等場所則在夜間使用2700K色溫,白天使用5000K色溫,提升賓客舒適度。
裝飾燈絲不僅滿足美感偏好,現在也具備RGB尋址功能。在一些注重纖薄外型而非流明輸出的小眾展示櫃中,會使用特殊的燈管。整體這些類型的燈管都內建了驅動器,有助於減輕重量並改善散熱。
區域分析
預計到2025年,亞太地區將佔全球銷售額的37.90%,複合年成長率(CAGR)為12.28%。同年,中國生產了42億個LED燈泡,其中18%具備藍牙功能。小米、Yeelight和歐普爾佔據了國內市場60%的佔有率。在印度,由「UJALA」計畫推廣的照明基礎設施正在向智慧照明轉型;在澳大利亞,電力公司透過引入分時電價,將投資回收期縮短至不到18個月。
預計到2025年,北美將佔全球銷售額的約28.10%。美國強制規定燈泡光通量效率必須達到45流明/瓦,並將白熾燈泡從商店上移除,從而提振了藍牙LED燈泡的需求。加拿大的補貼計畫與美國的獎勵類似,而墨西哥的住宅熱潮則推動了對售價低於8美元的中國進口燈泡的需求。
預計到2025年,歐洲將佔全球銷售額的約23.80%。生態設計指令已於2024年9月禁止使用鹵素燈泡,目前正逐步過渡到符合45流明/瓦和25000小時使用壽命目標的替代產品。莫斯科和聖彼得堡的辦公園區正在採用網狀照明系統,以符合ISO 50001標準;波灣合作理事會(GCC)成員國的城市則正在指定配備藍牙功能的路燈,用於預測性維護。在撒哈拉以南非洲地區,太陽能智慧燈泡正在滿足計畫停電和離網環境的照明需求。
其他好處:
- Excel格式的市場預測(ME)表
- 3個月的分析師支持
目錄
第1章:引言
- 研究假設和市場定義
- 調查範圍
第2章:調查方法
第3章執行摘要
第4章 市場狀況
- 市場概覽
- 市場促進因素
- 智慧家庭對節能照明的需求日益成長
- 物聯網和智慧建築基礎設施的普及
- LED和感測器組件價格下降
- 政府鼓勵節能的獎勵
- 藍牙Mesh 1.1的出現使得大規模照明網路成為可能。
- 隨著零售商將智慧燈泡與語音助理設備捆綁銷售,智慧燈泡的普及速度正在加快。
- 市場限制因素
- 消費者認為初始實施成本較高。
- 照明生態系互通性面臨的挑戰
- 高密度都市區多設備環境下的藍牙頻寬壅塞
- 藍牙低功耗設備網路安全認證成本不斷上漲
- 宏觀經濟因素的影響
- 產業價值鏈分析
- 技術展望
- 監理情勢
- 波特五力分析
第5章 市場規模與成長預測
- 最終用戶
- 產業
- 商業
- 住宅
- 依燈泡類型
- 標準A19/A60
- 反射器(BR/PAR)
- 蠟燭形狀的裝飾性
- 其他
- 按瓦數
- 小於9瓦
- 9 W~14 W
- 14瓦或以上
- 透過連接協議
- Bluetooth Classic
- Bluetooth Low Energy(BLE)
- Bluetooth Mesh
- 透過分銷管道
- 線上零售
- 線下零售
- 專業/OEM安裝人員
- 按地區
- 北美洲
- 美國
- 加拿大
- 墨西哥
- 南美洲
- 巴西
- 阿根廷
- 其他南美國家
- 歐洲
- 德國
- 英國
- 法國
- 義大利
- 西班牙
- 俄羅斯
- 其他歐洲國家
- 亞太地區
- 中國
- 日本
- 印度
- 韓國
- 澳洲
- 其他亞太國家
- 中東和非洲
- 中東
- 沙烏地阿拉伯
- 阿拉伯聯合大公國
- 土耳其
- 其他中東國家
- 非洲
- 南非
- 奈及利亞
- 埃及
- 其他非洲國家
- 中東
- 北美洲
第6章 競爭情勢
- 市場集中度
- 策略趨勢
- 市佔率分析
- 公司簡介
- Signify NV
- Acuity Brands Inc.
- Savant Systems Inc.(GE Lighting)
- Osram GmbH
- Sengled Optoelectronics Co., Ltd.
- Buddy Technologies Ltd.(LIFX Lighting)
- Nanoleaf Canada Ltd.
- Wyze Labs, Inc.
- IKEA Systems BV
- Xiaomi Corporation
- TP-Link Technologies Co., Ltd.
- Cree Lighting, a company of IDEAL INDUSTRIES, Inc.
- Yeelight Technology Co., Ltd.
- Opple Lighting Co., Ltd.
- Luceco plc
- Hubbell Incorporated
- Zumtobel Group AG
- Delta Light NV
- Eaton Corporation plc
- Ilumi Solutions Inc.
第7章 市場機會與未來展望
According to Mordor Intelligence, the bluetooth lED bulb market size was valued at USD 2.13 billion in 2025 and estimated to grow from USD 2.36 billion in 2026 to reach USD 3.92 billion by 2031, at a CAGR of 10.69% during the forecast period (2026-2031).
This report is Segmented by End-User (Industrial, Commercial, and Residential), Bulb Type (Standard A19/A60, Reflector BR/PAR, Candle and Decorative, and More), Wattage (Below 9W, 9W-14W, and More), Connectivity Protocol (Bluetooth Classic, Bluetooth Low Energy, and More), Distribution Channel (Online Retail, Offline Retail, and More), and Geography. Market Forecasts are Provided in Terms of Value (USD).
Global Bluetooth LED Bulb Market Trends and Insights
Increasing Demand for Energy-Efficient Lighting in Smart Homes
Voice-assistant ecosystems and utility rebates have doubled the number of connected luminaires per household, even as lighting's share of residential electricity fell below 8% in 2024. Europe's Ecodesign Directive banned halogen and linear fluorescent lamps, triggering a replacement wave that favors Bluetooth-enabled LEDs, which offer dimming and tunable white light without requiring neutral-wire rewiring. Germany and France, both posting renovation rates above 3%, now embed smart-ready panels in new wiring layouts. In the United States, rebates of USD 15-25 per connected bulb cut payback to under 12 months. Collectively, these measures secure residential leadership in the Bluetooth LED bulb market.
Proliferation of IoT and Smart Building Infrastructure
Developers view Bluetooth Mesh lighting as foundational infrastructure because luminaires double as distributed sensor platforms. The International Energy Agency measured savings of 18%-22% when occupancy data guided HVAC scheduling in retrofitted office towers. Factory ceilings above six meters require bulbs with outputs exceeding 14 W to meet 500-lux requirements, spurring demand for high-output models. Guangdong plants now operate Bluetooth Mesh networks with over 10,000 nodes and sub-50 ms latency, underscoring their scalability. As corporate ESG targets tighten, energy dashboards integrating lighting data will become mainstream.
High Initial Installation Cost Perceived by Consumers
Bluetooth bulbs still carry a 150%-200% premium over non-connected LEDs. Surveys in the United Kingdom and Australia revealed that 48% of respondents identified upfront costs as the primary obstacle, despite three-year payback scenarios. In India and Brazil, monthly electricity bills under the USD 30 limit the savings potential, extending the payback period beyond five years. Older homes often require an electrician's labor for wiring adjustments, which can add USD 75-150 per room, making the do-it-yourself proposition less appealing. Until component prices fall further or rebates expand, price sensitivity will blunt near-term growth.
Other drivers and restraints analyzed in the detailed report include:
- Declining LED and Sensor Component Prices
- Emergence of Bluetooth Mesh 1.1 Enabling Large-Scale Lighting Networks
- Interoperability Issues Across Lighting Ecosystems
For complete list of drivers and restraints, kindly check the Table Of Contents.
Segment Analysis
The Residential segment secures the largest market share of 47.70%, while the industrial segment is projected to expand at a 11.68% CAGR, outpacing all other verticals in the Bluetooth LED bulb market. Automotive assembly plants in Germany and South Korea now dim high-wattage fixtures during changeovers, trimming electricity use by up to 30%. Commercial settings continue to retrofit downlights for occupancy-based control, achieving single-digit growth. Residential adoption remains sizable thanks to bundled deals that simplify first-time purchases.
Factories favor Bluetooth Mesh because directed forwarding guarantees sub-100 ms response even across 10,000-node networks. Predictive-maintenance alerts reach plant supervisors before lamp failure disrupts production. Hotels and retailers deploy lighting for way-finding and mood scenes, adding revenue opportunities beyond pure illumination.
Standard A19/A60 models secured 38.20% share of Bluetooth LED bulb market in 2025, owing to their fit in Edison screw and bayonet sockets. Reflector BR/PAR bulbs, however, lead growth with a 12.35% CAGR as commercial clients pursue tunable-white for display accuracy. Hospitality venues shift between 2,700 K evenings and 5,000 K daytime profiles to influence guest comfort.
Decorative filament styles satisfy aesthetic preferences yet now incorporate RGB addressability. Specialty tubes occupy niche display cases where slim form factors outweigh lumen output. Across these types, integrated drivers trim weight and improve heat dissipation.
Complete Report Scope:
- By End-User
- Industrial
- Commercial
- Residential
- By Bulb Type
- Standard A19 / A60
- Reflector (BR / PAR)
- Candle and Decorative
- Others
- By Wattage
- Below 9 W
- 9 W - 14 W
- Above 14 W
- By Connectivity Protocol
- Bluetooth Classic
- Bluetooth Low Energy (BLE)
- Bluetooth Mesh
- By Distribution Channel
- Online Retail
- Offline Retail
- Professional / OEM Installers
- By Geography
- North America
- United States
- Canada
- Mexico
- South America
- Brazil
- Argentina
- Rest of South America
- Europe
- Germany
- United Kingdom
- France
- Italy
- Spain
- Russia
- Rest of Europe
- Asia Pacific
- China
- Japan
- India
- South Korea
- Australia
- Rest of Asia Pacific
- Middle East and Africa
- Middle East
- Saudi Arabia
- United Arab Emirates
- Turkey
- Rest of Middle East
- Africa
- South Africa
- Nigeria
- Egypt
- Rest of Africa
- Middle East
- North America
Geography Analysis
Asia Pacific generated 37.90% of 2025 revenue and is heading for a 12.28% CAGR. China produced 4.2 billion LED bulbs that year, 18% of which were Bluetooth-enabled, with Xiaomi, Yeelight, and Opple holding 60% domestic share. India's UJALA-driven lamp base is now ripe for smart upgrades, and utilities in Australia shorten payback to under 18 months via time-of-use tariffs.
North America accounted for approximately 28.10% of 2025 revenue. The United States mandated 45 lm/W efficacy, removing incandescent lamps from store shelves and thereby boosting demand for Bluetooth LED bulbs. Canadian rebates mirror U.S. incentives, while Mexico's new housing boom fuels demand for sub-USD 8 bulbs imported from China.
Europe accounted for approximately 23.80% of 2025 sales. The Ecodesign Directive banned halogen capsules in September 2024, prompting replacements that meet 45 lm/W and 25,000-hour life targets. Office parks in Moscow and Saint Petersburg utilize mesh lighting for ISO 50001 compliance, while cities in the Gulf Cooperation Council specify Bluetooth-enabled streetlights for predictive maintenance. In Sub-Saharan Africa, solar-powered smart bulbs address load-shedding and off-grid needs.
- Signify N.V.
- Acuity Brands Inc.
- Savant Systems Inc. (GE Lighting)
- Osram GmbH
- Sengled Optoelectronics Co., Ltd.
- Buddy Technologies Ltd. (LIFX Lighting)
- Nanoleaf Canada Ltd.
- Wyze Labs, Inc.
- IKEA Systems B.V.
- Xiaomi Corporation
- TP-Link Technologies Co., Ltd.
- Cree Lighting, a company of IDEAL INDUSTRIES, Inc.
- Yeelight Technology Co., Ltd.
- Opple Lighting Co., Ltd.
- Luceco plc
- Hubbell Incorporated
- Zumtobel Group AG
- Delta Light N.V.
- Eaton Corporation plc
- Ilumi Solutions Inc.
Additional Benefits:
- The market estimate (ME) sheet in Excel format
- 3 months of analyst support
TABLE OF CONTENTS
1 INTRODUCTION
- 1.1 Study Assumptions and Market Definition
- 1.2 Scope of the Study
2 RESEARCH METHODOLOGY
3 EXECUTIVE SUMMARY
4 MARKET LANDSCAPE
- 4.1 Market Overview
- 4.2 Market Drivers
- 4.2.1 Increasing Demand for Energy-Efficient Lighting in Smart Homes
- 4.2.2 Proliferation of IoT and Smart Building Infrastructure
- 4.2.3 Declining LED and Sensor Component Prices
- 4.2.4 Government Incentives for Energy Conservation
- 4.2.5 Emergence of Bluetooth Mesh 1.1 Enabling Large-Scale Lighting Networks
- 4.2.6 Retailers Bundling Connected Bulbs with Voice Assistant Devices Boosting Uptake
- 4.3 Market Restraints
- 4.3.1 High Initial Installation Cost Perceived by Consumers
- 4.3.2 Interoperability Issues Across Lighting Ecosystems
- 4.3.3 Bluetooth Bandwidth Congestion in Dense Urban Multi-Device Environments
- 4.3.4 Rising Cybersecurity Certification Costs for Bluetooth Low Energy Devices
- 4.4 Impact of Macroeconomic Factors
- 4.5 Industry Value Chain Analysis
- 4.6 Technological Outlook
- 4.7 Regulatory Landscape
- 4.8 Porter's Five Forces Analysis
- 4.8.1 Bargaining Power of Buyers / Consumers
- 4.8.2 Bargaining Power of Suppliers
- 4.8.3 Threat of New Entrants
- 4.8.4 Threat of Substitute Products
- 4.8.5 Intensity of Competitive Rivalry
5 MARKET SIZE AND GROWTH FORECASTS
- 5.1 By End-User
- 5.1.1 Industrial
- 5.1.2 Commercial
- 5.1.3 Residential
- 5.2 By Bulb Type
- 5.2.1 Standard A19 / A60
- 5.2.2 Reflector (BR / PAR)
- 5.2.3 Candle and Decorative
- 5.2.4 Others
- 5.3 By Wattage
- 5.3.1 Below 9 W
- 5.3.2 9 W - 14 W
- 5.3.3 Above 14 W
- 5.4 By Connectivity Protocol
- 5.4.1 Bluetooth Classic
- 5.4.2 Bluetooth Low Energy (BLE)
- 5.4.3 Bluetooth Mesh
- 5.5 By Distribution Channel
- 5.5.1 Online Retail
- 5.5.2 Offline Retail
- 5.5.3 Professional / OEM Installers
- 5.6 By Geography
- 5.6.1 North America
- 5.6.1.1 United States
- 5.6.1.2 Canada
- 5.6.1.3 Mexico
- 5.6.2 South America
- 5.6.2.1 Brazil
- 5.6.2.2 Argentina
- 5.6.2.3 Rest of South America
- 5.6.3 Europe
- 5.6.3.1 Germany
- 5.6.3.2 United Kingdom
- 5.6.3.3 France
- 5.6.3.4 Italy
- 5.6.3.5 Spain
- 5.6.3.6 Russia
- 5.6.3.7 Rest of Europe
- 5.6.4 Asia Pacific
- 5.6.4.1 China
- 5.6.4.2 Japan
- 5.6.4.3 India
- 5.6.4.4 South Korea
- 5.6.4.5 Australia
- 5.6.4.6 Rest of Asia Pacific
- 5.6.5 Middle East and Africa
- 5.6.5.1 Middle East
- 5.6.5.1.1 Saudi Arabia
- 5.6.5.1.2 United Arab Emirates
- 5.6.5.1.3 Turkey
- 5.6.5.1.4 Rest of Middle East
- 5.6.5.2 Africa
- 5.6.5.2.1 South Africa
- 5.6.5.2.2 Nigeria
- 5.6.5.2.3 Egypt
- 5.6.5.2.4 Rest of Africa
- 5.6.5.1 Middle East
- 5.6.1 North America
6 COMPETITIVE LANDSCAPE
- 6.1 Market Concentration
- 6.2 Strategic Moves
- 6.3 Market Share Analysis
- 6.4 Company Profiles (includes Global level Overview, Market level overview, Core Segments, Financials as available, Strategic Information, Market Rank / Share for key companies, Products and Services, and Recent Developments)
- 6.4.1 Signify N.V.
- 6.4.2 Acuity Brands Inc.
- 6.4.3 Savant Systems Inc. (GE Lighting)
- 6.4.4 Osram GmbH
- 6.4.5 Sengled Optoelectronics Co., Ltd.
- 6.4.6 Buddy Technologies Ltd. (LIFX Lighting)
- 6.4.7 Nanoleaf Canada Ltd.
- 6.4.8 Wyze Labs, Inc.
- 6.4.9 IKEA Systems B.V.
- 6.4.10 Xiaomi Corporation
- 6.4.11 TP-Link Technologies Co., Ltd.
- 6.4.12 Cree Lighting, a company of IDEAL INDUSTRIES, Inc.
- 6.4.13 Yeelight Technology Co., Ltd.
- 6.4.14 Opple Lighting Co., Ltd.
- 6.4.15 Luceco plc
- 6.4.16 Hubbell Incorporated
- 6.4.17 Zumtobel Group AG
- 6.4.18 Delta Light N.V.
- 6.4.19 Eaton Corporation plc
- 6.4.20 Ilumi Solutions Inc.
7 MARKET OPPORTUNITIES AND FUTURE OUTLOOK
- 7.1 White-space and Unmet-Need Assessment

 藍牙LED燈泡市場規模、佔有率和成長分析:按類型、色溫、連接方式、最終用戶、通路和地區分類-2026-2033年產業預測
 LED燈泡市場報告:按應用和地區分類(2026-2034)
 住宅藍牙LED燈泡市場-全球產業規模、佔有率、趨勢、機會、預測:按支援的設備類型、地區和競爭格局分類,2021-2031年
 藍牙LED燈泡市場:依產品類型、連接類型、應用和銷售管道-2026-2032年全球預測LED燈絲燈泡市場:按燈座類型、功率範圍、色溫、燈泡形狀、表面處理類型、應用和配銷通路分類,全球預測,2026-2032年
 全球LED改裝市場規模、佔有率、趨勢和成長分析報告(2026-2034年)日本LED燈泡市場規模、佔有率、趨勢和預測:按應用和地區分類,2026-2034年藍牙LED燈泡市場-全球產業規模、佔有率、趨勢、機會與預測:按相容設備類型、最終用戶、地區和競爭對手分類,2021-2031年
 燈絲LED燈泡:全球市佔率排名、總銷售量及需求預測(2025-2031年)藍牙LED燈泡市場-2025年至2030年的預測