


 |
市場調查報告書
商品編碼
2113494
銀行、金融服務和保險 (BFSI) 安全:市場佔有率分析、行業趨勢和統計數據、成長預測(2026-2031 年)BFSI Security - Market Share Analysis, Industry Trends & Statistics, Growth Forecasts (2026 - 2031) |
||||||

※ 本網頁內容可能與最新版本有所差異。詳細情況請與我們聯繫。
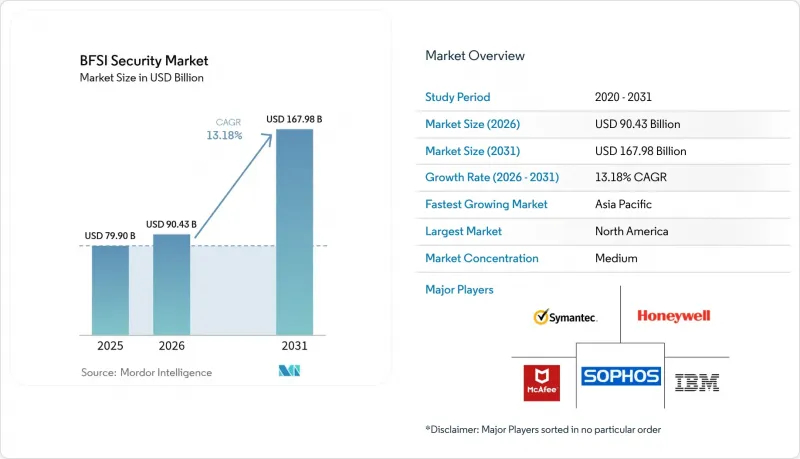
據 Mordor Intelligence 稱,2025 年 BFSI 安全市場價值為 799 億美元,預計到 2031 年將達到 1679.8 億美元,而 2026 年為 904.3 億美元,預測期(2026-2031 年)的複合年成長率為 13.18%。
本報告按安全類型(資訊安全、實體安全)、服務類型(系統整合、維護、支援)、部署模式(本地部署、雲端部署)、產業(銀行、保險等)和地區進行細分。市場預測以美元計價。
全球銀行、金融服務和保險 (BFSI) 安全市場趨勢與洞察
數位銀行交易激增
電子支付正持續取代支票,交易量激增,傳統詐欺偵測系統已無法即時分析。新加坡金融管理局已將2025年中期定為全國推廣電子延期支付的目標日期,而印度則要求銀行實施基於人工智慧的行為分析以進行詐欺檢測。這些監管措施正在加速對雲端原生交易監控和低延遲核心銀行API的投資。隨著銀行、金融服務和保險(BFSI)安全市場的擴張,能夠在不影響性能的前提下以毫秒速度檢查有效載荷的供應商正在獲得先發優勢。金融機構也正在重新思考其身分驗證流程,以支援基於風險的高價值轉帳分層身分驗證,這進一步加速了平台全面改造的進程。
網路攻擊手段日益複雜
LockBit 對 Evolve Bank and Trust 的攻擊揭露了一種結合加密和資料竊取的雙重威脅模型。同時,Minja 的記憶體注入攻擊在實驗室測試中對 AI 聊天機器人取得了 95% 的成功率。攻擊者現在利用大規模語言模型在幾秒鐘內最佳化釣魚腳本,使得基於特徵碼的防禦措施失效。因此,金融機構正在優先考慮行為分析、攻擊者模擬和自動化回應編配。作為應對措施,BFSI(銀行、金融、保險和證券)安全市場正在將增強型偵測和回應 (XDR) 與增強型威脅情報相結合,使分析師能夠在幾分鐘內(而不是幾小時)識別出新的攻擊策略。此外,量子解密技術的概念驗證即將完成,這促使董事會撥出初始預算用於實施抗量子密碼技術。
總擁有成本 (TCO) 高
在全球範圍內,由於經濟逆風和投資回報率的不確定性導致支出停滯,網路安全專案預算的成長率從2021年的16%放緩至2024年的8%。中型金融機構將13.2%的IT支出用於安全,但仍表示準備不足,這反映出數十種功能重疊的工具造成的零碎化問題。工具的激增阻礙了新的投資,並透過增加許可成本、整合成本和安全營運中心(SOC)人事費用(BFSI)安全市場。雖然能夠自動進行故障分類和事件回應的整合平台可以將每個警報的成本降低40%,但遷移預算通常會在一年內超過節省的成本,從而導致投資回收期延長和採購核准延遲。
細分市場分析
到2025年,資訊安全將佔銀行、金融服務和保險(BFSI)產業安全市場佔有率的70.55%,隨著客戶互動轉向數位化管道,其重要性將遠遠超過實體控制。市場需求主要集中在符合DORA規範性測試要求的預防資料外泄(DLP)、端點偵測與回應(EDR)以及身分管治平台。在強制實施以威脅為中心的穿透測試以及人工智慧在資訊安全分析中的應用推動下,預計到2031年,BFSI產業資訊安全市場規模將以16.15%的複合年成長率成長。
儘管如此,實體安全防護和邏輯安全防護的融合正在推進。分店和資料中心營運商正在將生物識別存取日誌與安全資訊和事件管理 (SIEM) 控制面板整合,以實現統一的風險評分。零信任藍圖對門禁讀卡機和 API 閘道一視同仁,要求在授權前進行持續檢驗。因此,提供可互通憑證管理庫的供應商正在銀行、金融服務和保險 (BFSI) 安全市場中佔據越來越大的市場佔有率。金融機構也在試行欺騙網格和自主威脅遏制系統,以將平均回應時間縮短至低於監管機構規定的 24 小時揭露要求。
隨著銀行業努力應對架構不統一和監管期限的限制,系統整合專家在2025年的收入佔比將達到40.05%。隨著DORA和NYDFS不斷提出新的要求,跨異質技術堆疊映射控制庫、API介面和審計工作流程的需求日益成長,這鞏固了整合服務在銀行、金融服務和保險(BFSI)安全市場的核心地位。託管安全服務緊隨其後,預計將以18.55%的複合年成長率成長,因為小規模金融機構面臨著無法自行應對的全天候監控義務的挑戰。
在金融服務網路安全產業,基於結果的合約越來越受到青睞,而基於時間和材料的成本合約則逐漸被淘汰。思科的 HyperShield 將自主分段與專業服務結合,以確保漏洞修復的及時性。為此,中型銀行透過將警報分類外包給專業的安全營運中心 (SOC),將事件停留時間縮短了高達 60%。生態系統合作夥伴正在整合符合審計報告格式的合規性儀表板,這進一步強化了整合服務在銀行、金融服務和保險 (BFSI) 安全市場商業化過程中的關鍵作用。
區域分析
預計到2025年,北美將佔全球收入的36.10%,這得益於紐約州金融服務部(NYDFS)第500部分和網路安全與基礎設施安全局(CISA)針對特定行業的指令的早期實施,以及成熟的資料外洩通知系統(該系統可在數日內對違規處以罰款)。一級銀行之間的競爭壓力推動了多年來的平台現代化進程,其影響如今正蔓延至區域性金融機構和金融科技公司,鞏固了該地區在銀行、金融服務和保險(BFSI)安全市場的主導地位。
亞太地區正以14.72%的複合年成長率快速成長,這主要得益於新加坡的「共同責任框架」和印度強制性的人工智慧詐欺監控。預計到2026年,亞太地區銀行、金融服務和保險(BFSI)安全市場規模將超過264億美元,因為針對該地區的網路安全事件佔全球網路安全事件的31%。亞太地區銀行正在監管沙盒機制下加速採用雲端運算,而日本和澳洲則在推進抗量子攻擊的試點項目,進一步拉大了亞太地區與成熟市場之間的成長差距。
歐洲透過DORA、GDPR和NIS 2指令發揮舉足輕重的影響力。對統一監管機構的期望正在推動跨境平台的整合,從而催生了泛歐託管安全營運中心(SOC)的出現。在歐洲銀行、金融服務和保險(BFSI)安全市場,對供應商方供應鏈韌性證據的需求日益成長,包括持續的第三方風險評估和區域密鑰存儲,預計未來十年這一支出勢頭將保持強勁。
其他好處:
- Excel格式的市場預測(ME)表
- 3個月的分析師支持
目錄
第1章:引言
- 研究假設和市場定義
- 調查範圍
第2章:調查方法
第3章執行摘要
第4章 市場狀況
- 市場概覽
- 市場促進因素
- 數位銀行交易激增
- 網路攻擊正變得越來越複雜。
- 嚴格的資料保護條例
- 核心銀行平台雲端遷移
- 引入人工智慧驅動的詐欺預防措施
- 開放銀行API正在擴大攻擊面。
- 市場限制因素
- 總擁有成本高
- 整合舊有系統的複雜性
- 網路安全人員短缺
- 跨國資料儲存位置不明確
- 監理情勢
- 技術展望
- 波特五力分析
- 投資分析
第5章 市場規模與成長預測
- 按安全類型
- 資訊安全
- 實體安全
- 按服務類型
- 系統整合
- 維護
- 支援
- 按部署模式
- 現場
- 基於雲端的
- 按行業
- 銀行業
- 保險
- 其他金融機構
- 按地區
- 北美洲
- 美國
- 加拿大
- 墨西哥
- 南美洲
- 巴西
- 阿根廷
- 其他南美國家
- 歐洲
- 德國
- 英國
- 法國
- 西班牙
- 義大利
- 其他歐洲國家
- 亞太地區
- 中國
- 日本
- 韓國
- 印度
- 澳洲和紐西蘭
- 其他亞太國家
- 中東
- 以色列
- 沙烏地阿拉伯
- 阿拉伯聯合大公國
- 土耳其
- 其他中東國家
- 非洲
- 南非
- 埃及
- 奈及利亞
- 其他非洲國家
- 北美洲
第6章 競爭情勢
- 市場集中度
- 策略趨勢
- 市佔率分析
- 公司簡介
- International Business Machines Corporation
- Cisco Systems, Inc.
- Symantec
- Sophos Group plc
- McAfee LLC
- Honeywell International Inc.
- Dell Technologies Inc.(EMC)
- DXC Technology Company
- Trend Micro Incorporated
- Booz Allen Hamilton Holding Corporation
- Palo Alto Networks, Inc.
- Fortinet, Inc.
- Check Point Software Technologies Ltd.
- Mandiant Corporation(Orange Cyberdefense)
- Okta, Inc.
- Darktrace plc
- Rapid7, Inc.
- Proofpoint, Inc.
- Splunk Inc.
- Imperva, Inc.
第7章 市場機會與未來展望
According to Mordor Intelligence, the BFSI security market size was valued at USD 79.9 billion in 2025 and estimated to grow from USD 90.43 billion in 2026 to reach USD 167.98 billion by 2031, at a CAGR of 13.18% during the forecast period (2026-2031).
This report is Segmented by Security Type (Information Security, Physical Security), Services Type (System Integration, Maintenance, Support), Deployment Model (On-Premises, Cloud-Based), Vertical (Banking, Insurance and More), and Geography. The Market Forecasts are Provided in Terms of Value (USD).
Global BFSI Security Market Trends and Insights
Surge in Digital Banking Transactions
Electronic payments continue to cannibalize cheques, driving volumes that legacy fraud-detection stacks cannot analyze in real time. Singapore's Monetary Authority has set mid-2025 for nationwide Electronic Deferred Payment roll-out, while India now obliges banks to deploy AI-powered behavioural analytics for fraud spotting. These mandates are funnelling spending toward cloud-native transaction monitoring and low-latency core-banking APIs. As the BFSI security market broadens, vendors that can inspect payloads at millisecond speed without performance drag secure a first-mover advantage. Institutions are also overhauling authentication flows to support risk-based step-up verification for high-value transfers, further accelerating platform rip-and-replace activity.
Escalating Sophistication of Cyber-Attacks
The LockBit assault on Evolve Bank and Trust laid bare the dual-threat model of encryption plus data theft, while the Minja memory injection exploit reached a 95% success rate against AI chatbots in lab tests. Attackers now weaponize large language models to refine phishing scripts in seconds, leaving signature-based controls obsolete. Financial firms therefore prioritize behavioural analytics, adversary emulation and automated response orchestration. The BFSI security market responds by bundling extended detection and response (XDR) with threat-intelligence enrichment so analysts can triage novel tactics in minutes rather than hours. Proof-of-concept quantum decryption techniques also loom, nudging boards to allocate seed budgets for quantum-resistant encryption roll-outs.
High Total Cost of Ownership
Globally, budget growth for cyber programs decelerated to 8% in 2024, down from 16% in 2021, as economic headwinds and unclear ROI stall spending. Mid-tier institutions earmark 13.2% of IT outlays for security yet still report readiness gaps, reflecting fragmentation across dozens of overlapping tools. Tool sprawl inflates licensing, integration and SOC staffing costs, suppressing net new investment and placing a drag on the BFSI security market. Consolidated platforms that automate triage and incident response can lower per-alert costs by 40%, but migration budgets often exceed in-year savings, prolonging payback windows and delaying purchase approvals.
Other drivers and restraints analyzed in the detailed report include:
- Stringent Data-Protection Regulations
- Cloud Migration of Core-Banking Platforms
- Legacy-System Integration Complexity
For complete list of drivers and restraints, kindly check the Table Of Contents.
Segment Analysis
Information Security captured 70.55% of the BFSI security market share in 2025, far outpacing physical controls as customer engagement shifts to digital channels. Demand concentrates on data-loss prevention, endpoint detection and response, and identity governance platforms that satisfy DORA's prescriptive testing clauses. The BFSI security market size for Information Security will expand at 16.15% CAGR through 2031, powered by mandatory threat-led penetration testing and AI infusion into fraud analytics.
Convergence of physical and logical safeguards is nonetheless advancing. Branch and data-center operators integrate biometric access logs with SIEM dashboards, enabling unified risk scoring. Zero-trust blueprints treat door readers and API gateways alike, requiring continuous verification before granting privileges. Vendors that supply interoperable credential management vaults therefore secure a growing slice of the BFSI security market. Institutions also pilot deception grids and autonomous threat-containment to reduce mean-time-to-respond below the regulatory 24-hour disclosure threshold.
System-integration specialists accounted for 40.05% of 2025 revenue as banks wrestled with patch-work architectures and regulatory deadlines. Every DORA or NYDFS requirement triggers mapping of control libraries, API hooks and audit workflows into heterogeneous tech stacks, solidifying integration services' place at the center of the BFSI security market. Managed Security Services follow closely, forecast to climb 18.55% CAGR on the back of 24/7 monitoring mandates that smaller lenders cannot staff internally.
The financial services cybersecurity industry increasingly favors outcome-based contracts over time-and-materials engagements. Cisco's HyperShield release bundles autonomous segmentation with professional services, offering guaranteed vulnerability remediation windows. In response, mid-market banks outsource alert triage to specialised SOCs, cutting incident dwell times by up to 60%. Ecosystem partners embed compliance dashboards that align with auditors' report formats, reinforcing integration services' pivotal role in capitalization of the BFSI security market.
Complete Report Scope:
- By Security Type
- Information Security
- Physical Security
- By Service Type
- System Integration
- Maintenance
- Support
- By Deployment Model
- On-premises
- Cloud-based
- By Vertical
- Banking
- Insurance
- Other Financial Institutions
- By Geography
- North America
- United States
- Canada
- Mexico
- South America
- Brazil
- Argentina
- Rest of South America
- Europe
- Germany
- United Kingdom
- France
- Spain
- Italy
- Rest of Europe
- Asia-Pacific
- China
- Japan
- South Korea
- India
- Australia and New Zealand
- Rest of Asia-Pacific
- Middle East
- Israel
- Saudi Arabia
- United Arab Emirates
- Turkey
- Rest of Middle East
- Africa
- South Africa
- Egypt
- Nigeria
- Rest of Africa
- North America
Geography Analysis
North America commanded 36.10% of revenue in 2025 thanks to early adoption of NYDFS Part 500, CISA sector directives and a mature breach-notification regime that fines non-compliance within days. Competitive pressure among Tier-1 banks spurred multiyear platform refreshes that now trickle down to regional lenders and fintechs, solidifying the region's leadership in the BFSI security market.
Asia-Pacific is expanding at a 14.72% CAGR, propelled by Singapore's Shared Responsibility Framework and India's AI-based fraud monitoring mandates. The BFSI security market size for Asia-Pacific grew past USD 26.4 billion in 2026, spurred by 31% of global cyber incidents targeting the region commonwealth.int. Local banks accelerate cloud adoption under regulatory sandbox regimes, while Japan and Australia push quantum-safe pilots, further widening growth differentials versus mature markets.
Europe holds significant weight via DORA, GDPR and the NIS 2 Directive. Harmonized supervisory expectations drive cross-border platform consolidation, giving rise to pan-European managed SOC hubs. The BFSI security market in Europe increasingly demands vendor evidence of full supply-chain resilience, including continuous third-party risk scoring and in-region key custody, keeping spending momentum steady through the decade.
- International Business Machines Corporation
- Cisco Systems, Inc.
- Symantec
- Sophos Group plc
- McAfee LLC
- Honeywell International Inc.
- Dell Technologies Inc. (EMC)
- DXC Technology Company
- Trend Micro Incorporated
- Booz Allen Hamilton Holding Corporation
- Palo Alto Networks, Inc.
- Fortinet, Inc.
- Check Point Software Technologies Ltd.
- Mandiant Corporation (Orange Cyberdefense)
- Okta, Inc.
- Darktrace plc
- Rapid7, Inc.
- Proofpoint, Inc.
- Splunk Inc.
- Imperva, Inc.
Additional Benefits:
- The market estimate (ME) sheet in Excel format
- 3 months of analyst support
TABLE OF CONTENTS
1 INTRODUCTION
- 1.1 Study Assumptions and Market Definition
- 1.2 Scope of the Study
2 RESEARCH METHODOLOGY
3 EXECUTIVE SUMMARY
4 MARKET LANDSCAPE
- 4.1 Market Overview
- 4.2 Market Drivers
- 4.2.1 Surge in digital banking transactions
- 4.2.2 Escalating sophistication of cyber-attacks
- 4.2.3 Stringent data-protection regulations
- 4.2.4 Cloud migration of core-banking platforms
- 4.2.5 AI-driven fraud-prevention adoption
- 4.2.6 Open-banking APIs expanding attack surface
- 4.3 Market Restraints
- 4.3.1 High total cost of ownership
- 4.3.2 Legacy-system integration complexity
- 4.3.3 Cyber-security talent shortage
- 4.3.4 Cross-border data-residency ambiguity
- 4.4 Regulatory Landscape
- 4.5 Technological Outlook
- 4.6 Porter's Five Forces Analysis
- 4.6.1 Threat of New Entrants
- 4.6.2 Bargaining Power of Buyers
- 4.6.3 Bargaining Power of Suppliers
- 4.6.4 Threat of Substitutes
- 4.6.5 Intensity of Competitive Rivalry
- 4.7 Investment Analysis
5 MARKET SIZE AND GROWTH FORECASTS (VALUE)
- 5.1 By Security Type
- 5.1.1 Information Security
- 5.1.2 Physical Security
- 5.2 By Service Type
- 5.2.1 System Integration
- 5.2.2 Maintenance
- 5.2.3 Support
- 5.3 By Deployment Model
- 5.3.1 On-premises
- 5.3.2 Cloud-based
- 5.4 By Vertical
- 5.4.1 Banking
- 5.4.2 Insurance
- 5.4.3 Other Financial Institutions
- 5.5 By Geography
- 5.5.1 North America
- 5.5.1.1 United States
- 5.5.1.2 Canada
- 5.5.1.3 Mexico
- 5.5.2 South America
- 5.5.2.1 Brazil
- 5.5.2.2 Argentina
- 5.5.2.3 Rest of South America
- 5.5.3 Europe
- 5.5.3.1 Germany
- 5.5.3.2 United Kingdom
- 5.5.3.3 France
- 5.5.3.4 Spain
- 5.5.3.5 Italy
- 5.5.3.6 Rest of Europe
- 5.5.4 Asia-Pacific
- 5.5.4.1 China
- 5.5.4.2 Japan
- 5.5.4.3 South Korea
- 5.5.4.4 India
- 5.5.4.5 Australia and New Zealand
- 5.5.4.6 Rest of Asia-Pacific
- 5.5.5 Middle East
- 5.5.5.1 Israel
- 5.5.5.2 Saudi Arabia
- 5.5.5.3 United Arab Emirates
- 5.5.5.4 Turkey
- 5.5.5.5 Rest of Middle East
- 5.5.6 Africa
- 5.5.6.1 South Africa
- 5.5.6.2 Egypt
- 5.5.6.3 Nigeria
- 5.5.6.4 Rest of Africa
- 5.5.1 North America
6 COMPETITIVE LANDSCAPE
- 6.1 Market Concentration
- 6.2 Strategic Moves
- 6.3 Market Share Analysis
- 6.4 Company Profiles (includes Global-level Overview, Market-level Overview, Core Segments, Financials as available, Strategic Information, Market Rank/Share for key companies, Products and Services, and Recent Developments)
- 6.4.1 International Business Machines Corporation
- 6.4.2 Cisco Systems, Inc.
- 6.4.3 Symantec
- 6.4.4 Sophos Group plc
- 6.4.5 McAfee LLC
- 6.4.6 Honeywell International Inc.
- 6.4.7 Dell Technologies Inc. (EMC)
- 6.4.8 DXC Technology Company
- 6.4.9 Trend Micro Incorporated
- 6.4.10 Booz Allen Hamilton Holding Corporation
- 6.4.11 Palo Alto Networks, Inc.
- 6.4.12 Fortinet, Inc.
- 6.4.13 Check Point Software Technologies Ltd.
- 6.4.14 Mandiant Corporation (Orange Cyberdefense)
- 6.4.15 Okta, Inc.
- 6.4.16 Darktrace plc
- 6.4.17 Rapid7, Inc.
- 6.4.18 Proofpoint, Inc.
- 6.4.19 Splunk Inc.
- 6.4.20 Imperva, Inc.
7 MARKET OPPORTUNITIES AND FUTURE OUTLOOK
- 7.1 White-space and Unmet-Need Assessment

 2026-2034年全球銀行、金融服務和保險(BFSI)安全市場規模、佔有率、趨勢和成長分析報告
 銀行、金融服務和保險 (BFSI) 安全市場規模、佔有率和趨勢分析報告:按類型、企業規模、最終用途、地區和細分市場預測(2026-2033 年)
 銀行、金融服務和保險(BFSI)安全市場 - 全球市場預測(2026-2032)
 銀行、金融服務和保險 (BFSI) 安全市場規模、佔有率、趨勢和預測:按類型、實體保全服務、資訊安全服務、企業規模、最終用戶和地區分類,2026-2034 年
 2026年金融、保險和銀行業保全服務全球市場報告2026年全球IT、BFSI市場報告銀行、金融服務和保險 (BFSI) 安全市場規模、佔有率、成長和全球產業分析:按類型、應用和地區分類的洞察,2026-2034 年預測
 2026-2030年全球銀行、金融服務及保險(BFSI)證券市場
 銀行、金融服務和保險 (BFSI) 安全市場規模、佔有率和成長分析(按類型、實體安全、資訊安全、公司規模、最終用戶和地區分類)—產業預測,2026-2033 年2025年銀行、金融服務和保險(BFSI)安全全球市場報告