


 |
市場調查報告書
商品編碼
2113481
交通號誌辨識:市場佔有率分析、產業趨勢與統計、成長預測(2026-2031)Traffic Signal Recognition - Market Share Analysis, Industry Trends & Statistics, Growth Forecasts (2026 - 2031) |
||||||

※ 本網頁內容可能與最新版本有所差異。詳細情況請與我們聯繫。
根據 Mordor Intelligence 預測,交通號誌辨識市場規模將從 2025 年的 62.7 億美元成長到 2026 年的 65.1 億美元,到 2031 年將達到 78.9 億美元,2026 年至 2031 年的複合年成長率為 3.89%。
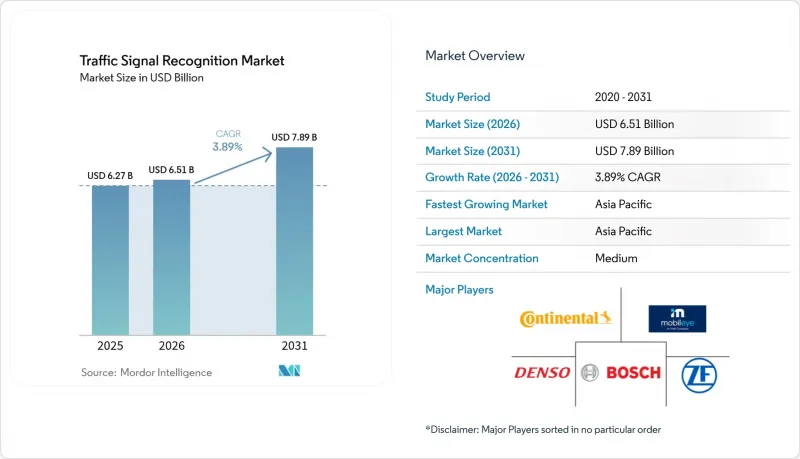
本報告按檢測方法(基於顏色的檢測、基於形狀的檢測、基於特徵的檢測)、感測器技術(攝影機系統、雷達輔助交通號誌識別(TSR)等)、車輛類型(乘用車等)、組件(硬體和軟體)、最終用戶(原始設備製造商和售後市場)以及地區進行細分。市場預測以美元計價。
全球交通號誌識別市場趨勢與洞察
由於法規要求,必須安裝ADAS系統。
具有法律約束力的法規已將交通號誌識別功能從可選配置轉變為強制性安全配置。歐盟《一般安全條例II》(General Safety Regulation II)將於2024年7月生效,該條例強制要求所有新車必須配備基於交通號誌輸入的智慧速度輔助系統。此外,美國國家公路交通安全管理局(NHTSA)關於自動緊急煞車的類似法規也增加了對感知系統的需求。為了因應未來的法規發展,汽車製造商(OEM)目前正在圍繞可擴展的感知功能設計電氣系統,這有效地保障了未來幾年交通號誌辨識市場的需求。
相機單價低於10美元。
影像感測器終於突破了成本壁壘,而此前,這一壁壘曾一度阻礙了高級駕駛輔助系統實現量產。得益於SONY的汽車CMOS技術藍圖和安森美半導體的3µm像素工藝,單價已降至10美元以下,HDR性能提升至120dB,暗電流降低至原來的1/28。成本的降低使得OEM廠商能夠在每輛車上整合八個或更多鏡頭,而更多的視角也提高了整體識別精度,即使在眩光、背光和LED閃爍等條件下也能保持良好的識別效果。
能見度差或極端天氣條件下的辨識準確率較低。
雪、霧和暴雨等惡劣天氣對攝影機而言仍然是一大挑戰,會導致性能下降,並削弱公眾的信任。諸如 Snow-CLOCs(冬季檢測準確率達 86.61%)等實驗室成果尚未轉化為實際道路上的穩定性能,因此開發人員正轉向整合雷射雷達和攝影機,或引入熱成像疊加技術。可靠性差距引起了監管機構的關注,他們要求在製定自動駕駛相關法規之前,先明確界定攝影機的性能範圍。
細分市場分析
到2025年,基於顏色的偵測將佔交通號誌辨識市場收入的45.71%,這反映了RGB閾值的長期應用。然而,基於深度學習的偵測技術預計到2031年將以4.47%的複合年成長率成長,因為卷積神經網路和變壓器網路已被證明在遮蔽和光照波動條件下具有卓越的效能。預計到2031年,基於深度學習的交通號誌辨識市場規模將呈指數級成長,這反映了原始設備製造商(OEM)希望透過軟體升級來提高識別精度。
YOLOv5 和基於注意力機制的網路目前能夠實現超過 95% 的準確率和超過 98% 的召回率,同時將推理時間控制在 45 毫秒以內,滿足即時安全要求。隨著空中下載 (OTA) 管道的成熟,汽車製造商將能夠利用極端情況下的視訊影像重新訓練模型,並在無需更換硬體的情況下提供更新。交通號誌辨識市場正持續向以人工智慧為中心的技術棧轉型,其差異化優勢在於資料管理而非電路設計。
到2025年,攝影機系統將佔交通號誌識別市場收入的62.55%。這主要得益於更低的物料清單成本以及先進軟體工具的整合,這些工具提高了系統的效率和功能。這一主導佔有率表明攝影機系統在交通號誌辨識應用中的普及率正在不斷提高。儘管成長速度有所放緩,但在持續的技術進步的推動下,預計到2031年,交通號誌辨識領域攝影機系統的市場規模仍將以較高的複合年成長率快速成長。
LiDAR和攝影機融合是成長最快的細分市場,複合年成長率達4.12%。像合賽這樣的供應商計劃將價格降低50%,預計將使固態單元進入主流規格範圍。 SparseLIF和類似框架將點雲的幾何結構與影像紋理對齊,從而創造冗餘,即使攝影機視野被眩光或雨水遮擋也能保持識別。雷達輔助方案添加了速度向量來預測相位變化,展示了多感測器融合如何改變交通號誌辨識市場。
區域分析
預計到2025年,亞太地區將以38.31%的營收佔有率引領交通號誌辨識市場,並在2031年之前維持3.98%的複合年成長率。國內法規、智慧城市試點計畫和垂直整合正在推動交通號誌識別市場的發展,該市場主要集中在中國、日本和韓國。在深圳的V2I走廊,即時訊號相位圖被用來測試車隊;而東京的感測器產業則向全球OEM廠商供應HDR成像器。區域性的高密度交通產生了多樣化的資料集,增強了深度學習的穩健性,並加速了全球檢驗週期。
歐洲也緊跟其後,並受到《通用安全法規II》的推動。大陸集團新成立的Aumovio業務部門和博世的感測器融合套件正在建立供應鏈基礎,而嚴格的網路安全法規正在塑造資料處理架構。德國和英國的保險遠端資訊處理系統檢驗的合規性給予獎勵,從而推動了消費者對交通號誌識別市場的需求。
在北美,聯邦安全法規和創業投資支持的自動駕駛試點計畫正在推動自動駕駛技術的發展。加州對極端案例的法律審查迫使供應商提供故障安全性能的證明文件,而加拿大的冬季氣候則為惡劣天氣條件的測試提供了天然的試驗場。這些因素共同維持著一個既多元又相互關聯的區域結構,一個地區的進展透過全球分散的原始設備製造商(OEM)計畫迅速傳播到其他地區。
其他好處:
- Excel格式的市場預測(ME)表
- 3個月的分析師支持
目錄
第1章:引言
- 研究假設和市場定義
- 調查範圍
第2章:調查方法
第3章執行摘要
第4章 市場狀況
- 市場概覽
- 市場促進因素
- 根據法規要求安裝ADAS系統
- 相機價格已降至每台10美元以下。
- 2級以上自動駕駛技術的廣泛應用。
- 使用V2I更新動態指標信息
- 建構高清地圖數位孿生
- 保險遠距資訊處理:提高TSR準確性的益處
- 市場限制因素
- 在能見度低和極端天氣條件下識別性能差。
- 國家/地區特定資料檢驗成本
- 誤導性標牌的網路責任
- OEM廠商的預算分配正在轉向優先考慮相互競爭的感測器。
- 價值供應鏈分析
- 監理情勢
- 技術展望
- 波特五力模型
第5章 市場規模與成長預測
- 檢測方法
- 基於顏色的檢測
- 基於形狀的檢測
- 特徵/使用深度學習進行檢測
- 感測器技術
- 網路攝影系統
- 雷達輔助TSR
- LiDAR與相機的融合
- 多模態
- 車輛類型
- 搭乘用車
- 輕型商用車
- 中型和大型商用車輛
- 巴士和長途汽車
- 按組件
- 硬體
- 軟體
- 最終用戶
- OEM設備
- 改裝
- 地區
- 北美洲
- 美國
- 加拿大
- 其他北美國家
- 南美洲
- 巴西
- 阿根廷
- 其他南美國家
- 歐洲
- 德國
- 英國
- 法國
- 西班牙
- 義大利
- 其他歐洲國家
- 亞太地區
- 中國
- 日本
- 韓國
- 印度
- 其他亞太國家
- 中東和非洲
- 沙烏地阿拉伯
- 阿拉伯聯合大公國
- 埃及
- 南非
- 其他中東和非洲國家
- 北美洲
第6章 競爭情勢
- 市場集中度
- 策略趨勢
- 市佔率分析
- 公司簡介
- Continental AG
- Robert Bosch GmbH
- DENSO Corporation
- Mobileye(Intel)
- ZF Friedrichshafen AG
- HELLA(FORVIA)
- Aptiv PLC
- Valeo SA
- Magna International Inc.
- Panasonic Holdings
- Hyundai Mobis
- Hitachi Astemo
- Veoneer/S-SW
- Ford Motor Company
- General Motors Company
- Tesla Inc.
- NVIDIA Corporation
第7章 市場機會與未來展望
According to Mordor Intelligence, the traffic signal recognition market size is expected to grow from USD 6.27 billion in 2025 to USD 6.51 billion in 2026 and is forecast to reach USD 7.89 billion by 2031 at 3.89% CAGR over 2026-2031.
This report is Segmented by Detection Method (Color-Based Detection, Shape-Based Detection, and Feature-Based Detection), Sensor Technology (Camera Systems, Radar-Assisted TSR, and More), Vehicle Type (Passenger Cars and More), Component (Hardware and Software), End-User (OEM and Aftermarket), and Geography. The Market Forecasts are Provided in Terms of Value (USD).
Global Traffic Signal Recognition Market Trends and Insights
Regulation-Mandated ADAS Inclusion
Binding rules have turned traffic light detection from an optional extra into a required safety feature. The European Union's General Safety Regulation II, effective July 2024, obliges every new model to include intelligent speed assistance underpinned by traffic-signal inputs, while a parallel NHTSA rule on automatic emergency braking heightens demand for perception suites. OEMs now architect their electrical systems around scalable perception capacity that anticipates future rule-making, effectively locking in multi-year demand for the traffic signal recognition market.
Camera Cost Curve Drops Below USD 10/Unit
Imaging sensors finally cleared the cost hurdle that once kept advanced vision off mass-market vehicles. Sony's automotive CMOS roadmap and onsemi's 3 µm pixel process have driven unit prices beneath USD 10 while boosting HDR to 120 dB and cutting dark current by 28 times. Low prices let OEMs deploy eight or more cameras per vehicle, multiplying viewpoints that collectively raise recognition precision across glare, back-light, and LED-flicker scenarios.
Poor Recognition in Low-Visibility and Weather Eextremes
Snow, fog, and heavy rain still challenge cameras, creating service drops that undermine public trust. Laboratory gains such as Snow-CLOCs (86.61% detection accuracy in winter) have yet to translate into uniform street performance, pushing developers toward LiDAR-camera fusion and thermal overlays. Reliability gaps weigh on regulators who demand clearly defined performance envelopes before advancing hands-free legislation.
Other drivers and restraints analyzed in the detailed report include:
- Level-2 Plus Autonomy Proliferation
- V2I-Enabled Dynamic Sign Updates
- Country-Specific Dataset Validation Costs
For complete list of drivers and restraints, kindly check the Table Of Contents.
Segment Analysis
Color-based Detection held 45.71% of the traffic signal recognition market revenue in 2025, a testament to its long-standing use of RGB thresholds. Yet Deep-Learning Detection is rising at 4.47% CAGR to 2031 as convolutional and transformer networks prove superior under occlusion and variable lighting. The traffic signal recognition market size for Deep-Learning Detection is projected to grow exponentially by 2031, reflecting OEM preferences for software-upgradable accuracy gains.
YOLOv5 and attention-based networks now achieve more than 95% precision and over 98% recall while keeping inference below 45 ms, meeting real-time safety budgets. As over-the-air pipelines mature, automakers can retrain models on edge-case footage and push updates without hardware swaps. The traffic signal recognition market continues transitioning toward AI-centric stacks where differentiators sit in data curation, not circuit design.
In 2025, Camera Systems captured 62.55% of the traffic signal recognition market revenue, driven by declining BOM costs and the integration of advanced software tooling, which enhanced system efficiency and functionality. This dominance highlights the growing adoption of Camera Systems in traffic signal recognition applications. Despite a moderation in growth rates, the market size for Camera Systems in traffic signal recognition is projected to surge at a strong CAGR through 2031, supported by continuous technological advancements.
LiDAR-Camera Fusion is the fastest-advancing sub-segment at 4.12% CAGR as suppliers like Hesai plan 50% price cuts that place solid-state units within mainstream trims. SparseLIF and similar frameworks align point-cloud geometry with image texture, producing redundancy that sustains recognition when glare or precipitation blinds cameras. Radar-assisted options add speed vectors that predict phase changes, illustrating how multi-sensor blending reshapes the traffic signal recognition market.
Complete Report Scope:
- By Detection Method
- Color-based Detection
- Shape-based Detection
- Feature / Deep-Learning Detection
- By Sensor Technology
- Camera Systems
- Radar-Assisted TSR
- LiDAR-Camera Fusion
- Multi-modal
- By Vehicle Type
- Passenger Cars
- Light Commercial Vehicles
- Medium and Heavy Commercial Vehicles
- Buses and Coaches
- By Component
- Hardware
- Software
- By End-User
- OEM-installed
- Aftermarket Retrofit
- Geography
- North America
- United States
- Canada
- Rest of North America
- South America
- Brazil
- Argentina
- Rest of South America
- Europe
- Germany
- United Kingdom
- France
- Spain
- Italy
- Rest of Europe
- Asia-Pacific
- China
- Japan
- South Korea
- India
- Rest of Asia-Pacific
- Middle East and Africa
- Saudi Arabia
- United Arab Emirates
- Egypt
- South Africa
- Rest of Middle East and Africa
- North America
Geography Analysis
Asia-Pacific led with 38.31% of the traffic signal recognition market revenue share in 2025 and is expected to grow at a 3.98% CAGR through 2031. Domestic regulations, smart-city pilots, and vertical integration concentrate the traffic signal recognition market in China, Japan, and South Korea. Shenzhen's V2I corridors feed real-time phase maps to test fleets, while Tokyo's sensor industry supplies HDR imagers to global OEMs. Regional high-density traffic creates diverse datasets that sharpen deep-learning robustness and accelerate global validation cycles.
Europe follows, propelled by General Safety Regulation II. Continental's new Aumovio division and Bosch's sensor-fusion suites anchor supply, while stringent cybersecurity rules shape data-handling architectures. Insurance telematics in Germany and the United Kingdom reward verified compliance, channeling consumer demand into the traffic signal recognition market.
North America benefits from federal safety mandates and venture-backed autonomy pilots. California's edge-case legal scrutiny pushes suppliers to document fail-safe performance, while Canada's winter climate provides natural laboratories for adverse-weather testing. Together, these factors sustain a diversified yet interconnected geography where advances in one region ripple quickly to others through globally distributed OEM programs.
- Continental AG
- Robert Bosch GmbH
- DENSO Corporation
- Mobileye (Intel)
- ZF Friedrichshafen AG
- HELLA (FORVIA)
- Aptiv PLC
- Valeo SA
- Magna International Inc.
- Panasonic Holdings
- Hyundai Mobis
- Hitachi Astemo
- Veoneer / S-SW
- Ford Motor Company
- General Motors Company
- Tesla Inc.
- NVIDIA Corporation
Additional Benefits:
- The market estimate (ME) sheet in Excel format
- 3 months of analyst support
TABLE OF CONTENTS
1 Introduction
- 1.1 Study Assumptions & Market Definition
- 1.2 Scope of the Study
2 Research Methodology
3 Executive Summary
4 Market Landscape
- 4.1 Market Overview
- 4.2 Market Drivers
- 4.2.1 Regulation-mandated ADAS inclusion
- 4.2.2 Camera Cost Curve Drops Below USD10/unit
- 4.2.3 Level-2 Plus Autonomy Proliferation
- 4.2.4 V2I-Enabled Dynamic Sign Updates
- 4.2.5 HD-Map Digital-Twin Build-Outs
- 4.2.6 Insurance Telematics Rewarding TSR Accuracy
- 4.3 Market Restraints
- 4.3.1 Poor Recognition in Low-Visibility and Weather Extremes
- 4.3.2 Country-Specific Dataset Validation Costs
- 4.3.3 Cyber-Liability For Erroneous Sign Display
- 4.3.4 OEM Budget Shift to Competing Sensor Priorities
- 4.4 Value / Supply-Chain Analysis
- 4.5 Regulatory Landscape
- 4.6 Technological Outlook
- 4.7 Porter's Five Forces
- 4.7.1 Threat of New Entrants
- 4.7.2 Bargaining Power of Buyers/Consumers
- 4.7.3 Bargaining Power of Suppliers
- 4.7.4 Threat of Substitute Products
- 4.7.5 Intensity of Competitive Rivalry
5 Market Size & Growth Forecasts (Value (USD))
- 5.1 By Detection Method
- 5.1.1 Color-based Detection
- 5.1.2 Shape-based Detection
- 5.1.3 Feature / Deep-Learning Detection
- 5.2 By Sensor Technology
- 5.2.1 Camera Systems
- 5.2.2 Radar-Assisted TSR
- 5.2.3 LiDAR-Camera Fusion
- 5.2.4 Multi-modal
- 5.3 By Vehicle Type
- 5.3.1 Passenger Cars
- 5.3.2 Light Commercial Vehicles
- 5.3.3 Medium and Heavy Commercial Vehicles
- 5.3.4 Buses and Coaches
- 5.4 By Component
- 5.4.1 Hardware
- 5.4.2 Software
- 5.5 By End-User
- 5.5.1 OEM-installed
- 5.5.2 Aftermarket Retrofit
- 5.6 Geography
- 5.6.1 North America
- 5.6.1.1 United States
- 5.6.1.2 Canada
- 5.6.1.3 Rest of North America
- 5.6.2 South America
- 5.6.2.1 Brazil
- 5.6.2.2 Argentina
- 5.6.2.3 Rest of South America
- 5.6.3 Europe
- 5.6.3.1 Germany
- 5.6.3.2 United Kingdom
- 5.6.3.3 France
- 5.6.3.4 Spain
- 5.6.3.5 Italy
- 5.6.3.6 Rest of Europe
- 5.6.4 Asia-Pacific
- 5.6.4.1 China
- 5.6.4.2 Japan
- 5.6.4.3 South Korea
- 5.6.4.4 India
- 5.6.4.5 Rest of Asia-Pacific
- 5.6.5 Middle East and Africa
- 5.6.5.1 Saudi Arabia
- 5.6.5.2 United Arab Emirates
- 5.6.5.3 Egypt
- 5.6.5.4 South Africa
- 5.6.5.5 Rest of Middle East and Africa
- 5.6.1 North America
6 Competitive Landscape
- 6.1 Market Concentration
- 6.2 Strategic Moves
- 6.3 Market Share Analysis
- 6.4 Company Profiles (includes Global Level Overview, Market Level Overview, Core Segments, Financials as Available, Strategic Information, Market Rank/Share for Key Companies, Products and Services, SWOT Analysis, and Recent Developments)
- 6.4.1 Continental AG
- 6.4.2 Robert Bosch GmbH
- 6.4.3 DENSO Corporation
- 6.4.4 Mobileye (Intel)
- 6.4.5 ZF Friedrichshafen AG
- 6.4.6 HELLA (FORVIA)
- 6.4.7 Aptiv PLC
- 6.4.8 Valeo SA
- 6.4.9 Magna International Inc.
- 6.4.10 Panasonic Holdings
- 6.4.11 Hyundai Mobis
- 6.4.12 Hitachi Astemo
- 6.4.13 Veoneer / S-SW
- 6.4.14 Ford Motor Company
- 6.4.15 General Motors Company
- 6.4.16 Tesla Inc.
- 6.4.17 NVIDIA Corporation
7 Market Opportunities & Future Outlook
- 7.1 White-space & Unmet-need Assessment


