


 |
市場調查報告書
商品編碼
2113476
螺桿壓縮機:市場佔有率分析、產業趨勢與統計、成長預測(2026-2031)Screw Compressors - Market Share Analysis, Industry Trends & Statistics, Growth Forecasts (2026 - 2031) |
||||||

※ 本網頁內容可能與最新版本有所差異。詳細情況請與我們聯繫。
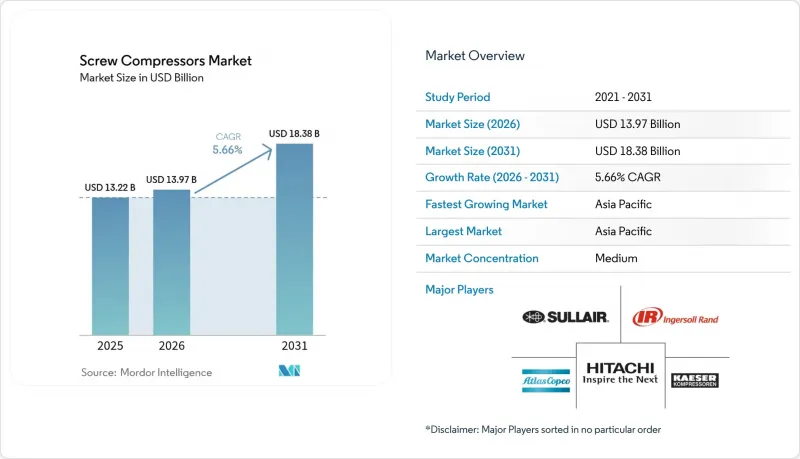
據 Mordor Intelligence 稱,螺桿壓縮機市場預計到 2026 年價值 139.7 億美元,高於 2025 年的 132.2 億美元,預計到 2031 年將達到 183.8 億美元。
預計 2026 年至 2031 年的複合年成長率為 5.66%。
本報告按技術(注油式和無油式)、級數(單級和多級)、終端用戶行業(製造業(鋼鐵、化工)、石油天然氣、採礦、建築業及其他終端用戶行業)和地區(北美、歐洲、亞太、南美以及中東和非洲)進行細分。市場規模和預測均以美元計價。
全球螺桿壓縮機市場趨勢與洞察
離散製造業和流程產業的工業自動化和資本支出激增
工廠正在進行維修,將氣壓執行器、取放機器人和視覺檢測站等設備整合到生產線中——所有這些都需要穩定的壓力供應——從而推動了工業自動化專案對壓縮空氣的基本需求。人事費用的上升和生產回流的趨勢正在加速工廠升級,優先採用內建變速驅動器以實現負載平衡的連續運行螺桿壓縮機。汽車組裝、食品包裝和精細化工產業正在升級到連網壓縮機房,並採用基於感測器的狀態監測進行預測性維護。隨著工廠管理人員將運作和能源儀錶板放在首位,能夠將控制系統與工廠監控系統整合的供應商正在獲得市場佔有率。這種自動化的長期加速發展支撐了螺桿壓縮機市場未來多年的訂單前景。
能源效率法規及IE4/IE5馬達改造
強制性最低性能要求迫使營運商更換不符合歐盟指令 2019/1781 和美國 2025 年旋轉壓縮機法規中規定的等熵閾值的舊式旋轉壓縮機(適用於 35 至 1,250 立方英尺/分鐘的型號)。升級至 IE4/IE5 馬達可使系統節能高達 10%,並可獲得公用事業公司的補貼,將投資回收期縮短至三年以內。根據加州法規,設施營運商每台壓縮機可透過降低電力成本節省 2,700 至 9,200 美元。這一監管障礙不利於沒有先進電機平台的小型製造商,並將市場佔有率推向擁有超高效轉子和高品質繞組設計的成熟製造商。
原物料價格波動(鐵、銅、稀土元素磁鐵)
過去八個季度,鋼、銅和釹鐵硼磁鐵的價格波動超過25%,導致某些尺寸的組件成本上漲超過45%。如果無法將季度價格上漲轉嫁到合約中,缺乏避險方案的中小型OEM製造商將面臨營運資金緊張和毛利率下降的困境。銅價的飆升對IE5馬達繞組和板翅式熱交換器都造成了雙重打擊。釹的價格飆升阻礙了永磁馬達的普及,並延緩了高效能馬達的推出。擁有自有鑄造廠和長期採購協議的製造商可以抵消價格波動的影響,但二級組裝面臨交貨延遲的風險,這可能會降低螺桿壓縮機的可靠性,並減緩新型號的推廣。
細分市場分析
2025年,由於初始投資成本低且能承受嚴苛的運作工況,油潤滑螺桿壓縮機仍佔68.72%的市佔率。同時,受潔淨標示食品加工、生物相似藥生產和氫氣加註等行業需求的推動,無油產品組合正以6.78%的複合年成長率快速成長,從而縮小了生命週期成本差距。預計到2031年,在0級認證和公共產業公司獎勵注水產品的激勵措施的推動下,無油螺桿壓縮機市場規模將達到61.75億美元。原始設備製造商(OEM)透過精密研磨的不銹鋼轉子和乾式空氣端密封件來降低停機成本,並將使用壽命延長至24,000小時以上。
此外,製造商正透過將無油壓縮機主機與熱回收模組結合,推進其脫碳工作,從而將高達 80% 的輸入能量回收為可用的熱水。奉行科學目標 (SBT) 的企業更傾向於無油解決方案,因為它們無需下游過濾工藝,並且可以降低 3-4% 的電力消耗。隨著飲料業和半導體製造廠對潤滑油污染的限制日益嚴格,螺旋壓縮機的市場佔有率將繼續轉移到無油機型。擁有豐富產品系列的供應商可以透過向重工業交叉銷售油潤滑系統,同時向潔淨區向上提升銷售無油系統,來維持其市場佔有率。
區域分析
受中國、印度和東協地區持續工廠建設的推動,預計到2025年,亞太地區將佔據螺桿壓縮機市場41.12%的主導佔有率。該地區到2031年的複合年成長率預計將達到6.12%,這主要得益於政府基礎設施投資、汽車動力總成生產的在地化以及電子產品生產的激增。北京的「中國製造」藍圖鼓勵建造高度依賴壓縮空氣網路的CNC加工單元和SMT生產線,迫使本土OEM廠商獲得高效螺桿型材的許可。印度針對原料藥藥和加工食品的生產連結獎勵計畫(PLI)計劃正在促進在無菌生產區採購無油產品,而國家鐵路的電氣化改造則在列車車輛段增加了固定設備。
在北美,由替換需求主導的市場環境正在擴大,美國能源局2025年的能源效率法規正推動現有設備轉型為高效節能型機架尺寸。德克薩斯州和賓州天然氣處理廠的棕地工程需要配備1級2區認證的高功率撬裝式壓縮機。在墨西哥,快速發展的汽車和電子產業叢集推動了對用於塑膠成型和PCB分板的中壓壓縮機的需求成長。在墨西哥設有組裝廠的供應商正利用美墨加協定(USMCA)的免稅通道來縮短總體市場的前置作業時間並控制運輸成本。
歐洲嚴格的噪音法規、生態設計和 PFAS 政策正在營造一種「優質化」效應,使配備密封隔音罩和經認證的環保潤滑油的高階產品更受青睞。在德國的製程工業中,多層熱回收裝置正被用於蒸氣迴路的脫碳,而東歐的契約製造製造商則面臨著對低成本、符合監管規定的單級螺桿壓縮機日益成長的需求。在英國藥品和保健產品監管局 (MHRA) 的法律規範下,英國製藥產業叢集仍然是無油機械的主要買家。在整個歐洲,環境正在向綜合審查轉變,將壓縮空氣、冷卻劑和冷凝水水資源管理作為單一系統進行評估,從而加深與供應商的合作關係。
其他好處:
- Excel格式的市場預測(ME)表
- 3個月的分析師支持
目錄
第1章:引言
- 研究假設和市場定義
- 調查範圍
第2章:調查方法
第3章執行摘要
第4章 市場狀況
- 市場概覽
- 市場促進因素
- 離散產業和流程產業的工業自動化和資本投資熱潮
- 能源效率法規及IE4/IE5馬達維修
- 石油和天然氣上游和中游領域現有設施的擴建。
- 食品、飲料和製藥業對無油設備的需求很高,因為這些產業的衛生管理極為重要。
- 部署氫氣加註網路需要高壓無油螺桿壓縮機。
- 工業脫碳熱回收裝置
- 市場限制因素
- 原物料價格波動(鐵、銅、稀土元素磁鐵)
- 在功率輸出範圍為 2 MW 或以上的場合,使用離心式和渦卷式壓縮機作為替代方案存在風險。
- 歐盟關於噪音和職場暴露的指令更加嚴格
- 隨著 PFAS 潤滑油禁令的臨近,人們對目前的潤滑油配方提出了擔憂。
- 供應鏈分析
- 監理情勢
- 技術展望
- 波特五力模型
第5章 市場規模與成長預測
- 透過技術
- 油注入式
- 無油
- 逐階段
- 單級
- 多階段
- 終端用戶產業
- 製造業(鋼鐵、化工)
- 石油和天然氣
- 礦業
- 建造
- 其他終端用戶產業
- 地區
- 北美洲
- 美國
- 加拿大
- 墨西哥
- 歐洲
- 德國
- 英國
- 法國
- 義大利
- 俄羅斯
- 其他歐洲國家
- 亞太地區
- 中國
- 印度
- 日本
- 韓國
- 東南亞國協
- 其他亞太國家
- 南美洲
- 巴西
- 阿根廷
- 其他南美國家
- 中東和非洲
- 沙烏地阿拉伯
- 阿拉伯聯合大公國
- 南非
- 埃及
- 其他中東和非洲國家
- 北美洲
第6章 競爭情勢
- 市場集中度
- 策略趨勢(併購、聯盟、購電協議)
- 市場佔有率分析(主要公司的市場排名和佔有率)
- 公司簡介
- Aerzener Maschinenfabrik GmbH
- Atlas Copco AB
- Bauer Kompressoren GmbH
- Daikin Industries Ltd
- Emerson Electric Co
- Hitachi Industrial Equipment Systems
- Ingersoll Rand PLC
- Mitsubishi Electric Corporation
- Kobe Steel Ltd
- Kaeser Kompressoren SE
- Gardner Denver Industries LLC
- Sullair LLC
- Siemens Energy AG
- Elgi Equipments Ltd
- Doosan Infracore Co Ltd
- BOGE Kompressoren GmbH
- Kaishan Compressor USA & China
- Quincy Compressor LLC
- Hanbell Precise Machinery Co Ltd
- Baker Hughes(Compression Systems)
第7章 市場機會與未來展望
According to Mordor Intelligence, screw compressors market size in 2026 is estimated at USD 13.97 billion, growing from 2025 value of USD 13.22 billion with 2031 projections showing USD 18.38 billion, growing at 5.66% CAGR over 2026-2031.
This report is Segmented by Technology (Oil-Injected and Oil-Free), Stage (Single-Stage and Multi-Stage), End-User Industry (Manufacturing (Steel, Chemicals), Oil and Gas, Mining, Construction, and Other End-User Industries), and Geography (North America, Europe, Asia-Pacific, South America, and Middle East and Africa). The Market Sizes and Forecasts are Provided in Terms of Value (USD).
Global Screw Compressors Market Trends and Insights
Industrial Automation & Cap-Ex Boom in Discrete and Process Industries
Industrial automation projects are raising baseline demand for compressed air as factories retrofit lines with pneumatic actuators, pick-and-place robots, and vision-inspection stations that require stable pressure delivery. Rising labour costs and reshoring trends are accelerating plant upgrades that favour continuous-duty screw compressors with built-in variable-speed drives for load matching. Automotive assembly, food packaging, and fine chemicals are upgrading to networked compressor rooms that embed sensor-based condition monitoring for predictive maintenance. Vendors able to integrate controls with factory supervisory systems are gaining share because plant managers prioritise uptime and energy dashboards. This secular automation push anchors multi-year order visibility for the screw compressors market
Energy-Efficiency Mandates & IE4/IE5 Motor Retrofits
Mandatory minimum-performance requirements are forcing operators to replace legacy rotary units that fail to meet the EU 2019/1781 isentropic thresholds and the United States' 2025 rotary compressor rule, which covers 35-1,250 cfm models. IE4/IE5 motor retrofits unlock up to 10% energy savings at the system level and qualify for utility rebates, lowering payback periods to less than three years.California's state code shows facility operators can save USD 2,700-9,200 per compressor through lower electricity bills. The regulatory hurdle disadvantages smaller manufacturers that lack advanced motor platforms, nudging market share toward incumbents with proprietary high-efficiency rotors and premium winding designs.
Raw-Material Cost Volatility (Steel, Copper, Rare-Earth Magnets)
Steel, copper, and NdFeB magnet prices have fluctuated by more than 25% over the past eight quarters, increasing bill-of-materials exposure to exceed 45% for certain frame sizes. Smaller OEMs with limited hedging programs face a working-capital strain and thin gross margins when quarterly surcharges cannot be passed through to contracts. Copper drives double pain: winding packs for IE5 motors and plate-fin heat exchangers. Elevated Nd pricing complicates the adoption of permanent-magnet motors, delaying the introduction of premium-efficiency variants. Producers with captive foundries and long-term offtake agreements can offset volatility, but tier-2 assemblers risk delivery delays, which can dent credibility and slow the adoption of new models in the screw compressors market.
Other drivers and restraints analyzed in the detailed report include:
- Upstream & Midstream Oil-&-Gas Brownfield Expansions
- Hygiene-Critical F&B & Pharma Demand for Oil-Free Units
- Substitution Risk from Centrifugal & Scroll Compressors in >= 2 MW Range
For complete list of drivers and restraints, kindly check the Table Of Contents.
Segment Analysis
Oil-injected designs retained a 68.72% market share over screw compressors in 2025, thanks to favourable acquisition costs and rugged duty-cycle tolerance. The oil-free cohort is expanding at a 6.78% CAGR, driven by clean-label food processing, biosimilar drug production, and hydrogen refueling needs, thereby narrowing the lifecycle-cost gap. The screw compressors market size for oil-free lines is projected to reach USD 6,175 million by 2031, buoyed by Class 0 certifications and utility incentives for water-injected variants. OEMs are deploying precision-ground stainless steel rotors and dry air-end seals to extend service life beyond 24,000 hours, thereby reducing downtime premiums.
Manufacturers are also pairing oil-free air ends with heat-recovery modules that reclaim up to 80% of input energy as usable hot water, advancing the decarbonization agenda. Corporates with science-based targets prefer oil-free solutions because they eliminate downstream filtration, reducing power draw by 3-4%. The screw compressor market share differential will continue to tilt toward oil-free models as regulatory regimes tighten lubricant carryover limits in beverage and semiconductor fabs. Vendors with dual portfolio breadth can cross-sell oil-injected systems into heavy industry while upselling oil-free systems into clean zones, thereby defending their market share.
Complete Report Scope:
- By Technology
- Oil-Injected
- Oil-Free
- By Stage
- Single-Stage
- Multi-Stage
- End-User Industry
- Manufacturing (Steel, Chemicals)
- Oil and Gas
- Mining
- Construction
- Other End-User Industries
- Geography
- North America
- United States
- Canada
- Mexico
- Europe
- Germany
- United Kingdom
- France
- Italy
- Russia
- Rest of Europe
- Asia-Pacific
- China
- India
- Japan
- South Korea
- ASEAN Countries
- Rest of Asia-Pacific
- South America
- Brazil
- Argentina
- Rest of South America
- Middle-East and Africa
- Saudi Arabia
- United Arab Emirates
- South Africa
- Egypt
- Rest of Middle East and Africa
- North America
Geography Analysis
The Asia-Pacific region held a commanding 41.12% share of the screw compressors market in 2025, driven by relentless factory construction across China, India, and ASEAN. The regional 6.12% CAGR to 2031 benefits from government infrastructure outlays, localisation of automotive drivetrains, and surging electronics output. Beijing's Made-in-China roadmap incentivises CNC machining cells and SMT lines that rely heavily on compressed air networks, pushing local OEMs to license efficient screw profiles. India's PLI schemes for APIs and processed foods are driving oil-free purchases in sterile production zones, while state rail electrification is adding fixed installations along carriage depots.
North America represents a replacement-driven landscape, where the Department of Energy's 2025 efficiency rule is moving the installed base toward premium-efficiency frame sizes. Brownfield expansions at gas-processing hubs in Texas and Pennsylvania require high-horsepower skids with Class 1 Div 2 certification. Mexico's fast-rising auto and electronics clusters attract mid-pressure units for plastics moulding and PCB depaneling. Vendors with Mexican assembly plants utilize the USMCA duty-free corridor to reduce lead times and manage landed costs in the broader screw compressors market.
Europe's stringent noise, ecodesign, and PFAS policies create a premiumisation effect that favours high-end offerings with enclosed acoustic canopies and validated green lubricants. Germany's process industries are adopting multi-stage heat-recovery packages to decarbonize steam loops, while Eastern European contract manufacturers are seeking lower-priced but compliant single-stage screws. UK pharma clusters remain key buyers of oil-free machines due to MHRA regulatory oversight. The overall European environment is tilting toward integrated audits, where compressed air, cooling water, and condensate management are procured as a single system, thereby deepening vendor relationships.
- Aerzener Maschinenfabrik GmbH
- Atlas Copco AB
- Bauer Kompressoren GmbH
- Daikin Industries Ltd
- Emerson Electric Co
- Hitachi Industrial Equipment Systems
- Ingersoll Rand PLC
- Mitsubishi Electric Corporation
- Kobe Steel Ltd
- Kaeser Kompressoren SE
- Gardner Denver Industries LLC
- Sullair LLC
- Siemens Energy AG
- Elgi Equipments Ltd
- Doosan Infracore Co Ltd
- BOGE Kompressoren GmbH
- Kaishan Compressor USA & China
- Quincy Compressor LLC
- Hanbell Precise Machinery Co Ltd
- Baker Hughes (Compression Systems)
Additional Benefits:
- The market estimate (ME) sheet in Excel format
- 3 months of analyst support
TABLE OF CONTENTS
1 Introduction
- 1.1 Study Assumptions & Market Definition
- 1.2 Scope of the Study
2 Research Methodology
3 Executive Summary
4 Market Landscape
- 4.1 Market Overview
- 4.2 Market Drivers
- 4.2.1 Industrial automation & cap-ex boom in discrete and process industries
- 4.2.2 Energy-efficiency mandates & IE4/IE5 motor retrofits
- 4.2.3 Upstream & midstream oil-&-gas brownfield expansions
- 4.2.4 Hygiene-critical F&B & pharma demand for oil-free units
- 4.2.5 Hydrogen refueling network roll-out needs high-pressure oil-free screws
- 4.2.6 Heat-recovery-ready packages for industrial decarbonisation
- 4.3 Market Restraints
- 4.3.1 Raw-material cost volatility (steel, copper, rare-earth magnets)
- 4.3.2 Substitution risk from centrifugal & scroll compressors in >=2 MW range
- 4.3.3 Tightening EU noise & workplace-exposure directives
- 4.3.4 Pending PFAS lubricant ban jeopardises current oil formulations
- 4.4 Supply Chain Analysis
- 4.5 Regulatory Landscape
- 4.6 Technological Outlook
- 4.7 Porter's Five Forces
- 4.7.1 Bargaining Power of Suppliers
- 4.7.2 Bargaining Power of Consumers
- 4.7.3 Threat of New Entrants
- 4.7.4 Threat of Substitutes Products and Services
- 4.7.5 Intensity of Competitive Rivalry
5 Market Size & Growth Forecasts
- 5.1 By Technology
- 5.1.1 Oil-Injected
- 5.1.2 Oil-Free
- 5.2 By Stage
- 5.2.1 Single-Stage
- 5.2.2 Multi-Stage
- 5.3 End-User Industry
- 5.3.1 Manufacturing (Steel, Chemicals)
- 5.3.2 Oil and Gas
- 5.3.3 Mining
- 5.3.4 Construction
- 5.3.5 Other End-User Industries
- 5.4 Geography
- 5.4.1 North America
- 5.4.1.1 United States
- 5.4.1.2 Canada
- 5.4.1.3 Mexico
- 5.4.2 Europe
- 5.4.2.1 Germany
- 5.4.2.2 United Kingdom
- 5.4.2.3 France
- 5.4.2.4 Italy
- 5.4.2.5 Russia
- 5.4.2.6 Rest of Europe
- 5.4.3 Asia-Pacific
- 5.4.3.1 China
- 5.4.3.2 India
- 5.4.3.3 Japan
- 5.4.3.4 South Korea
- 5.4.3.5 ASEAN Countries
- 5.4.3.6 Rest of Asia-Pacific
- 5.4.4 South America
- 5.4.4.1 Brazil
- 5.4.4.2 Argentina
- 5.4.4.3 Rest of South America
- 5.4.5 Middle-East and Africa
- 5.4.5.1 Saudi Arabia
- 5.4.5.2 United Arab Emirates
- 5.4.5.3 South Africa
- 5.4.5.4 Egypt
- 5.4.5.5 Rest of Middle East and Africa
- 5.4.1 North America
6 Competitive Landscape
- 6.1 Market Concentration
- 6.2 Strategic Moves (M&A, Partnerships, PPAs)
- 6.3 Market Share Analysis (Market Rank/Share for key companies)
- 6.4 Company Profiles (includes Global level Overview, Market level overview, Core Segments, Financials as available, Strategic Information, Products & Services, and Recent Developments)
- 6.4.1 Aerzener Maschinenfabrik GmbH
- 6.4.2 Atlas Copco AB
- 6.4.3 Bauer Kompressoren GmbH
- 6.4.4 Daikin Industries Ltd
- 6.4.5 Emerson Electric Co
- 6.4.6 Hitachi Industrial Equipment Systems
- 6.4.7 Ingersoll Rand PLC
- 6.4.8 Mitsubishi Electric Corporation
- 6.4.9 Kobe Steel Ltd
- 6.4.10 Kaeser Kompressoren SE
- 6.4.11 Gardner Denver Industries LLC
- 6.4.12 Sullair LLC
- 6.4.13 Siemens Energy AG
- 6.4.14 Elgi Equipments Ltd
- 6.4.15 Doosan Infracore Co Ltd
- 6.4.16 BOGE Kompressoren GmbH
- 6.4.17 Kaishan Compressor USA & China
- 6.4.18 Quincy Compressor LLC
- 6.4.19 Hanbell Precise Machinery Co Ltd
- 6.4.20 Baker Hughes (Compression Systems)
7 Market Opportunities & Future Outlook
- 7.1 White-space & Unmet-Need Assessment

 螺桿壓縮機市場報告:按類型、技術、級數、最終用途行業和地區分類,2026-2034年
 2026年全球螺桿壓縮機市場報告
 全球注水式無油螺桿壓縮機市場(按類型、供氣壓力、功率、容量和最終用戶分類)預測(2026-2032年)
 螺桿壓縮機市場規模、佔有率和成長分析(按類型、級數、技術、最終用戶和地區分類)-2026-2033年產業預測
 全球螺桿壓縮機市場(至 2030 年)按類型(油潤滑/無油)、技術(固定式/可攜式)、級數(單級/多級)、馬力(<50hp/51-250hp/>250hp)、動力來源、最終用戶和地區分類
 南美螺桿壓縮機市場佔有率分析、行業趨勢和成長預測(2025-2030 年)
 螺旋式壓縮機 的全球市場的評估:各類型,各階段,各技術,各終端用戶產業,各地區,機會,預測,2017年~2031年