


 |
市場調查報告書
商品編碼
2113272
水力壓裂化學品:市場佔有率分析、產業趨勢與統計、成長預測(2026-2031 年)Fracking Chemicals - Market Share Analysis, Industry Trends & Statistics, Growth Forecasts (2026 - 2031) |
||||||

※ 本網頁內容可能與最新版本有所差異。詳細情況請與我們聯繫。
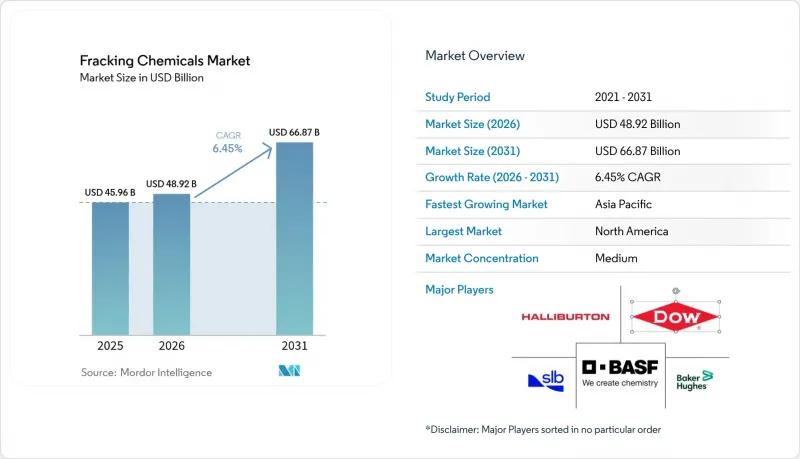
據 Mordor Intelligence 稱,2026 年水力壓裂化學品市場規模估計為 489.2 億美元,高於 2025 年的 459.6 億美元,預計到 2031 年將達到 668.7 億美元。
預計從 2026 年到 2031 年,其複合年成長率將達到 6.45%。
本報告按流體類型(水基、油基、發泡、凝膠型、酸基)、添加劑功能(膠凝劑、減磨劑、界面活性劑、消毒劑、腐蝕/結垢抑制劑、交聯劑、壓裂劑)、井類型(水平井和垂直井)以及地區(北美、歐洲、亞太地區、南美、中東和非洲)進行分類。
全球壓裂化學品市場趨勢與洞察
水平鑽井活動激增
鑽井效率的快速提升導致井場數量、水平隧道長度和壓裂段數的增加,所有這些都導致了化學品消耗量的增加。雪佛龍公司的「三重壓裂」技術將在2025年前應用於二疊紀盆地約一半的油井,從而將完井時間縮短25%,單井成本降低12%。多井同步壓裂使每日用水量和砂用量增加了約60%,因此,對能夠在超過10,000磅/平方英寸(psi)的泵壓下保持性能的減磨劑、殺菌劑和阻垢劑的需求也隨之增加。一家預計到2025年將鑽探6,604口油井的加拿大業者也正在採用類似方法來彌補現有油井產量的下降。據鑽井承包商稱,水平隧道長度越長,流體摩擦力越大,因此需要增加滑溜水添加劑的用量才能維持泵浦的排氣量。丹佛-朱爾斯堡盆地先進完工設計的激增表明,這種成長勢頭不再局限於傳統的頁岩氣產區。
對用於光滑水面應用的減磨劑的需求日益成長
聚丙烯醯胺減磨劑目前佔據添加劑支出的大部分,因為即使在總溶解固態(TDS)含量超過100,000 ppm的生產水鹽度水平下,它們也能保持65%至70%的減摩效果。其耐鹽化學成分使操作人員能夠在現場循環使用水,從而減少淡水取用和運輸成本,同時保持泵浦輸出穩定。在低滲透性儲存中進行的現場試驗表明,摩擦力降低超過70%,且未對地質構造造成任何殘留損害,從而消除了人們對滲透性降低的擔憂。黏度增強型減磨劑的出現結合了滑溜水和凝膠的優勢,使操作人員能夠以更高的泵排量輸送高密度丙烷。嚴格的排放目標也是推動這項需求的原因。與高黏度凝膠相比,滑溜水系統所需的丙烷濃度更低,從而縮短了現場作業時間並降低了柴油消耗。
原油價格波動
價格波動幾乎會立即改變鑽井的獲利能力,進而影響完井計劃,最終影響化學品的即時需求。達拉斯聯邦儲備銀行的報告顯示,2025年上半年原物料投入下降,乙烷價格為每磅0.09美元,乙烯價格為每磅0.21美元。 2025年初美國對華乙烷出口中斷,進一步加劇了丙烯醯胺和瓜爾膠衍生物的供應擔憂,而這些衍生物是減磨劑的關鍵原料。預算緊張的營運商正在透過縮短鑽井段長度和減少丙烷投入來應對,導致每口井使用的聚合物和界面活性劑用量減少。化學品供應商面臨庫存風險,被迫重新談判長期合約或關閉利用率不足的混合設施,直到運轉率趨勢穩定下來。雖然避險策略可以緩解部分風險,但低價格時期由此產生的現金流壓力可能會延遲對更環保的化學技術和數位平台等創新技術的投資。
細分市場分析
2025年,隨著業者優先考慮成本效益和合規性,水基系統將佔壓裂化學品市場72.05%的佔有率。發泡液具有降低水資源運輸負擔和提升丙烷輸送性能等優勢,預計將以14.85%的複合年成長率成長,超過整體市場成長率。耐鹽減磨劑和可生物分解界面活性劑的出現進一步鞏固了水基液的優勢,使得在不降低泵送速率的情況下,可以重複利用40%至60%的採出水。例如,阿根廷業者在超過95%的壓裂階段使用水基液,充分體現了水基化學品的全球標準化。同時,沙烏地阿拉伯開發的海水基混合物透過使用特殊的阻垢劑,有效應對了高硫酸鹽負荷,從而擴大了其在乾旱地區的應用範圍。
在中東地區,油基和凝膠型油基配方在高溫碳酸鹽岩儲存中仍佔有重要地位。這些地區需要芳香族溶劑和高濃度界面活性劑,以確保在超過150 度C的溫度下保持穩定。凝膠系統在北美地區的作業中繼續使用,其高黏度有助於丙烷在低壓區懸浮。酸性流體對於提高碳酸鹽岩的採收率仍然至關重要,但隨著作業者轉向混合(酸性-滑溜水)處理以最大限度降低腐蝕風險,酸性流體的使用量正在下降。鑑於預計廢棄物法規將日益嚴格,水基體系供應商正在擴展現場回收設備和線上添加劑注入系統,以確保符合法規要求並保持成本競爭力。
區域分析
北美擁有豐富的頁岩資源、完善的中游基礎設施和歷史悠久的服務公司,仍然是水力壓裂活動的中心,預計到2025年將佔據壓裂化學品市場57.12%的佔有率。美國仍佔據全球水力壓裂產能的很大一部分,而加拿大預計到2025年將恢復鑽井作業,達到6,604口井,這將提振該地區對聚合物和殺菌劑的需求。隨著巴肯盆地和二疊紀盆地生產用水再利用相關法規的明確,以及電動車的普及,顯示該地區已準備好整合低碳化學解決方案。
預計亞太地區將呈現最高成長率,到2031年複合年成長率將達到8.05%,並有望縮小與北美地區的差距。中國瓊竹寺海上頁岩先導井反映了巴內特頁岩早期產能,證實了技術轉移工作正在取得成效,並推動了中石化和中石油旗下子公司擴大國內化工產能。在印度和印度尼西亞,深層頁岩層的探勘工作正在推進,如果實現商業化,將成倍增加該地區對高耐鹽性減磨劑和阻垢劑的需求。中國和澳洲部分地區的水資源短缺正在加速發泡和海水基流體的應用,添加劑產品組合正在向水化時間短的聚合物和高發泡界面活性劑轉型。
在南美洲,阿根廷的瓦卡穆埃爾塔頁岩氣田是這股趨勢的核心。預計該地區2023年的壓裂作業段數將年增17.6%,到2024年將達到18,000段。瓜爾膠和砂的物流供應受限,推動了創新減磨劑混合物和模組化採砂策略的研發。巴西陸上頁岩氣開發計畫剛剛啟動,哥倫比亞的探勘工作也為該地區的化學品供應商創造了更多成長機會。
在歐洲,受成熟大陸天然氣田的再壓裂和北海緻密氣田的重新開發等因素驅動,需求穩定成長。環境監測依然嚴格,符合歐盟REACH法規的綠色添加劑正日益受到青睞。波蘭和烏克蘭的先導計畫凸顯了地質的複雜性,並強調了對能夠承受更高二氧化碳分壓的先進膠凝劑和腐蝕抑制劑的需求。
在中東和非洲,新興的傳統型資源開發正與碳酸鹽岩增產方案結合。沙烏地阿拉伯成功的海水壓裂和阿曼的緻密氣開發計畫表明,未來對專為高溫環境設計的防垢添加劑的需求將持續成長。在撒哈拉以南非洲,奈米比亞的陸上頁岩評估可望開拓新市場,但基礎設施和供水仍然是重要的障礙,預計對發泡系統的依賴將會增加。
其他好處:
- Excel格式的市場預測(ME)表
- 3個月的分析師支持
目錄
第1章:引言
- 研究假設和市場定義
- 調查範圍
第2章:調查方法
第3章執行摘要
第4章 市場狀況
- 市場概覽
- 市場促進因素
- 水平鑽井活動激增
- 對用於光滑水面應用的減磨劑的需求日益成長
- 北美以外地區頁岩氣開發的擴張
- 成熟油井的再壓裂
- 從水中回收鋰的努力
- 人工智慧驅動的數位流體最佳化平台
- 市場限制因素
- 原油價格波動
- 嚴格的廢水處理法規
- 消費者強烈反對強制揭露化學物質
- 丙烯醯胺單體供應鏈中斷
- 供應鏈分析
- 監理情勢
- 技術展望
- 波特五力模型
第5章 市場規模與成長預測
- 按流體類型
- 水溶液
- 油基
- 泡沫基
- 凝膠型
- 酸性
- 透過添加劑的功能
- 膠凝劑
- 減磨劑
- 界面活性劑
- 除生物劑
- 腐蝕和調度抑制劑
- 交聯劑
- 斷路器
- 按井類型
- 水平井
- 垂直的
- 按地區
- 北美洲
- 美國
- 加拿大
- 墨西哥
- 歐洲
- 德國
- 英國
- 法國
- 義大利
- 西班牙
- 俄羅斯
- 其他歐洲國家
- 亞太地區
- 中國
- 印度
- 日本
- 韓國
- 澳洲
- 東南亞國協
- 其他亞太國家
- 南美洲
- 阿根廷
- 巴西
- 其他南美國家
- 中東和非洲
- 沙烏地阿拉伯
- 阿拉伯聯合大公國
- 南非
- 奈及利亞
- 其他中東和非洲國家
- 北美洲
第6章 競爭情勢
- 市場集中度
- 策略趨勢(併購、聯盟、購電協議)
- 市場佔有率分析(主要公司的市場排名和佔有率)
- 公司簡介
- Halliburton Company
- Schlumberger Ltd(SLB)
- Baker Hughes Co.
- BASF SE
- Dow Inc.
- DuPont de Nemours Inc.
- Solvay SA
- Clariant AG
- Albemarle Corp.
- SNF Group
- Kemira Oyj
- Chevron Phillips Chemical Co.
- Nouryon(Nyxas Holding)
- Innospec Inc.
- Flotek Industries Inc.
- CES Energy Solutions Corp.
- Ashland Global Holdings Inc.
- Arkema SA
- Stepan Company
- Lamberti SpA
第7章 市場機會與未來展望
According to Mordor Intelligence, fracking chemicals market size in 2026 is estimated at USD 48.92 billion, growing from 2025 value of USD 45.96 billion with 2031 projections showing USD 66.87 billion, growing at 6.45% CAGR over 2026-2031.
This report is Segmented by Fluid Type (Water-Based, Oil-Based, Foam-Based, Gel-Based, and Acid-Based), Additive Function (Gelling Agents, Friction Reducers, Surfactants, Biocides, Corrosion and Scale Inhibitors, Cross-Linkers, and Breakers), Well Type (Horizontal and Vertical), and Geography (North America, Europe, Asia-Pacific, South America, and Middle East and Africa).
Global Fracking Chemicals Market Trends and Insights
Surge in Horizontal Drilling Activity
Rapid gains in drilling efficiency are translating into larger pad counts, longer laterals, and higher stage counts, collectively intensifying chemical consumption. Chevron's triple-frac technology, applied to roughly half of its 2025 Permian wells, cut completion time by 25% and reduced per-well costs by 12%. Multi-well simultaneous fracturing increases daily water and sand demand by approximately 60%, necessitating a corresponding rise in friction reducers, biocides, and scale inhibitors that can maintain performance under pumping pressures exceeding 10,000 psi. Operators in Canada, where wells drilled are forecast to reach 6,604 in 2025, are adopting similar practices to compensate for declines in legacy wells. Drilling contractors report that longer laterals elevate fluid friction, prompting higher dosages of slick-water additives to preserve pump rates. The spread of advanced completion designs into the Denver-Julesberg basin indicates that the growth dynamic is no longer confined to traditional shale heartlands.
Growing Demand for Slick-Water Friction Reducers
Polyacrylamide-based friction reducers now dominate additive spend because they maintain 65%-70% friction reduction even in produced-water salinities above 100,000 ppm total dissolved solids. Salt-tolerant chemistries enable operators to recycle on-site water, reducing freshwater withdrawals and trucking costs while maintaining constant pump horsepower. Field trials in low-permeability reservoirs demonstrate over 70% friction reduction without residual formation damage, thereby mitigating concerns about permeability impairment. The arrival of viscosity-building friction reducers blends slick-water and gel benefits, helping operators carry heavier proppant at elevated pumping rates. Demand is also buoyed by strict emission targets: slick-water systems require lower proppant concentrations than high-viscosity gels, which translates into shorter on-site times and lower diesel consumption.
Crude-Oil Price Volatility
Price swings alter drilling economics almost immediately, thereby throttling completion schedules, which in turn affect real-time chemical demand. The Dallas Federal Reserve reported feedstock input declines in the first half of 2025, including ethane at $0.09 per pound and ethylene at $0.21 per pound. Export interruptions of U.S. ethane to China earlier in 2025 exacerbated supply uncertainty for acrylamide and guar derivatives, which are crucial to friction reducers. Budget-constrained operators respond by shortening stage lengths or reducing proppant loading, translating into lower polymer and surfactant volumes per well. Chemical suppliers bear inventory risk and are compelled to renegotiate long-term contracts or idle under-utilized blending facilities until price signals stabilize. While hedging strategies mitigate some exposure, cash-flow strain during low-price windows may delay innovation spending on greener chemistries and digital platforms.
Other drivers and restraints analyzed in the detailed report include:
- Expansion of Shale Development Outside North America
- Re-Fracturing of Mature Wells
- Stringent Wastewater-Disposal Regulations
For complete list of drivers and restraints, kindly check the Table Of Contents.
Segment Analysis
Water-based systems accounted for 72.05% of the fracking chemicals market size in 2025, as operators prioritized cost efficiency and regulatory alignment. Foam-based fluids, benefitting from reduced water logistics and superior proppant transport, are forecast at a 14.85% CAGR, outpacing overall market growth. The emergence of salt-tolerant friction reducers and biodegradable surfactants has further solidified water-based dominance by enabling 40%-60% reuse of produced water without penalties to pump rates. Operators in Argentina, for instance, employ aqueous fluids in over 95% of stages, illustrating the global standardization of water-centric chemistries. Meanwhile, seawater-based blends developed in Saudi Arabia effectively cope with high sulfate loads through the use of specialized scale inhibitors, thereby expanding their applicability in arid regions.
Oil-based and gelled-oil formulations retain niche roles in ultra-high-temperature carbonate reservoirs across the Middle East, where stability above 150 °C demands aromatic solvents and heavy loadings of surfactants. Gel-based systems continue to be used in North American workovers, where higher viscosity aids proppant suspension in low-pressure zones. Acid-based fluids remain indispensable for carbonate stimulation, though volumes represent a declining share as operators pivot toward hybrid acid-slick-water treatments that minimize corrosion risk. Given projected stricter disposal rules, water-based system suppliers are scaling on-site recycling units and inline additive dosing to maintain compliance and cost leadership.
Complete Report Scope:
- By Fluid Type
- Water-based
- Oil-based
- Foam-based
- Gel-based
- Acid-based
- By Additive Function
- Gelling Agents
- Friction Reducers
- Surfactants
- Biocides
- Corrosion and Scale Inhibitors
- Cross-linkers
- Breakers
- By Well Type
- Horizontal
- Vertical
- By Geography
- North America
- United States
- Canada
- Mexico
- Europe
- Germnay
- United Kingdom
- France
- Italy
- Spain
- Russia
- Rest of Europe
- Asia Pacific
- China
- India
- Japan
- South Korea
- Australia
- ASEAN Countries
- Rest of Asia Pacific
- South America
- Argentina
- Brazil
- Rest of South America
- Middle East and Africa
- Saudi Arabia
- United Arab Emirates
- South Africa
- Nigeria
- Rest of Middle East and Africa
- North America
Geography Analysis
North America remained the epicenter of fracking activity, with a 57.12% market share of fracking chemicals in 2025, supported by abundant shale resources, robust midstream infrastructure, and long-tenured service companies. The United States still fields the majority of global hydraulic-fracturing horsepower, and Canada's drilling rebound-forecast at 6,604 wells in 2025-bolsters regional demand for polymers and biocides. Regulatory clarity on produced-water reuse, coupled with the expansion of electric fleets in the Bakken and Permian, underscores the region's readiness to integrate low-carbon chemical solutions.
Asia-Pacific is projected to post the fastest 8.05% CAGR through 2031, narrowing the gap with North America. China's Qiongzhusi marine shale pilot wells mirror early Barnett Shale productivity, validating technology transfer efforts and spurring domestic chemical capacity expansions among Sinopec and CNPC affiliates. India and Indonesia are evaluating deep shale prospects that, if commercialized, could multiply regional demand for high-salinity-tolerant friction reducers and scale inhibitors. Water scarcity in parts of China and Australia is accelerating the adoption of foam-based and seawater-based fluids, reshaping additive portfolios toward lower-hydration-time polymers and high-foaming surfactants.
South America is anchored by Argentina's Vaca Muerta, where fracture stages rose 17.6% year on year in 2023 and are on track for 18,000 stages in 2024. Localized supply constraints of guar and sand logistics have driven the development of innovative friction-reducer blends and modular sand-mine strategies. Brazil's nascent onshore shale programs and Colombia's exploratory work offer incremental upside for regional chemical suppliers.
Europe shows steady demand growth driven by refracturing in mature continental plays and the North Sea's tight-gas redevelopment projects. While environmental scrutiny remains high, EU-sourced green additives that comply with REACH regulation are gaining ground. Pilot projects in Poland and Ukraine highlight the geological complexity, underscoring the need for advanced gelling agents and corrosion inhibitors that can withstand higher carbon dioxide partial pressures.
The Middle East and Africa combine emerging unconventional targets and carbonate stimulation programs. Saudi Arabia's successful seawater-based fracturing and Oman's tight-gas campaigns illustrate future demand for scale-resistant additives tailored to high-temperature settings. In Sub-Saharan Africa, Namibia's onshore shale evaluations could open a frontier market, though infrastructure and water sourcing remain significant hurdles that will lean heavily on foam-based systems.
- Halliburton Company
- Schlumberger Ltd (SLB)
- Baker Hughes Co.
- BASF SE
- Dow Inc.
- DuPont de Nemours Inc.
- Solvay SA
- Clariant AG
- Albemarle Corp.
- SNF Group
- Kemira Oyj
- Chevron Phillips Chemical Co.
- Nouryon (Nyxas Holding)
- Innospec Inc.
- Flotek Industries Inc.
- CES Energy Solutions Corp.
- Ashland Global Holdings Inc.
- Arkema SA
- Stepan Company
- Lamberti SpA
Additional Benefits:
- The market estimate (ME) sheet in Excel format
- 3 months of analyst support
TABLE OF CONTENTS
1 Introduction
- 1.1 Study Assumptions & Market Definition
- 1.2 Scope of the Study
2 Research Methodology
3 Executive Summary
4 Market Landscape
- 4.1 Market Overview
- 4.2 Market Drivers
- 4.2.1 Surge in horizontal drilling activity
- 4.2.2 Growing demand for slick-water friction-reducers
- 4.2.3 Expansion of shale development outside North America
- 4.2.4 Re-fracturing of mature wells
- 4.2.5 Lithium-recovery from produced-water initiatives
- 4.2.6 AI-driven digital fluid-optimisation platforms
- 4.3 Market Restraints
- 4.3.1 Crude-oil price volatility
- 4.3.2 Stringent wastewater-disposal regulations
- 4.3.3 Consumer backlash after chemical-disclosure mandates
- 4.3.4 Acrylamide monomer supply-chain disruptions
- 4.4 Supply-Chain Analysis
- 4.5 Regulatory Landscape
- 4.6 Technological Outlook
- 4.7 Porter's Five Forces
- 4.7.1 Bargaining Power of Suppliers
- 4.7.2 Bargaining Power of Customers
- 4.7.3 Threat of New Entrants
- 4.7.4 Threat of Substitutes
- 4.7.5 Intensity of Competitive Rivalry
5 Market Size & Growth Forecasts
- 5.1 By Fluid Type
- 5.1.1 Water-based
- 5.1.2 Oil-based
- 5.1.3 Foam-based
- 5.1.4 Gel-based
- 5.1.5 Acid-based
- 5.2 By Additive Function
- 5.2.1 Gelling Agents
- 5.2.2 Friction Reducers
- 5.2.3 Surfactants
- 5.2.4 Biocides
- 5.2.5 Corrosion and Scale Inhibitors
- 5.2.6 Cross-linkers
- 5.2.7 Breakers
- 5.3 By Well Type
- 5.3.1 Horizontal
- 5.3.2 Vertical
- 5.4 By Geography
- 5.4.1 North America
- 5.4.1.1 United States
- 5.4.1.2 Canada
- 5.4.1.3 Mexico
- 5.4.2 Europe
- 5.4.2.1 Germnay
- 5.4.2.2 United Kingdom
- 5.4.2.3 France
- 5.4.2.4 Italy
- 5.4.2.5 Spain
- 5.4.2.6 Russia
- 5.4.2.7 Rest of Europe
- 5.4.3 Asia Pacific
- 5.4.3.1 China
- 5.4.3.2 India
- 5.4.3.3 Japan
- 5.4.3.4 South Korea
- 5.4.3.5 Australia
- 5.4.3.6 ASEAN Countries
- 5.4.3.7 Rest of Asia Pacific
- 5.4.4 South America
- 5.4.4.1 Argentina
- 5.4.4.2 Brazil
- 5.4.4.3 Rest of South America
- 5.4.5 Middle East and Africa
- 5.4.5.1 Saudi Arabia
- 5.4.5.2 United Arab Emirates
- 5.4.5.3 South Africa
- 5.4.5.4 Nigeria
- 5.4.5.5 Rest of Middle East and Africa
- 5.4.1 North America
6 Competitive Landscape
- 6.1 Market Concentration
- 6.2 Strategic Moves (M&A, Partnerships, PPAs)
- 6.3 Market Share Analysis (Market Rank/Share for key companies)
- 6.4 Company Profiles (includes Global level Overview, Market level overview, Core Segments, Financials as available, Strategic Information, Products & Services, and Recent Developments)
- 6.4.1 Halliburton Company
- 6.4.2 Schlumberger Ltd (SLB)
- 6.4.3 Baker Hughes Co.
- 6.4.4 BASF SE
- 6.4.5 Dow Inc.
- 6.4.6 DuPont de Nemours Inc.
- 6.4.7 Solvay SA
- 6.4.8 Clariant AG
- 6.4.9 Albemarle Corp.
- 6.4.10 SNF Group
- 6.4.11 Kemira Oyj
- 6.4.12 Chevron Phillips Chemical Co.
- 6.4.13 Nouryon (Nyxas Holding)
- 6.4.14 Innospec Inc.
- 6.4.15 Flotek Industries Inc.
- 6.4.16 CES Energy Solutions Corp.
- 6.4.17 Ashland Global Holdings Inc.
- 6.4.18 Arkema SA
- 6.4.19 Stepan Company
- 6.4.20 Lamberti SpA
7 Market Opportunities & Future Outlook
- 7.1 White-space & Unmet-Need Assessment


