


 |
市場調查報告書
商品編碼
2113257
智慧公路:市場佔有率分析、產業趨勢與統計、成長預測(2026-2031)Smart Highway - Market Share Analysis, Industry Trends & Statistics, Growth Forecasts (2026 - 2031) |
||||||

※ 本網頁內容可能與最新版本有所差異。詳細情況請與我們聯繫。
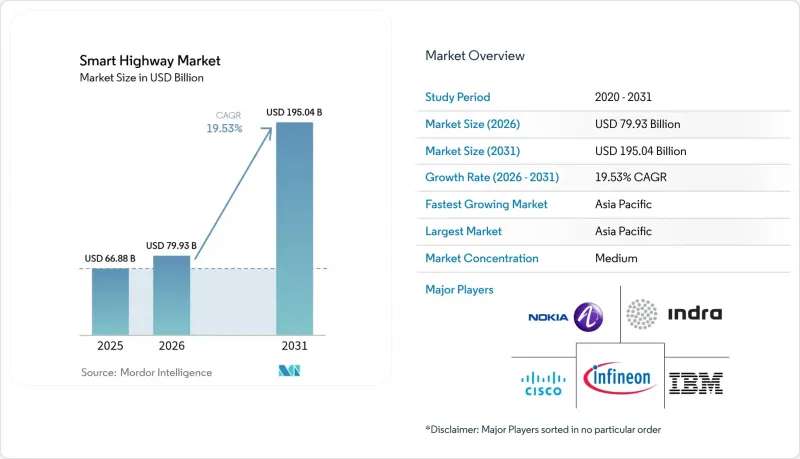
據 Mordor Intelligence 稱,2025 年智慧高速公路市值為 668.8 億美元,預計到 2031 年將達到 1950.4 億美元,而 2026 年為 799.3 億美元,預測期(2026-2031 年)的複合年成長率為 19.53%。
本報告按組件(硬體、軟體、服務)、產品技術(例如智慧交通管理系統)、應用(例如交通堵塞管理、安全和事故偵測)、部署模式(例如本地部署、雲端部署)、道路類型(例如高速公路、城市道路)和地區進行細分。市場預測以美元計價。
全球智慧公路市場趨勢與洞察
政府在智慧基礎設施方面的支出正在激增。
創紀錄的公共資金正支持多個多年期建設項目。 《基礎建設投資與就業法案》撥款1.2兆美元,其中75億美元用於累計全國充電走廊。同時,印度2025年預算包含287,333印度盧比(約345億美元)用於高速公路現代化改造。專項津貼計畫將資金與數位基礎設施里程碑的實現掛鉤,從而有效確保了先進感測、分析和車聯網(V2X)模組的採購。
交通壅塞成本日益增加
都市區壅塞目前正阻礙市政GDP成長,並使其無法實現減排目標,促使相關部門實施人工智慧驅動的自適應交通號誌控制系統。新加坡和倫敦的早期試點計畫已證明,該系統能夠縮短旅行時間並降低揮發性有機化合物排放,凸顯了城市到雲端交通遙測技術的經濟效益。
感測器/物聯網成本快速下降
雷達、LiDAR和視覺模組的單位成本下降速度超過了莫耳定律的預測,使得即使在次要公路和周邊公路上也能進行數位化升級。具備機載人工智慧推理功能的低功耗攝影機如今的價格已降至以往只有基礎型CCTV才能達到的水平,從而加速了每車道公里覆蓋範圍的擴大。
細分市場分析
到2025年,服務業將佔總收入的45.35%,這主要得益於政府依賴整合商將傳統資產與邊緣原生平台連接起來。一個諮詢團隊統籌監督變革管理項目,而託管服務合約則保證了全天候網路運作。軟體收入目前小規模,但正以18.32%的複合年成長率成長,這主要得益於基於訂閱的分析服務,這些服務透過交通元元資料實現盈利。硬體仍然至關重要,但正日益商品化。軟體定義路側單元(RSU)的出現使得無線(OTA)功能發布成為可能,而無需中斷土木工程施工。這種架構提高了生命週期投資報酬率,並有助於符合不斷發展的V2X標準。
智慧公路市場的營運商意識到,勞動密集的設計、施工和營運合約會將性能風險轉移給供應商。以結果為導向的服務等級合約利用數位孿生技術來反映道路負荷和訊號延誤情況,從而促進預測性維護,減少意外道路封閉。隨著採購部門將關注點轉向總體擁有成本 (TCO) 指標,服務聯盟預計將會整合,這一趨勢在過去十年雲端基礎設施外包領域已有所體現。
預計到2025年,智慧交通管理系統將佔總收入的37.45%,並繼續維持其作為地方政府試點計畫切入點的地位。人工智慧驅動的訊號相位控制、可變速度引導和路肩行駛等技術能夠顯著緩解交通堵塞,滿足通勤者監測機構的需求。通訊系統預計將以20.08%的複合年成長率成長,為新興的協同駕駛應用場景提供支援。邊緣雲網能夠處理聯網汽車與龍門架無線電之間小於10毫秒的握手,從而實現大規模車道併線的協調。
一項顯著的變化是引入了電腦視覺攝影機。這些攝影機透過動態調整解析度網格來追蹤高密度交通狀況,從而降低能耗。平台提供者正在將這些感測器與微服務相結合,為預測引擎提供訊息,使智慧高速公路市場從被動控制迴路向主動最佳化轉變。
區域分析
亞太地區佔全球銷售額的37.54%,預計2031年將以17.96%的複合年成長率成長。各國政府正將數位走廊定位為推動經濟重心從沿海特大城市轉移到內陸製造地的驅動力。在中國,近800個智慧城市示範計畫正在進行中,道路遙測技術正被整合到更廣泛的資料管治架構中。在印度,為確保智慧交通系統(ITS)的資金來源,政府正增加對智慧交通系統的預算投入,並發行多邊綠色債券。
歐洲佔33.18%的市場佔有率,並致力於推廣能夠實現跨境連續性的通用標準。英國的《互聯和自動化出行藍圖》撥款1億英鎊(1.26億美元)用於示範自動駕駛物流走廊,預計到2035年市場規模將達420億英鎊。斯堪地那維亞政府正透過整合智慧高速公路和綠氫燃料卡車服務區,並遵守「Fit-for-55」排放上限,將氣候政策轉化為採購影響力。
北美市場佔全球銷售額的29.28%,年複合成長率達14.78%。聯邦獎勵策略正在加速設計建造資金籌措模式的推廣,而各州交通部門則在推動強制使用開放API,以期為中型軟體供應商創造公平的競爭環境。在加拿大,一項試點計畫正在進行中,旨在瀝青路面下方部署數位孿生技術,以模擬凍融循環造成的應力。在墨西哥,智慧交通系統(ITS)的實施正與收費公路沿線的光纖專案權相結合,從而實現資本支出的互惠補貼。預計到2031年,北美智慧公路市場規模將達到447.8億美元。
其他好處:
- Excel格式的市場預測(ME)表
- 3個月的分析師支持
目錄
第1章:引言
- 研究假設和市場定義
- 調查範圍
第2章:調查方法
第3章執行摘要
第4章 市場狀況
- 市場概覽
- 市場促進因素
- 政府在智慧基礎設施方面的支出正在激增。
- 交通堵塞導致成本增加
- 道路交通安全的強制規定
- 降低快速感測器/物聯網的成本
- 在與C-AV(組合飛機)相容的新走廊中進行的試點項目
- 動態公路電動車充電試點項目
- 市場限制因素
- 大筆資本投入和較長的投資回收期
- 資料隱私與網路安全風險
- 機構間互通性差距
- PPP採購延誤
- 產業價值鏈分析
- 技術展望
- 監理情勢
- 產業相關人員分析
- 近期重大案例研究
- 投資分析
- 波特五力模型
第5章 市場規模與成長預測
- 按組件
- 硬體
- 軟體
- 服務
- 透過產品技術
- 智慧交通管理系統
- 智慧交通管理系統
- 監控系統
- 通訊系統
- 照明和能源系統
- 其他
- 透過使用
- 交通堵塞管理
- 安全與事故偵測
- 智慧停車
- 收費站
- 排放氣體監測
- 支援聯網汽車和自動駕駛汽車
- 其他
- 按安裝模式
- 現場
- 基於雲端的
- 混合
- 按道路類型
- 主幹道
- 城市道路
- 高速公路
- 按地區
- 北美洲
- 美國
- 加拿大
- 墨西哥
- 南美洲
- 巴西
- 阿根廷
- 其他南美國家
- 歐洲
- 德國
- 英國
- 法國
- 義大利
- 西班牙
- 其他歐洲國家
- 亞太地區
- 中國
- 日本
- 印度
- 韓國
- 其他亞太國家
- 中東和非洲
- 中東
- 沙烏地阿拉伯
- 阿拉伯聯合大公國
- 其他中東國家
- 非洲
- 南非
- 奈及利亞
- 其他非洲國家
- 中東
- 北美洲
第6章 競爭情勢
- 市場集中度
- 策略趨勢
- 市佔率分析
- 公司簡介
- Alcatel-Lucent Enterprise(Nokia)
- Cisco Systems Inc.
- IBM Corporation
- Indra Sistemas SA
- Infineon Technologies AG
- Huawei Technologies Co. Ltd
- Kapsch TrafficCom AG
- LG CNS Co. Ltd
- Schneider Electric SE
- Siemens AG
- Xerox Holdings Corporation
- Thales Group
- Iteris Inc.
- Cubic Transportation Systems
- SWARCO AG
- TransCore(Roper Tech.)
- Econolite Group Inc.
- TomTom NV
- Conduent Inc.
- Continental AG
- FLIR Systems Inc.
- PTC Inc.
第7章 市場機會與未來展望
According to Mordor Intelligence, the smart highway market size was valued at USD 66.88 billion in 2025 and estimated to grow from USD 79.93 billion in 2026 to reach USD 195.04 billion by 2031, at a CAGR of 19.53% during the forecast period (2026-2031).
This report is Segmented by Component (Hardware, Software, and Services), Product Technology (Smart Transport Management, and More), Application (Traffic Congestion Management, Safety and Incident Detection, and More), Deployment Model (On-Premise, Cloud-Based, and More), Road Type (Highway, Urban Road, and More) and by Geography. The Market Forecasts are Provided in Terms of Value (USD).
Global Smart Highway Market Trends and Insights
Government smart-infrastructure spending surge
Record-level public appropriations are underwriting multi-year construction pipelines. The Infrastructure Investment and Jobs Act allocates USD 1.2 trillion, including a USD 7.5 billion carve-out for nationwide charging corridors, while India's 2025 budget channels INR 2,87,333 crore (USD 34.5 billion) toward highway modernisation. Dedicated grant programs tie funds to digital-infrastructure milestones, which effectively guarantee procurement for advanced sensing, analytics, and V2X modules.
Growing traffic-congestion costs
Urban congestion now erodes municipal GDP growth and undermines emissions targets, pressing authorities to deploy AI-directed adaptive signalling. Early deployments in Singapore and London showed measurable travel-time reductions and volatile-organic-compound declines, reinforcing the economic case for city-to-cloud traffic telemetry.
Rapid sensor / IoT cost decline
Unit prices for radar, lidar, and vision modules have fallen faster than Moore's Law projections, opening secondary corridors and peri-urban arterials to digital upgrades. Low-power cameras with on-board AI inference now ship at price points once reserved for basic CCTV, accelerating total lane-kilometre coverage.
Other drivers and restraints analyzed in the detailed report include:
- Mandatory road-safety regulations
- High capex and long payback
- Data-privacy and cyber-security risks
For complete list of drivers and restraints, kindly check the Table Of Contents.
Segment Analysis
Services held 45.35% revenue share in 2025 as governments relied on integrators to dovetail legacy assets with edge-native platforms. Advisory teams orchestrate change-management programs, while managed-service contracts guarantee round-the-clock network uptime. Software revenue is smaller today yet grows at an 18.32% CAGR, propelled by subscription-based analytics that monetise traffic metadata. Hardware remains essential but is increasingly commoditised; the arrival of software-defined roadside units enables over-the-air feature releases without civil-works disruption. This architecture boosts lifetime ROI and eases compliance with evolving V2X standards.
Smart highway market operators recognise that labour-intensive design-build-operate contracts transfer performance risk to vendors. Outcome-oriented service-level agreements encourage predictive maintenance driven by digital twins that mirror pavement stress and signal latency, lowering unplanned closures. As procurement offices pivot toward total-cost-of-ownership metrics, service consortia are likely to consolidate, echoing trends seen in cloud-infra outsourcing during the prior decade.
Smart traffic management systems account for 37.45% of 2025 revenue and remain the entry point for municipal pilots. AI-guided signal phasing, variable-speed advisories, and hard-shoulder running demonstrate visible congestion relief that satisfies commuter watchdogs. Communication systems, projected to expand at 20.08% CAGR, underpin emerging cooperative-driving use cases. The edge-cloud mesh handles sub-ten-millisecond handshakes between connected vehicles and gantry radios, enabling lane-merge orchestration at scale.
A notable shift is the infusion of computer-vision cameras that dynamically adjust resolution grids to cut energy draw while tracking dense traffic scenes. Platform suppliers bundle these sensors with microservices that feed predictive engines, moving the smart highway market beyond reactive control loops to anticipatory optimisation.
Complete Report Scope:
- By Component
- Hardware
- Software
- Services
- By Product Technology
- Smart Traffic Management Systems
- Smart Transport Management Systems
- Monitoring Systems
- Communication Systems
- Lighting and Energy Systems
- Other Technologies
- By Application
- Traffic Congestion Management
- Safety and Incident Detection
- Smart Parking
- Toll Collection
- Emission Monitoring
- Connected and Autonomous Vehicle Support
- Other Applications
- By Deployment Model
- On-premise
- Cloud-based
- Hybrid
- By Road Type
- Highway
- Urban Road
- Expressway
- By Geography
- North America
- United States
- Canada
- Mexico
- South America
- Brazil
- Argentina
- Rest of South America
- Europe
- Germany
- United Kingdom
- France
- Italy
- Spain
- Rest of Europe
- Asia-Pacific
- China
- Japan
- India
- South Korea
- Rest of Asia-Pacific
- Middle East and Africa
- Middle East
- Saudi Arabia
- United Arab Emirates
- Rest of Middle East
- Africa
- South Africa
- Nigeria
- Rest of Africa
- Middle East
- North America
Geography Analysis
Asia-Pacific secures 37.54% revenue and expands at an 17.96% CAGR through 2031. National governments position digital corridors as engines for economic rebalancing from coastal megacities to interior manufacturing hubs. China's rollout of nearly 800 smart-city pilots embeds roadway telemetry in wider data-governance frameworks.India deepens budget-line allocations, helped by multi-lateral green-bond issuances that ring-fence funds for ITS.
Europe commands 33.18% share and champions common standards that enable cross-border continuity. The UK's Connected and Automated Mobility roadmap assigns GBP 100 million (USD 126 million) to prove self-driving logistics corridors, projecting a GBP 42 billion market by 2035.Scandinavian administrations integrate smart highways with green-hydrogen truck stops to align with Fit-for-55 emissions ceilings, turning climate policy into procurement leverage.
North America holds 29.28% revenue and grows at 14.78% CAGR. Federal stimulus accelerates design-build finance models, while state DOTs embrace open-application-programming-interface mandates that level the playing field for mid-sized software vendors. Canada pilots digital-twin sub-layers beneath resurfaced asphalt to model freeze-thaw stress, and Mexico bundles ITS rollouts with fibre concessions along tollways to cross-subsidise capital outlays. The smart highway market size in North America is slated to reach USD 44.78 billion by 2031.
- Alcatel-Lucent Enterprise (Nokia)
- Cisco Systems Inc.
- IBM Corporation
- Indra Sistemas SA
- Infineon Technologies AG
- Huawei Technologies Co. Ltd
- Kapsch TrafficCom AG
- LG CNS Co. Ltd
- Schneider Electric SE
- Siemens AG
- Xerox Holdings Corporation
- Thales Group
- Iteris Inc.
- Cubic Transportation Systems
- SWARCO AG
- TransCore (Roper Tech.)
- Econolite Group Inc.
- TomTom N.V.
- Conduent Inc.
- Continental AG
- FLIR Systems Inc.
- PTC Inc.
Additional Benefits:
- The market estimate (ME) sheet in Excel format
- 3 months of analyst support
TABLE OF CONTENTS
1 INTRODUCTION
- 1.1 Study Assumptions and Market Definition
- 1.2 Scope of the Study
2 RESEARCH METHODOLOGY
3 EXECUTIVE SUMMARY
4 MARKET LANDSCAPE
- 4.1 Market Overview
- 4.2 Market Drivers
- 4.2.1 Government smart-infrastructure spending surge
- 4.2.2 Growing traffic-congestion costs
- 4.2.3 Mandatory road-safety regulations
- 4.2.4 Rapid sensor/IoT cost decline
- 4.2.5 Emerging C-AV ready corridor pilots
- 4.2.6 Dynamic in-road EV-charging pilots
- 4.3 Market Restraints
- 4.3.1 High capex and long payback
- 4.3.2 Data-privacy and cyber-security risks
- 4.3.3 Inter-agency interoperability gaps
- 4.3.4 PPP procurement delays
- 4.4 Industry Value Chain Analysis
- 4.5 Technological Outlook
- 4.6 Regulatory Landscape
- 4.7 Industry Stakeholder Analysis
- 4.8 Key Recent Case Studies
- 4.9 Investment Analysis
- 4.10 Porter's Five Forces
- 4.10.1 Threat of New Entrants
- 4.10.2 Bargaining Power of Buyers
- 4.10.3 Bargaining Power of Suppliers
- 4.10.4 Threat of Substitutes
- 4.10.5 Competitive Rivalry
5 MARKET SIZE AND GROWTH FORECASTS (VALUE)
- 5.1 By Component
- 5.1.1 Hardware
- 5.1.2 Software
- 5.1.3 Services
- 5.2 By Product Technology
- 5.2.1 Smart Traffic Management Systems
- 5.2.2 Smart Transport Management Systems
- 5.2.3 Monitoring Systems
- 5.2.4 Communication Systems
- 5.2.5 Lighting and Energy Systems
- 5.2.6 Other Technologies
- 5.3 By Application
- 5.3.1 Traffic Congestion Management
- 5.3.2 Safety and Incident Detection
- 5.3.3 Smart Parking
- 5.3.4 Toll Collection
- 5.3.5 Emission Monitoring
- 5.3.6 Connected and Autonomous Vehicle Support
- 5.3.7 Other Applications
- 5.4 By Deployment Model
- 5.4.1 On-premise
- 5.4.2 Cloud-based
- 5.4.3 Hybrid
- 5.5 By Road Type
- 5.5.1 Highway
- 5.5.2 Urban Road
- 5.5.3 Expressway
- 5.6 By Geography
- 5.6.1 North America
- 5.6.1.1 United States
- 5.6.1.2 Canada
- 5.6.1.3 Mexico
- 5.6.2 South America
- 5.6.2.1 Brazil
- 5.6.2.2 Argentina
- 5.6.2.3 Rest of South America
- 5.6.3 Europe
- 5.6.3.1 Germany
- 5.6.3.2 United Kingdom
- 5.6.3.3 France
- 5.6.3.4 Italy
- 5.6.3.5 Spain
- 5.6.3.6 Rest of Europe
- 5.6.4 Asia-Pacific
- 5.6.4.1 China
- 5.6.4.2 Japan
- 5.6.4.3 India
- 5.6.4.4 South Korea
- 5.6.4.5 Rest of Asia-Pacific
- 5.6.5 Middle East and Africa
- 5.6.5.1 Middle East
- 5.6.5.1.1 Saudi Arabia
- 5.6.5.1.2 United Arab Emirates
- 5.6.5.1.3 Rest of Middle East
- 5.6.5.2 Africa
- 5.6.5.2.1 South Africa
- 5.6.5.2.2 Nigeria
- 5.6.5.2.3 Rest of Africa
- 5.6.5.1 Middle East
- 5.6.1 North America
6 COMPETITIVE LANDSCAPE
- 6.1 Market Concentration
- 6.2 Strategic Moves
- 6.3 Market Share Analysis
- 6.4 Company Profiles (includes Global level Overview, Market level overview, Core Segments, Financials as available, Strategic Information, Market Rank/Share for key companies, Products and Services, Recent Developments)
- 6.4.1 Alcatel-Lucent Enterprise (Nokia)
- 6.4.2 Cisco Systems Inc.
- 6.4.3 IBM Corporation
- 6.4.4 Indra Sistemas SA
- 6.4.5 Infineon Technologies AG
- 6.4.6 Huawei Technologies Co. Ltd
- 6.4.7 Kapsch TrafficCom AG
- 6.4.8 LG CNS Co. Ltd
- 6.4.9 Schneider Electric SE
- 6.4.10 Siemens AG
- 6.4.11 Xerox Holdings Corporation
- 6.4.12 Thales Group
- 6.4.13 Iteris Inc.
- 6.4.14 Cubic Transportation Systems
- 6.4.15 SWARCO AG
- 6.4.16 TransCore (Roper Tech.)
- 6.4.17 Econolite Group Inc.
- 6.4.18 TomTom N.V.
- 6.4.19 Conduent Inc.
- 6.4.20 Continental AG
- 6.4.21 FLIR Systems Inc.
- 6.4.22 PTC Inc.
7 MARKET OPPORTUNITIES AND FUTURE OUTLOOK
- 7.1 White-space and Unmet-Need Assessment

 智慧公路市場:按組件、連接方式、安裝方式、道路類型、部署模式、應用和最終用戶分類-2026-2032年全球市場預測
 智慧公路管理市場預測至2034年—全球解決方案、技術、部署模式、道路類型、應用、最終用戶和區域分析
 太陽能智慧高速公路市場分析及Solar-Powered:按類型、產品、服務、技術、組件、應用、最終用戶、功能及安裝類型分類
 智慧公路市場報告:按組件、部署模式、技術和地區分類,2026-2034 年
 2026年全球智慧高速公路市場報告
 智慧高速公路市場:按組件、部署模式、技術和區域分類
 智慧高速公路市場-全球產業規模、佔有率、趨勢、機會、預測(按技術、組件、地區和競爭格局分類),2021-2031年
 智慧高速公路市場規模、佔有率和成長分析(按組件、技術、顯示、部署類型、服務和地區分類)-2026-2033年產業預測
 全球智慧高速公路市場:2025 年至 2030 年預測2030 年智慧高速公路市場預測:按類型、技術、服務、部署類型、應用和地區進行的全球分析