


 |
市場調查報告書
商品編碼
2100768
UI/UX:市場佔有率分析、行業趨勢和統計數據、成長預測(2026-2031 年)UI/UX - Market Share Analysis, Industry Trends & Statistics, Growth Forecasts (2026 - 2031) |
||||||

※ 本網頁內容可能與最新版本有所差異。詳細情況請與我們聯繫。
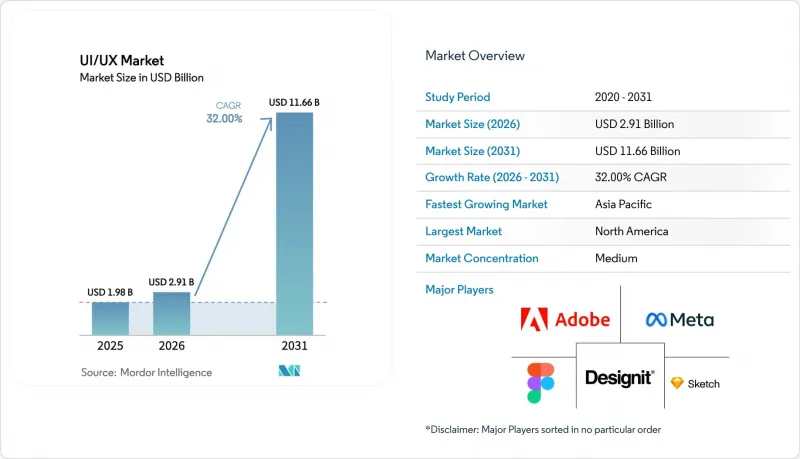
預計到 2025 年,UI/UX 市場將達到 19.8 億美元,到 2026 年將達到 29.1 億美元,到 2031 年將達到 116.6 億美元,2026 年至 2031 年的複合年成長率為 32%。
本報告按部署模式(雲端部署和本地部署)、組織規模(大型企業、中型企業、中小企業和微企業)、最終用戶行業(電子商務和零售、醫療保健和生命科學、銀行、金融服務和保險等)、平台(行動應用程式等)以及地區進行細分。市場預測以美元(USD)為單位。
全球使用者介面/使用者體驗市場趨勢與洞察
數位轉型(DX)計劃的推廣
預計到2025年,數位轉型預算將達到營收的7.5%,德勤認為這是客戶體驗領導企業和落後者之間的分水嶺。根據Forrester預測,同年技術支出將成長4.6%,91%的公司表示計劃在2026年增加數位化支出。因此,使用者介面/使用者體驗平台已從可選項轉變為納入多年發展藍圖的必要支出項目。推遲投資的公司可能會面臨客戶體驗在網頁、行動和語音端割裂的風險,從而損害客戶價值。
行動商務的快速普及
預計到2025年,東南亞電子商務商品總值將達到1,850億美元,其中視訊商務交易佔25%,平均訂單金額約為6-7美元。行動優先的消費者推動視覺搜尋年增70%,62%的受訪者表示人工智慧建議影響了他們的購買決策。設計團隊現在不再只專注於桌面佈局的調整,而是致力於最佳化拇指區域的導航和對話式結帳流程,從而將行動用戶體驗轉變為主要的收入來源。
熟練的UI/UX人員短缺
根據英國Experis公司的報告,到2025年,76%的公司將面臨招募UI/UX專業人才的難題,而德國的這一比例在短短一年內就從28%飆升至61%。 Autodesk也指出了類似的人才短缺問題,58%的公司認為這是阻礙成長的一大障礙。教育課程與產業需求的不匹配迫使企業要麼從其他公司挖走稀缺的專業人才,要麼對現有員工進行相關領域的再培訓,這導致設計系統的應用推廣受阻,並減緩了UI/UX市場的成長。
細分市場分析
預計到2025年,雲端解決方案將佔據UI/UX市場68.19%的佔有率,並以每年32.98%的速度成長至2031年。金融科技公司Ramp的Figma採用率高達93%,顯示同步編輯和即時交付給開發人員等功能正在推動用戶對基於瀏覽器的平台的偏好。雖然在國防、醫療保健和監管嚴格的金融領域,本地部署系統仍然存在,但將小型資料庫與雲端協作相結合的混合方法正在為全面轉型奠定基礎。
支援 API 的設計令牌和自動化輔助功能檢查正在縮短發布週期,而桌面工具仍然需要手動檔案傳輸,這可能導致錯誤。供應商正逐步淘汰永久許可,轉向雲端訂閱模式,監管機構也開始接受經過認證的雲端安全方案,導致剩餘的本地基礎設施逐漸萎縮。未能實現線上轉型的公司將面臨迭代延遲和競爭力下降,而這一現實正在重塑整個 UI/UX 市場的採購策略。
到2025年,大型企業將佔據44.33%的銷售額,這得益於其專業的營運團隊和批量折扣。同時,由於無需編寫前端程式碼即可輕鬆上手,小規模微企業預計將以32.56%的年成長率成長。美國商會的一項調查顯示,到2025年,58%的小型企業將使用生成式人工智慧;加拿大獨立企業聯合會(CFIB)的報告也指出,44%的小型企業已經採用了人工智慧技術。
中型企業面臨定價困境:它們規模夠大,需要高階功能,但又不夠大,無法享受企業級收費系統。英國數位轉型工作小組指出,成本、技能和整合是主要障礙。提供根據成熟度分級費率方案的供應商能夠贏得眾多客戶的青睞,而統一的企業級定價模式則可能錯失UI/UX市場中快速成長的中小型企業客戶群。
區域分析
預計到2025年,北美將佔全球收入的38.98%,這主要得益於DesignOps的早期應用、基於WCAG(Web內容無障礙指南)的預算以及矽谷和紐約創業投資資金的集中。 91%的公司計劃在2026年增加其數位化預算,並將客戶經驗(CX)列為三大優先事項之一。加州和紐約州的州法律已有效地制定了全國性的無障礙標準,推動了廣泛的網站重新設計。
亞太地區在3,000億美元的數位經濟規模和人工智慧技能普及率高達79%的勞動力的支撐下,預計到2031年將以33.01%的複合年成長率持續成長。全部區域預計到2025年上半年將獲得80億美元的資金籌措,資料中心容量預計將成長180%,從而支援人工智慧密集型設計工作流程。各國的具體促進因素包括中國強大的本地工具生態系統、日本對汽車人機互動(HMI)的重視以及印度以出口為導向的IT服務。供應商需要對語言、定價和雲端整合進行在地化,才能抓住使用者介面/使用者體驗(UI/UX)市場的機會。
歐洲嚴格的隱私和無障礙法規迫使企業轉型採用符合GDPR要求的在地化設計系統。德國、法國、英國、義大利和西班牙在這方面投入領先,而北歐和比荷盧經濟聯盟的中小企業正在迅速採用無程式碼工具來建立政府入口網站。南美、中東和非洲仍處於起步階段,但金融科技、智慧城市和行動支付領域的先導計畫正在不斷增加。隨著基礎設施的完善,預計這些地區在整體UI/UX市場中的佔有率將逐步擴大,但北美和歐洲仍可能在創新方面保持主導。
其他好處:
- Excel格式的市場預測(ME)表
- 3個月的分析師支持
目錄
第1章:引言
- 研究假設和市場定義
- 調查範圍
第2章:調查方法
第3章執行摘要
第4章 市場狀況
- 市場概覽
- 市場促進因素
- 數位轉型(DX)計劃的推廣
- 行動商務的快速擴張
- 專注於企業的客戶體驗關鍵績效指標 (CX KPI) 和淨推薦值 (NPS)。
- 根據無障礙法規(WCAG 3.0)進行強制性重新設計
- 為支持多品牌,設計代幣的標準化實現了擴充性
- 適用於低延遲設備的邊緣渲染使用者介面
- 市場限制因素
- 熟練的UI/UX專業人員短缺
- 使用高級工具套件的成本很高
- 人工智慧產生的使用者體驗中存在的演算法偏見風險
- AR/VR 與傳統工具之間互通性的差距。
- 產業價值鏈分析
- 監理情勢
- 技術展望
- 宏觀經濟因素對市場的影響
- 波特五力分析
第5章 市場規模與成長預測
- 按部署模式
- 基於雲端的
- 現場
- 按組織規模
- 大公司
- 中型公司
- 小規模和微企業
- 產業最終用途
- 電子商務與零售
- 醫療保健和生命科學
- 銀行業、金融服務業及保險業
- 教育及教育科技
- IT/通訊
- 媒體與娛樂
- 政府/公共部門
- 其他終端用戶產業
- 按平台
- 行動應用
- Web應用程式
- 桌面軟體
- 語音和對話介面
- AR/VR 和空間介面
- 汽車和物聯網顯示器
- 按地區
- 北美洲
- 美國
- 加拿大
- 墨西哥
- 南美洲
- 巴西
- 阿根廷
- 智利
- 其他南美國家
- 歐洲
- 德國
- 法國
- 英國
- 俄羅斯
- 義大利
- 西班牙
- 其他歐洲國家
- 亞太地區
- 中國
- 日本
- 印度
- 韓國
- 澳洲和紐西蘭
- 其他亞太國家
- 中東
- 沙烏地阿拉伯
- 阿拉伯聯合大公國
- 土耳其
- 其他中東國家
- 非洲
- 南非
- 奈及利亞
- 肯亞
- 其他非洲國家
- 北美洲
第6章 競爭情勢
- 市場集中度
- 策略趨勢
- 市佔率分析
- 公司簡介
- Adobe Inc.
- Figma, Inc.
- Sketch BV
- InVisionApp, Inc.
- Axure Software Solutions Inc.
- Balsamiq Studios LLC
- Proto.io Inc.
- UXPin Inc.
- Justinmind Inc.
- International Business Machines Corporation
- Oracle Corporation
- SAP SE
- Microsoft Corporation
- Google LLC
- Meta Platforms, Inc.
- Apple Inc.
- Atlassian Corporation Plc
- Designit A/S
- IDEO LP
- Ramotion LLC
- UX Studio Zrt.
- Nielsen Norman Group Inc.
- HCL Technologies Limited
- Cognizant Technology Solutions Corporation
- Zeplin Inc.
- Maze Design, Inc.
第7章 市場機會與未來展望
According to Mordor Intelligence, the UI/UX market size is projected to be USD 1.98 billion in 2025, USD 2.91 billion in 2026, and reach USD 11.66 billion by 2031, growing at a CAGR of 32% from 2026 to 2031.
This report is Segmented by Deployment Model (Cloud-Based, and On-Premises), Organization Size (Large Enterprises, Mid-Sized Enterprises, and Small and Micro Enterprises), End-Use Industry (E-Commerce and Retail, Healthcare and Life Sciences, Banking Financial Services and Insurance, and More), Platform (Mobile Applications, and More), and Geography. The Market Forecasts are Provided in Terms of Value (USD).
Global UI/UX Market Trends and Insights
Proliferation of Digital-Transformation Programs
Digital-transformation budgets climbed to 7.5% of revenue in 2025, a level Deloitte identified as the breakpoint between CX leaders and laggards. Technology outlays grew 4.6% that year, and 91% of enterprises intend to raise digital spending in 2026, according to Forrester. UI/UX platforms have therefore shifted from discretionary purchases to essential line items locked into multi-year roadmaps. Firms delaying investment risk fragmented web, mobile, and voice journeys that erode customer value gains.
Surge in Mobile-Commerce Adoption
Southeast Asia's e-commerce gross merchandise value reached USD 185 billion in 2025, with video commerce delivering 25% of transactions and average order values near USD 6-7. Mobile-first consumers drove 70% year-over-year growth in visual search, and 62% reported that AI recommendations shaped purchasing choices. Design teams now optimize thumb-zone navigation and conversational checkouts rather than resizing desktop layouts, turning mobile UX into the primary revenue interface.
Shortage of Skilled UI/UX Talent
Experis UK reported that 76% of firms struggled to fill UI/UX roles in 2025, and Germany's gap jumped from 28% to 61% in one year. Autodesk noted a parallel rise in talent scarcity, with 58% of companies citing the shortage as a growth barrier. The mismatch between academic curricula and industry demand forces enterprises to poach scarce specialists or retrain adjacent staff, delaying design-system rollouts and slowing the UI/UX market.
Other drivers and restraints analyzed in the detailed report include:
- Enterprise Focus on CX KPIs and NPS
- Accessibility Legislation (WCAG 3.0) Redesign Mandates
- High Subscription Cost of Premium Tool Suites
For complete list of drivers and restraints, kindly check the Table Of Contents.
Segment Analysis
Cloud solutions commanded 68.19% UI/UX market share in 2025 and are growing at 32.98% through 2031. Figma recorded 93% adoption at Ramp, a fintech firm, demonstrating that synchronous editing and instant developer handoff drive preference for browser-based platforms. On-premises systems persist in defense, healthcare, and regulated finance, yet hybrid approaches that sync local storage with cloud collaboration are stepping-stones to full migration.
API-enabled design tokens and automated accessibility checks shorten release cycles, while desktop tools require manual file transfers that introduce errors. Vendors are phasing out perpetual licenses in favour of cloud subscriptions, and regulators now accept certified cloud security, eroding the remaining on-premises foothold. Enterprises staying offline face slower iteration and diminished competitiveness, a reality reshaping procurement policy across the UI/UX market.
Large Enterprises held 44.33% revenue in 2025, leveraging dedicated design-ops teams and volume discounts. Small and Micro Enterprises, however, are set to grow 32.56% annually thanks to no-code builders that remove front-end coding hurdles. The U.S. Chamber of Commerce found that 58% of small businesses used generative AI in 2025, while Canada's CFIB reported 44% AI adoption among SMBs.
Mid-Sized Enterprises face a pricing squeeze: big enough to need advanced features yet too small for enterprise rates. The UK Digital Adoption Taskforce highlighted cost, skills, and integration as central barriers. Vendors offering tiered plans that align to maturity stages can win across the spectrum, whereas flat enterprise pricing risks ceding the fast-growing SMB slice of the UI/UX market.
Complete Report Scope:
- By Deployment Model
- Cloud-Based
- On-Premises
- By Organization Size
- Large Enterprises
- Mid-Sized Enterprises
- Small and Micro Enterprises
- By End-Use Industry
- E-Commerce and Retail
- Healthcare and Life Sciences
- Banking, Financial Services and Insurance
- Education and EdTech
- IT and Telecom
- Media and Entertainment
- Government and Public Sector
- Other End-Use Industries
- By Platform
- Mobile Applications
- Web Applications
- Desktop Software
- Voice and Conversational Interfaces
- AR/VR and Spatial Interfaces
- Automotive and IoT Displays
- By Geography
- North America
- United States
- Canada
- Mexico
- South America
- Brazil
- Argentina
- Chile
- Rest of South America
- Europe
- Germany
- France
- United Kingdom
- Russia
- Italy
- Spain
- Rest of Europe
- Asia-Pacific
- China
- Japan
- India
- South Korea
- Australia and New Zealand
- Rest of Asia-Pacific
- Middle East
- Saudi Arabia
- United Arab Emirates
- Turkey
- Rest of Middle East
- Africa
- South Africa
- Nigeria
- Kenya
- Rest of Africa
- North America
Geography Analysis
North America generated 38.98% of 2025 revenue, anchored by early design-ops adoption, WCAG-driven budgets, and venture funding that clusters around Silicon Valley and New York. Ninety-one percent of enterprises plan higher digital budgets in 2026, ranking CX among the top three priorities. State mandates in California and New York effectively set nationwide accessibility benchmarks, prompting widespread redesign.
Asia-Pacific is expanding at a 33.01% CAGR through 2031, buoyed by a USD 300 billion digital economy and a workforce with 79% AI skill penetration. Regional funding reached USD 8 billion in H1 2025, and data-center capacity is set to rise 180%, supporting AI-heavy design workflows. Country-specific drivers China's domestic tool ecosystem, Japan's automotive HMI focus, India's export-oriented IT services require vendors to localize language, pricing, and cloud integration to capture UI/UX market opportunities.
Europe's strict privacy and accessibility rules push companies toward localized design systems that bake in GDPR compliance. Germany, France, the UK, Italy, and Spain head spending, while the Nordics and Benelux see fast SMB uptake of no-code tools for government portals. South America, the Middle East, and Africa remain early-stage but are adding pilots in fintech, smart cities, and mobile money. As infrastructure improves, these regions will edge up in total UI/UX market share, although North America and Europe will retain innovation leadership.
- Adobe Inc.
- Figma, Inc.
- Sketch B.V.
- InVisionApp, Inc.
- Axure Software Solutions Inc.
- Balsamiq Studios LLC
- Proto.io Inc.
- UXPin Inc.
- Justinmind Inc.
- International Business Machines Corporation
- Oracle Corporation
- SAP SE
- Microsoft Corporation
- Google LLC
- Meta Platforms, Inc.
- Apple Inc.
- Atlassian Corporation Plc
- Designit A/S
- IDEO LP
- Ramotion LLC
- UX Studio Zrt.
- Nielsen Norman Group Inc.
- HCL Technologies Limited
- Cognizant Technology Solutions Corporation
- Zeplin Inc.
- Maze Design, Inc.
Additional Benefits:
- The market estimate (ME) sheet in Excel format
- 3 months of analyst support
TABLE OF CONTENTS
1 INTRODUCTION
- 1.1 Study Assumptions and Market Definition
- 1.2 Scope of the Study
2 RESEARCH METHODOLOGY
3 EXECUTIVE SUMMARY
4 MARKET LANDSCAPE
- 4.1 Market Overview
- 4.2 Market Drivers
- 4.2.1 Proliferation of Digital-Transformation Programs
- 4.2.2 Surge in Mobile-Commerce Adoption
- 4.2.3 Enterprise Focus on CX KPIs and NPS
- 4.2.4 Accessibility Legislation (WCAG 3.0) Redesign Mandates
- 4.2.5 Design Tokens Standardization for Multi-Brand Scalability
- 4.2.6 Edge-Rendered UI for Low-Latency Devices
- 4.3 Market Restraints
- 4.3.1 Shortage of Skilled UI/UX Talent
- 4.3.2 High Subscription Cost of Premium Tool Suites
- 4.3.3 Algorithmic Bias Risks in AI-Generated UX
- 4.3.4 Interoperability Gaps Across AR/VR and Classic Tooling
- 4.4 Industry Value-Chain Analysis
- 4.5 Regulatory Landscape
- 4.6 Technological Outlook
- 4.7 Impact of Macroeconomic Factors on the Market
- 4.8 Porter's Five Forces Analysis
- 4.8.1 Bargaining Power of Suppliers
- 4.8.2 Bargaining Power of Buyers
- 4.8.3 Threat of New Entrants
- 4.8.4 Threat of Substitutes
- 4.8.5 Competitive Rivalry
5 MARKET SIZE AND GROWTH FORECASTS (VALUE)
- 5.1 By Deployment Model
- 5.1.1 Cloud-Based
- 5.1.2 On-Premises
- 5.2 By Organization Size
- 5.2.1 Large Enterprises
- 5.2.2 Mid-Sized Enterprises
- 5.2.3 Small and Micro Enterprises
- 5.3 By End-Use Industry
- 5.3.1 E-Commerce and Retail
- 5.3.2 Healthcare and Life Sciences
- 5.3.3 Banking, Financial Services and Insurance
- 5.3.4 Education and EdTech
- 5.3.5 IT and Telecom
- 5.3.6 Media and Entertainment
- 5.3.7 Government and Public Sector
- 5.3.8 Other End-Use Industries
- 5.4 By Platform
- 5.4.1 Mobile Applications
- 5.4.2 Web Applications
- 5.4.3 Desktop Software
- 5.4.4 Voice and Conversational Interfaces
- 5.4.5 AR/VR and Spatial Interfaces
- 5.4.6 Automotive and IoT Displays
- 5.5 By Geography
- 5.5.1 North America
- 5.5.1.1 United States
- 5.5.1.2 Canada
- 5.5.1.3 Mexico
- 5.5.2 South America
- 5.5.2.1 Brazil
- 5.5.2.2 Argentina
- 5.5.2.3 Chile
- 5.5.2.4 Rest of South America
- 5.5.3 Europe
- 5.5.3.1 Germany
- 5.5.3.2 France
- 5.5.3.3 United Kingdom
- 5.5.3.4 Russia
- 5.5.3.5 Italy
- 5.5.3.6 Spain
- 5.5.3.7 Rest of Europe
- 5.5.4 Asia-Pacific
- 5.5.4.1 China
- 5.5.4.2 Japan
- 5.5.4.3 India
- 5.5.4.4 South Korea
- 5.5.4.5 Australia and New Zealand
- 5.5.4.6 Rest of Asia-Pacific
- 5.5.5 Middle East
- 5.5.5.1 Saudi Arabia
- 5.5.5.2 United Arab Emirates
- 5.5.5.3 Turkey
- 5.5.5.4 Rest of Middle East
- 5.5.6 Africa
- 5.5.6.1 South Africa
- 5.5.6.2 Nigeria
- 5.5.6.3 Kenya
- 5.5.6.4 Rest of Africa
- 5.5.1 North America
6 COMPETITIVE LANDSCAPE
- 6.1 Market Concentration
- 6.2 Strategic Moves
- 6.3 Market Share Analysis
- 6.4 Company Profiles (includes Global Level Overview, Market Level Overview, Core Segments, Financials as available, Strategic Information, Market Rank/Share, Products and Services, Recent Developments)
- 6.4.1 Adobe Inc.
- 6.4.2 Figma, Inc.
- 6.4.3 Sketch B.V.
- 6.4.4 InVisionApp, Inc.
- 6.4.5 Axure Software Solutions Inc.
- 6.4.6 Balsamiq Studios LLC
- 6.4.7 Proto.io Inc.
- 6.4.8 UXPin Inc.
- 6.4.9 Justinmind Inc.
- 6.4.10 International Business Machines Corporation
- 6.4.11 Oracle Corporation
- 6.4.12 SAP SE
- 6.4.13 Microsoft Corporation
- 6.4.14 Google LLC
- 6.4.15 Meta Platforms, Inc.
- 6.4.16 Apple Inc.
- 6.4.17 Atlassian Corporation Plc
- 6.4.18 Designit A/S
- 6.4.19 IDEO LP
- 6.4.20 Ramotion LLC
- 6.4.21 UX Studio Zrt.
- 6.4.22 Nielsen Norman Group Inc.
- 6.4.23 HCL Technologies Limited
- 6.4.24 Cognizant Technology Solutions Corporation
- 6.4.25 Zeplin Inc.
- 6.4.26 Maze Design, Inc.
7 MARKET OPPORTUNITIES AND FUTURE OUTLOOK
- 7.1 White-Space and Unmet-Need Assessment
