


 |
市場調查報告書
商品編碼
2100651
數位銀行平台:市場佔有率分析、產業趨勢與統計、成長預測(2026-2031)Digital Banking Platform - Market Share Analysis, Industry Trends & Statistics, Growth Forecasts (2026 - 2031) |
||||||

※ 本網頁內容可能與最新版本有所差異。詳細情況請與我們聯繫。
據 Mordor Intelligence 稱,2025 年數位銀行平台市值為 137.9 億美元,預計到 2031 年將達到 310.8 億美元,而 2026 年為 157.9 億美元,預測期(2026-2031 年)的複合年成長率為 14.52%。
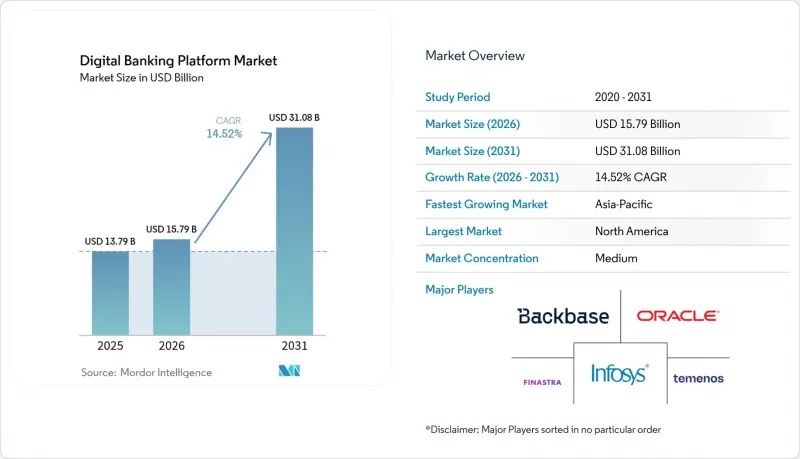
本報告按部署類型(雲端和本地部署)、銀行類型(零售銀行和企業/中小企業銀行)、元件(平台和服務)、服務模式(SaaS訂閱、許可、銀行即服務)以及存取方式(行動銀行和網路銀行/網路銀行)進行分類,並按地區進行分析。市場預測以美元計價。
全球數位銀行平台市場趨勢與洞察
一級銀行的雲端優先核心銀行系統遷移
一級金融機構正在加速採用多重雲端架構,以降低固定基礎設施成本並縮短產品發布週期。摩根大通已完成多重雲端部署,而桑坦德銀行在10個市場進行的系統現代化改造凸顯了逐步淘汰傳統核心系統的重要性。銀行報告稱,遷移後新數位產品的上市時間縮短了50%,證實了雲端是策略工具。即時分析、內建詐欺偵測引擎和基於人工智慧的客戶洞察在同一架構上運行,從而促進交叉銷售並提高合規靈活性。伊塔烏銀行計劃在2028年之前完成100%雲端遷移,向同業表明,可衡量的效率提升遠大於遷移風險。
新興市場對以智慧型手機為中心的銀行服務的需求
在亞太和拉丁美洲地區,行動優先策略的採用正在加速分店網路擴張帶來的經濟效益。數位錢包已支援該地區超過70%的電子商務支出,迫使銀行將其前端系統重建為生活方式超級應用。成本效益是推動這一趨勢的主要因素。行動交易成本僅0.17美元,而線下交易成本則高達4.25美元,這使得銀行能夠將節省下來的成本再投資於用戶體驗(UX)改進和嵌入式商家服務。 Nubank正在展現規模經濟效益,基本客群從2020年的3,330萬成長到2023年的9,390萬,同時維持了27%的稅前股本回報率(ROE)。
即時詐欺分析和反洗錢合規成本不斷上升。
全球反洗錢相關支出已達2,139億美元。儘管投入巨大,據估計,洗錢者每年仍透過合成身分和加密貨幣混合器轉移約2兆美元資金。光是2023年,銀行就被罰款70億美元。智慧反洗錢系統預計將透過減少誤報降低60%的成本,但其實施需要資金和專業技能,這給中小型金融機構帶來了壓力。
細分市場分析
到2025年,雲端運算將佔據數位銀行平台市場佔有率的60.74%,年複合成長率(CAGR)將達到15.54%,這主要得益於金融機構將資本支出(Capex)的負擔轉移到靈活的營運支出(OpEx)上。銀行表示,將工作負載遷移到可擴展的區域將降低50%的基礎設施維護成本,並增強災害復原能力。雖然在嚴格執行資料本地化的司法管轄區,本地核心系統仍然存在,但這些部署也開始透過容器編排管理來模擬雲端運算的彈性。 EQ銀行基於Temenos的遷移案例凸顯了區域性金融機構如何利用雲端運算來彌補與大型銀行在功能上的差距。
雲端技術的採用正在重塑供應商的經營模式。基於訂閱的授權模式使收入能夠與高峰使用量保持一致,使銀行能夠在不延誤採購的情況下快速開發新服務。即時分析、內建詐欺偵測評分和人工智慧驅動的信用建模等功能原生支援雲端技術,降低了整合複雜性。同時,供應商正在最佳化資料中心設計,以提高能源效率,符合歐洲綠色IT指令,並降低整體擁有成本 (TCO)。隨著越來越多的頂級銀行公佈實現碳淨零排放的計劃,能夠展現檢驗減排效果的雲端技術正在獲得採購優勢。
儘管預計到2025年零售銀行業務收入將佔總收入的63.12%,但企業及中小企業銀行業務目前的複合年成長率(CAGR)為16.19%,使其成為數位銀行平台市場中成長最快的細分領域。企業正在尋求能夠與ERP工作流程無縫整合的即時流動性儀錶板、API驅動的結算以及嵌入式貿易融資模組。實施合約的平均規模高於零售合約,這有助於提高供應商的利潤率並延長合約鎖定期。
亞太地區的跨境供應商推動了對單一工作空間即時結算和動態外匯對沖功能日益成長的需求。嵌入式金融解決方案也進一步促進了這一趨勢。與金融科技公司的合作使製造商能夠將發票貼現和供應商信用工具直接整合到其採購入口網站中,從而提高平台用戶留存率。
區域分析
亞太地區正引領最快成長,複合年成長率高達16.34%,並持續提升對數位銀行平台市場的貢獻。智慧型手機的高普及率、廣泛的QR碼支付基礎設施以及有利的牌照發放機制,正推動現有企業的數位轉型和新型銀行的推出。預計到2024年,光是中國一國的數位錢包消費就將達到7.6兆美元,而新加坡和馬來西亞正在擴大數位銀行牌照配額以促進市場競爭。東南亞數位金融服務收入已達330億美元,印證了其商業性可行性。
北美憑藉其充足的技術預算和對雲端服務的領先採用,保持著37.35%的市場佔有率。各銀行正在投資人工智慧輔助系統進行信用分析、與FedNow整合,並更新核心系統以符合ESG(環境、社會和治理)標準。儘管有關開放銀行的監管細則仍在製定中,但隨著金融機構對使用了數十年的大型主機進行現代化改造,投資勢頭依然強勁。以雲端為中心的風險正引起監管機構的關注,多重雲端實驗正在進行中,以降低對供應商的依賴。
在歐洲,開放銀行領域的領先地位與永續性的需求之間正尋求平衡。儘管PSD2規範了API的開放性,但ESG報告如今也影響供應商的選擇,節能型SaaS核心在評估標準中佔據優先地位。北歐市場展現高度成熟度,數位銀行滲透率接近90%,生物識別也迅速普及。拉丁美洲正走在「行動優先」的道路上,巴西的Pix支付系統展示了即時支付基礎設施如何加速數位化進程。非洲仍在發展中,但通訊業者的金融生態系統(作為通往全面數位銀行的門戶)正從中受益,為雲端原生供應商創造了新的商機。
其他好處:
- Excel格式的市場預測(ME)表
- 3個月的分析師支持
目錄
第1章:引言
- 研究假設和市場定義
- 調查範圍
第2章:調查方法
第3章執行摘要
第4章 市場狀況
- 市場概覽
- 市場促進因素
- 一級銀行向雲端優先核心銀行系統的轉型
- 新興市場對以智慧型手機為中心的銀行服務的需求
- 監理部門為開放銀行和遵守API標準所做的努力
- 利用生成式人工智慧開發高度個人化的使用者體驗。
- 強制性的綠色 IT 實踐正在推動向更節能的 SaaS 核心轉型。
- 在銀行服務尚未普及的地區,拓展純數位銀行業務。
- 市場限制因素
- 即時詐欺分析和反洗錢合規成本不斷上升。
- 與超大規模資料中心業者託管服務相關的供應商鎖定風險。
- 開發中國家缺乏雲端原生銀行人才
- 傳統技術堆疊與微服務技術堆疊之間的互通性差距
- 產業價值鏈分析
- 監理情勢
- 技術展望
- 產業吸引力—五力分析
- 供應商的議價能力
- 消費者議價能力
- 新進入者的威脅
- 替代品的威脅
- 競爭公司之間的競爭
- 宏觀經濟因素對市場的影響
第5章 市場規模與成長預測
- 不同的發展
- 雲
- 現場
- 按銀行類型
- 零售銀行
- 為企業和中小企業提供銀行服務
- 按組件
- 平台(軟體)
- 服務(實施和支援)
- 按服務模式
- SaaS訂閱
- 許可證(永久許可證)
- Banking-as-a-Service(BaaS)
- 訪問方法
- 行動銀行
- 網路銀行/網路銀行
- 按地區
- 北美洲
- 美國
- 加拿大
- 墨西哥
- 南美洲
- 巴西
- 阿根廷
- 智利
- 其他南美國家
- 歐洲
- 德國
- 英國
- 法國
- 義大利
- 西班牙
- 俄羅斯
- 其他歐洲國家
- 亞太地區
- 中國
- 印度
- 日本
- 韓國
- 新加坡
- 馬來西亞
- 澳洲
- 其他亞太國家
- 中東和非洲
- 中東
- 阿拉伯聯合大公國
- 沙烏地阿拉伯
- 土耳其
- 其他中東國家
- 非洲
- 南非
- 奈及利亞
- 其他非洲國家
- 中東
- 北美洲
第6章 競爭情勢
- 市場集中度
- 策略趨勢
- 市佔率分析
- 公司簡介
- Backbase BV
- Temenos Headquarters SA
- Finastra Group Holdings Limited
- Infosys Ltd.(Finacle)
- Oracle Corporation
- Fiserv, Inc.
- SAP SE
- Sopra Steria Group SA
- Tata Consultancy Services Limited
- CREALOGIX Holding AG
- Appway AG
- Worldline SA
- nCino, Inc.
- Alkami Technology, Inc.
- Mambu GmbH
- Thought Machine Group Ltd.
- Finxact, Inc.
- Fidor Solutions AG
- Technisys SA
- Plaid Inc.
- Intellect Design Arena Limited
- Ohpen Holding BV
- Jack Henry & Associates, Inc.
- Sopra Banking Software USA, Inc.
- Avaloq Group AG
第7章 市場機會與未來趨勢
- 評估閒置頻段和未滿足的需求
According to Mordor Intelligence, the digital banking platform market size was valued at USD 13.79 billion in 2025 and estimated to grow from USD 15.79 billion in 2026 to reach USD 31.08 billion by 2031, at a CAGR of 14.52% during the forecast period (2026-2031).
This report is Segmented by Deployment (Cloud and On-Premises), Banking Type (Retail Banking and Corporate/SME Banking), Component (Platform and Services), Service Model (SaaS Subscription, Licensed, and Banking-As-A-Service), Access Mode (Mobile Banking and Online/Web Banking). And Geography. The Market Forecasts are Provided in Terms of Value (USD).
Global Digital Banking Platform Market Trends and Insights
Cloud-First Core Banking Migrations Among Tier-1 Banks
Tier-1 institutions fast-track multi-cloud deployments to lower fixed infrastructure costs and compress product launch cycles. JPMorgan Chase has finished a multi-cloud roll-out, while Santander's ten-market overhaul underlines the commitment required to sunset legacy cores. Banks report 50% shorter time-to-market for new digital products after migration, reinforcing cloud as a strategic lever. Real-time analytics, embedded fraud-detection engines, and AI-based customer insights ride on the same architecture, boosting cross-sell and compliance agility. Banco Itau intends to complete a 100% cloud move by 2028, a signal to peers that measurable efficiency gains outweigh transition risk.
Smartphone-Centric Lifestyle Banking Demand in Emerging Markets
Mobile-first adoption short-circuits branch expansion economics across Asia-Pacific and Latin America. Digital wallets already underpin more than 70% of regional e-commerce spend, compelling banks to recast their front ends as lifestyle super-apps. Cost economics drive momentum: a mobile transaction costs USD 0.17 against USD 4.25 at the counter, freeing margin for reinvestment in UX refresh and embedded merchant services. Nubank demonstrates scale advantage, growing its customer base from 33.3 million in 2020 to 93.9 million in 2023 while sustaining a 27% pre-tax ROE.
Rising Cost of Real-Time Fraud-Analytics and AML Compliance
Global AML spend has reached USD 213.9 billion. Despite investment, launderers funnel an estimated USD 2 trillion through synthetic IDs and crypto mixers each year. Banks fielded USD 7 billion in fines during 2023 alone. Smart-AML suites promise 60% cost savings through false-positive reduction, yet rollout demands capital and specialist skill, pressuring small-to-mid-tier lenders.
Other drivers and restraints analyzed in the detailed report include:
- Regulatory Push for Open-Banking and API-Standard Compliance
- Generative-AI Powered Hyper-Personalized UX Roll-Outs
- Vendor Lock-In Risks from Hyperscaler Managed Services
For complete list of drivers and restraints, kindly check the Table Of Contents.
Segment Analysis
Cloud captured 60.74% of the digital banking platform market share in 2025 and is expanding at a 15.54% CAGR as institutions convert capex burdens into flexible opex. Banks cite 50% lower infrastructure upkeep and stronger disaster-recovery postures once workloads move to scalable regions. On-premises cores persist in jurisdictions enforcing strict data-localization, but even these deployments now mimic the cloud's elasticity through container orchestration. EQ Bank's Temenos-based migration underscores how regional lenders leverage cloud to close capability gaps with money-center peers.
Cloud adoption reshapes vendor economics: subscription licensing aligns revenue with usage peaks, letting banks prototype new services without procurement delays. Real-time analytics, embedded fraud scoring, and AI-driven credit modeling activate natively, reducing integration complexity. In parallel, platform vendors tune data-center designs for energy efficiency, addressing European Green-IT directives and lowering total cost of ownership. As more tier-1 banks publish carbon-net-zero timelines, cloud footprints that demonstrate verifiable emission savings gain a procurement advantage.
Retail banking represented 63.12% of 2025 revenue, yet corporate/SME banking now tracks a 16.19% CAGR, making it the fastest sub-segment within the digital banking platform market. Businesses seek real-time liquidity dashboards, API-driven payments, and embedded trade-finance modules that dovetail with ERP workflows. Average implementation deal sizes outstrip retail contracts, supporting higher vendor margins and longer lock-in periods.
Cross-border suppliers in Asia-Pacific elevate demand for instant settlement and dynamic FX hedging within single workspaces. Embedded finance propositions add further lift: fintech partnerships allow manufacturers to embed invoice-discounting or supplier-credit tools directly inside procurement portals, boosting platform stickiness.
Complete Report Scope:
- By Deployment
- Cloud
- On-Premises
- By Banking Type
- Retail Banking
- Corporate/SME Banking
- By Component
- Platform (Software)
- Services (Implementation and Support)
- By Service Model
- SaaS Subscription
- Licensed (Perpetual)
- Banking-as-a-Service (BaaS)
- By Access Mode
- Mobile Banking
- Online/Web Banking
- By Geography
- North America
- United States
- Canada
- Mexico
- South America
- Brazil
- Argentina
- Chile
- Rest of South America
- Europe
- Germany
- United Kingdom
- France
- Italy
- Spain
- Russia
- Rest of Europe
- Asia-Pacific
- China
- India
- Japan
- South Korea
- Singapore
- Malaysia
- Australia
- Rest of Asia-Pacific
- Middle East and Africa
- Middle East
- United Arab Emirates
- Saudi Arabia
- Turkey
- Rest of Middle East
- Africa
- South Africa
- Nigeria
- Rest of Africa
- Middle East
- North America
Geography Analysis
Asia-Pacific drives the fastest advance, recording a 16.34% CAGR that lifts regional contribution within the digital banking platform market. Smartphone saturation, universal QR payment infrastructure, and supportive licensing regimes nurture both incumbent digitization and neo-bank launches. China alone handled USD 7.6 trillion in digital-wallet spend during 2024, while Singapore and Malaysia expand digital-bank quotas to promote competition. Southeast Asia's digital financial services revenue reached USD 33 billion, confirming commercial viability.
North America retains a 37.35% share, underpinned by deep technology budgets and early-stage cloud adoption. Banks channel spending into AI copilots for credit analytics, FedNow integrations, and ESG-aligned core replacements. Regulatory clarity around open banking is still forming, but investment momentum remains intact as institutions refresh decades-old mainframes. Cloud concentration risk garners oversight, prompting multi-cloud experiments that temper vendor dependency.
Europe balances open-banking leadership with sustainability imperatives. PSD2 has normalized API exposure, while ESG reporting now influences vendor selection energy-efficient SaaS cores earn scorecard preference. Nordic markets illustrate maturity, with nearly 90% digital banking penetration and rapid adoption of biometric authentication. Latin America follows a mobile-first trajectory; Brazil's Pix rails demonstrate how instant-payment infrastructure accelerates digital adoption. Africa, though nascent, benefits from telco money ecosystems acting as on-ramps to full digital banking, creating greenfield opportunities for cloud-native vendors.
- Backbase B.V.
- Temenos Headquarters SA
- Finastra Group Holdings Limited
- Infosys Ltd. (Finacle)
- Oracle Corporation
- Fiserv, Inc.
- SAP SE
- Sopra Steria Group SA
- Tata Consultancy Services Limited
- CREALOGIX Holding AG
- Appway AG
- Worldline SA
- nCino, Inc.
- Alkami Technology, Inc.
- Mambu GmbH
- Thought Machine Group Ltd.
- Finxact, Inc.
- Fidor Solutions AG
- Technisys S.A.
- Plaid Inc.
- Intellect Design Arena Limited
- Ohpen Holding B.V.
- Jack Henry & Associates, Inc.
- Sopra Banking Software USA, Inc.
- Avaloq Group AG
Additional Benefits:
- The market estimate (ME) sheet in Excel format
- 3 months of analyst support
TABLE OF CONTENTS
1 INTRODUCTION
- 1.1 Study Assumptions and Market Definition
- 1.2 Scope of the Study
2 RESEARCH METHODOLOGY
3 EXECUTIVE SUMMARY
4 MARKET LANDSCAPE
- 4.1 Market Overview
- 4.2 Market Drivers
- 4.2.1 Cloud-first core banking migrations among Tier-1 banks
- 4.2.2 Smartphone-centric lifestyle banking demand in emerging markets
- 4.2.3 Regulatory push for open-banking and API-standard compliance
- 4.2.4 Generative-AI powered hyper-personalized UX roll-outs
- 4.2.5 Green-IT mandates driving shift to energy-efficient SaaS cores
- 4.2.6 Digital-only neo-bank expansion in under-banked regions
- 4.3 Market Restraints
- 4.3.1 Rising cost of real-time fraud-analytics and AML compliance
- 4.3.2 Vendor lock-in risks from hyperscaler managed services
- 4.3.3 Scarcity of cloud-native banking talent in developing nations
- 4.3.4 Interoperability gaps across legacy and micro-services stacks
- 4.4 Industry Value Chain Analysis
- 4.5 Regulatory Landscape
- 4.6 Technological Outlook
- 4.7 Industry Attractiveness - Porter's Five Forces Analysis
- 4.7.1 Bargaining Power of Suppliers
- 4.7.2 Bargaining Power of Consumers
- 4.7.3 Threat of New Entrants
- 4.7.4 Threat of Substitutes
- 4.7.5 Intensity of Competitive Rivalry
- 4.8 Impact of Macroeconomic Factors on the Market
5 MARKET SIZE AND GROWTH FORECASTS (VALUES)
- 5.1 By Deployment
- 5.1.1 Cloud
- 5.1.2 On-Premises
- 5.2 By Banking Type
- 5.2.1 Retail Banking
- 5.2.2 Corporate/SME Banking
- 5.3 By Component
- 5.3.1 Platform (Software)
- 5.3.2 Services (Implementation and Support)
- 5.4 By Service Model
- 5.4.1 SaaS Subscription
- 5.4.2 Licensed (Perpetual)
- 5.4.3 Banking-as-a-Service (BaaS)
- 5.5 By Access Mode
- 5.5.1 Mobile Banking
- 5.5.2 Online/Web Banking
- 5.6 By Geography
- 5.6.1 North America
- 5.6.1.1 United States
- 5.6.1.2 Canada
- 5.6.1.3 Mexico
- 5.6.2 South America
- 5.6.2.1 Brazil
- 5.6.2.2 Argentina
- 5.6.2.3 Chile
- 5.6.2.4 Rest of South America
- 5.6.3 Europe
- 5.6.3.1 Germany
- 5.6.3.2 United Kingdom
- 5.6.3.3 France
- 5.6.3.4 Italy
- 5.6.3.5 Spain
- 5.6.3.6 Russia
- 5.6.3.7 Rest of Europe
- 5.6.4 Asia-Pacific
- 5.6.4.1 China
- 5.6.4.2 India
- 5.6.4.3 Japan
- 5.6.4.4 South Korea
- 5.6.4.5 Singapore
- 5.6.4.6 Malaysia
- 5.6.4.7 Australia
- 5.6.4.8 Rest of Asia-Pacific
- 5.6.5 Middle East and Africa
- 5.6.5.1 Middle East
- 5.6.5.1.1 United Arab Emirates
- 5.6.5.1.2 Saudi Arabia
- 5.6.5.1.3 Turkey
- 5.6.5.1.4 Rest of Middle East
- 5.6.5.2 Africa
- 5.6.5.2.1 South Africa
- 5.6.5.2.2 Nigeria
- 5.6.5.2.3 Rest of Africa
- 5.6.5.1 Middle East
- 5.6.1 North America
6 COMPETITIVE LANDSCAPE
- 6.1 Market Concentration
- 6.2 Strategic Moves
- 6.3 Market Share Analysis
- 6.4 Company Profiles (includes Global level Overview, Market level overview, Core Segments, Financials as available, Strategic Information, Market Rank/Share for key companies, Products and Services, and Recent Developments)
- 6.4.1 Backbase B.V.
- 6.4.2 Temenos Headquarters SA
- 6.4.3 Finastra Group Holdings Limited
- 6.4.4 Infosys Ltd. (Finacle)
- 6.4.5 Oracle Corporation
- 6.4.6 Fiserv, Inc.
- 6.4.7 SAP SE
- 6.4.8 Sopra Steria Group SA
- 6.4.9 Tata Consultancy Services Limited
- 6.4.10 CREALOGIX Holding AG
- 6.4.11 Appway AG
- 6.4.12 Worldline SA
- 6.4.13 nCino, Inc.
- 6.4.14 Alkami Technology, Inc.
- 6.4.15 Mambu GmbH
- 6.4.16 Thought Machine Group Ltd.
- 6.4.17 Finxact, Inc.
- 6.4.18 Fidor Solutions AG
- 6.4.19 Technisys S.A.
- 6.4.20 Plaid Inc.
- 6.4.21 Intellect Design Arena Limited
- 6.4.22 Ohpen Holding B.V.
- 6.4.23 Jack Henry & Associates, Inc.
- 6.4.24 Sopra Banking Software USA, Inc.
- 6.4.25 Avaloq Group AG
7 MARKET OPPORTUNITIES AND FUTURE TRENDS
- 7.1 White-Space and Unmet-Need Assessment

 全球數位銀行平台市場規模、佔有率、趨勢和成長分析報告(2026-2034)
 數位銀行平台和新銀行市場預測至2034年-按組件、銀行模式、帳戶類型、服務類型、應用、最終用戶和地區分類的全球分析
 2026年銀行業數位化獎勵管理全球市場報告純數位銀行平台市場:預測(至2034年)-按組件、部署方式、技術、應用、最終用戶和地區分類的全球分析
 數位銀行平台市場報告:按組件、類型、部署模式、銀行業務模式和地區分類(2026-2034 年)
 數位銀行平台市場:分析與預測(至 2035 年)-按類型、產品類型、服務、技術、組件、應用、部署模式、最終用戶、功能和解決方案分類2026年全球數位銀行平台市場報告
 數位銀行平台市場規模、佔有率和趨勢分析報告:按部署方式、模式、組件、服務、類型、地區和細分市場預測(2026-2033 年)
 數位銀行平台市場規模、佔有率和成長分析(按類型、組件、銀行模式、部署類型和地區分類)-2026-2033年產業預測數位銀行平台市場預測至2032年:按組件、部署模式、組織規模、功能、最終用戶和地區分類的全球分析