


 |
市場調查報告書
商品編碼
2100606
網路安全即服務:市場佔有率分析、行業趨勢和統計數據、成長預測(2026-2031 年)Cybersecurity As A Service - Market Share Analysis, Industry Trends & Statistics, Growth Forecasts (2026 - 2031) |
||||||

※ 本網頁內容可能與最新版本有所差異。詳細情況請與我們聯繫。
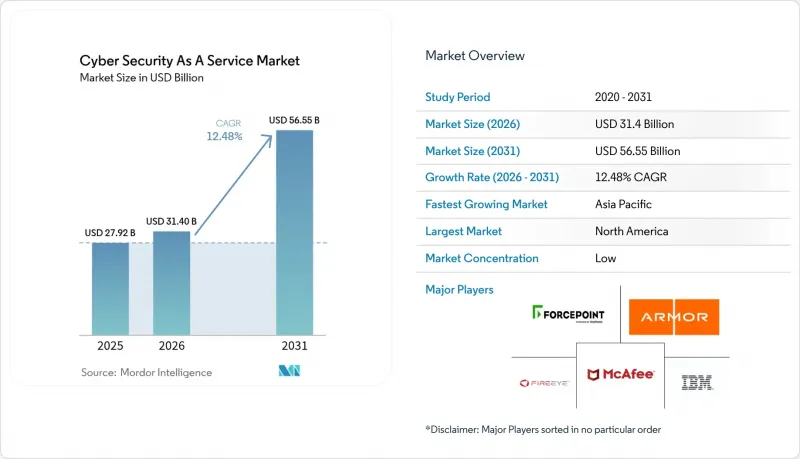
根據 Mordor Intelligence 預測,網路安全即服務 (CySaaS) 市場規模將從 2025 年的 279.2 億美元成長到 2026 年的 314 億美元,然後在 2031 年達到 565.5 億美元,2026 年至 2031 年的複合年成長率為 12.48%。
本報告按最終用戶公司規模(中小企業、大型企業)、服務模式(例如,SOC 即服務)、安全類型(例如,風險和漏洞評估)、部署模式(例如,公共雲端、私有雲端)、最終用戶行業(例如,銀行、金融服務和保險 (BFSI)、製造業)以及地區(例如,北美、歐洲)進行細分。市場預測以美元 (USD) 計價。
全球網路安全即服務市場趨勢與洞察
資料外洩的成本和頻率不斷增加,推動了這些服務的普及。
2024年資料外洩的平均成本將達到488萬美元,年增10%。這迫使董事會為持續監控和快速遏制服務提供資金。醫療保健產業的資料外洩成本高達977萬美元,佔已通報事件的79%,但已實施人工智慧和自動化技術的機構已節省了220萬美元的成本,並將遏制期縮短了54天。由於70%遭遇資料外洩的公司都經歷了嚴重的業務中斷,即時偵測和回應已被列為ISO 27001等法規結構的基本要求。
在技術短缺危機日益加劇的背景下,中小企業對網路安全的需求正在加速成長。
中小企業是網路攻擊的受害者,佔比高達43%,但其中18%仍缺乏正式的防禦措施,另有44%依賴基礎工具。受影響的中小企業中有60%被迫在六個月內倒閉,因此服務供應商開始提供訂閱式服務,包括全天候安全營運中心(SOC)監控、合規指導和網路保險。英國的「網路安全基礎認證」(Cyber Essentials)等政府主導的項目以及每月1萬美元起的低成本SOC套餐正在推動市場需求成長。
對數據主權的擔憂為服務交付帶來了挑戰。
NIS2 迫使 35 萬家歐洲營業單位加強供應鏈監控,要求服務提供者將遙測資料託管在歐盟境內以滿足居住要求。新加坡和印度的類似法規也迫使全球託管安全服務提供者 (MSSP) 在區域內複製其基礎設施,這增加了資本支出,並使威脅情報共用更加複雜。擔心供應商鎖定的企業越來越要求合約中包含終止條款和開放標準的遙測技術,以降低更換供應商的門檻。
細分市場分析
至2025年,大型企業將佔據網路安全即服務(CaaS)市場71.35%的佔有率。這主要得益於其用於支援多層託管偵測與回應(MDR)、威脅狩獵和合編配工作的預算。包含固定費率事件回應合約和資料外洩保險整合在內的綜合服務合約金額通常超過每年50萬美元。同時,中小企業(SME)市場預計將以13.98%的複合年成長率成長,這主要得益於承包安全營運中心即服務(SOCaaS)捆綁包以及將NIS2義務擴展至小規模供應鏈合作夥伴的監管計劃。
經濟高效的雲端交付模式、固定價格訂閱以及透過與保險公司合作獲得的折扣,正在降低中小企業(SME)的准入門檻,尤其是在雲端採用率激增的亞太地區。提供多語言儀錶板和可自訂合規模板的供應商,在首次採用資安管理服務的客戶中佔據了主導市場佔有率。
到 2025 年,託管偵測與回應 (MDR) 將佔網路安全即服務 (CaaS) 市場 29.10% 的佔有率,這反映出企業越來越傾向於主動威脅搜尋並結合快速修復。 CrowdStrike 的平台模型透過整合端點、身分和雲端遙測數據,展現了其競爭優勢。安全營運中心即服務 (SOCaaS) 正以 16.95% 的複合年成長率 (CAGR) 成長,這得益於人工智慧驅動的故障分類和「基於成長的授權」模式,該模式能夠滿足資源受限組織的需求。
此外,隨著人工智慧工作流程中機器對機器 (M2M) 通訊流量的爆炸性成長,以及企業擴大將憑證生命週期管理外包,身分即服務 (IaaS) 也持續發展。雖然漏洞測試和合規性評估仍然至關重要,但能夠進行與保險和董事會層面風險指標直接相關的持續檢驗,如今已成為企業脫穎而出的關鍵。
區域分析
預計到2025年,北美將佔總收入的34.10%。這主要得益於美國企業承擔著全球最高的資料外洩成本之一(每次事件高達980萬美元),以及美國證券交易委員會(SEC)嚴格的資訊揭露要求,該要求優先考慮持續的檢測和報告。由於董事會傾向於選擇能夠減少工具重複使用並簡化審計合規的單一平台供應商,支出成長仍然強勁。創業投資持續為以人工智慧為中心的創新提供資金,從而維持著一個充滿活力的合作夥伴生態系統。
亞太地區是成長最快的區域,預計到2031年將以14.95%的複合年成長率成長,這主要得益於企業加速向多重雲端遷移並加強線上支付管道的安全保障。印度的技術支出預計將在2025年達到5兆印度盧比(約604億美元),這將刺激對混合雲端安全諮詢的需求,同時該地區的網路保險市場也正以每年約50%的速度成長。從新加坡的《網路安全法》到中國的《個人資料保護法》,各地的法規正在推動區域性安全營運中心(SOC)的發展,這些中心將全球威脅情報與國內資料處理結合。
在歐洲,受NIS2法規的推動,安全營運中心(SOC)服務持續穩定擴張。 NIS2要求約35萬個關鍵營業單位提供全天候(24/7)的安全營運中心服務。對資料主權的擔憂促使企業更傾向於選擇營運區域雲端並支援隱私增強技術的服務提供者。此外,一些經濟獎勵也正在湧現,例如保險公司降低符合ENISA指南的企業的保費,這進一步鞏固了中大型企業對相關服務的採用。
其他好處:
- Excel格式的市場預測(ME)表
- 3個月的分析師支持
目錄
第1章:引言
- 研究假設和市場定義
- 調查範圍
第2章:調查方法
第3章執行摘要
第4章 市場狀況
- 市場概覽
- 市場促進因素
- 資料外洩的成本和頻率增加
- 由於網路安全人員短缺,中小企業的需求增加。
- 雲端運算和遠端辦公擴大了攻擊面。
- 網路保險條款要求持續監控。
- 以 API/M2M 流量為導向的身分中心安全
- NIS2 及類似針對關鍵機構的 24/7 全天候安全營運中心 (SOC) 要求
- 市場限制因素
- 對數據主權和供應商鎖定問題的擔憂
- 多重雲端環境的可見性差距
- 針對MSSP/CSaaS供應鏈的定向攻擊
- 勞動力成本上升正在給供應商的利潤率帶來壓力。
- 產業價值鏈分析
- 監理情勢
- 技術展望
- 波特五力分析
第5章 市場規模與成長預測
- 按最終用戶公司規模分類
- 中小企業
- 大公司
- 按服務模式
- 託管偵測與回應 (MDR)
- SOC as a Service
- 身分和存取管理即服務 (IAMaaS)
- 漏洞評估和穿透測試即服務
- 合規與風險評估服務
- 預防資料外泄即服務 (DLPaaS)
- 按安全類型
- 風險和脆弱性評估
- 威脅情報與分析
- 審計和日誌記錄
- 持續監控和加密
- 身分和存取管理
- 事件應變和災害復原即服務
- 部署模式
- 公共雲端
- 私有雲端
- 混合雲端
- 按最終用戶行業分類
- BFSI
- 醫療保健和生命科學
- IT/通訊
- 政府/國防
- 能源公用事業
- 零售與電子商務
- 製造業
- 地區
- 北美洲
- 美國
- 加拿大
- 墨西哥
- 南美洲
- 巴西
- 阿根廷
- 其他南美國家
- 歐洲
- 英國
- 德國
- 法國
- 俄羅斯
- 其他歐洲國家
- 亞太地區
- 中國
- 印度
- 日本
- 韓國
- 其他亞太國家
- 中東和非洲
- 中東
- GCC
- 土耳其
- 以色列
- 其他中東國家
- 非洲
- 南非
- 奈及利亞
- 肯亞
- 其他非洲國家
- 中東
- 北美洲
第6章 競爭情勢
- 市場集中度
- 策略趨勢
- 市佔率分析
- 公司簡介
- International Business Machines(IBM)Corporation
- Accenture plc
- Cisco Systems, Inc.
- AT&T Cybersecurity(AT&T Inc.)
- Secureworks, Inc.
- McAfee, LLC
- Trellix LLC(Musarubra US LLC)
- Fortinet, Inc.
- Palo Alto Networks Inc.
- Check Point Software Technologies Ltd.
- CrowdStrike Holdings, Inc.
- Rapid7, Inc.
- Sophos Ltd
- Proofpoint Inc.
- Zscaler, Inc.
- FireEye, LLC
- Armor Defense Inc.
- Convergent Network Solutions Ltd.
- Transputec Ltd.
- Zeguro Inc.
- Sara Technologies Inc.
- Cloud24x7 Pvt. Ltd.
第7章 市場機會與未來展望
According to Mordor Intelligence, the cybersecurity as a service market size is expected to grow from USD 27.92 billion in 2025 to USD 31.4 billion in 2026 and is forecast to reach USD 56.55 billion by 2031 at 12.48% CAGR over 2026-2031.
This report is Segmented by End-User Enterprise Size (SMEs, Large Enterprises), Service Model ( SOC As A Service, and More), Security Type (Risk and Vulnerability Assessment, and More), Deployment Mode (Public Cloud, Private Cloud, and More), End-User Industry (BFSI, Manufacturing, and More), and Geography (North America, Europe, and More). The Market Forecasts are Provided in Terms of Value (USD).
Global Cybersecurity As A Service Market Trends and Insights
Rising Cost and Frequency of Data Breaches Drive Service Adoption
Average breach expenses climbed to USD 4.88 million in 2024, a 10% year-over-year jump, pressuring boards to fund continuous monitoring and rapid containment services. Healthcare breaches cost USD 9.77 million and represented 79% of reported incidents, while AI- and automation-enabled organizations saved USD 2.2 million and shortened containment by 54 days. As 70% of breached firms experience material business disruption, regulatory frameworks such as ISO 27001 elevate real-time detection and response to a baseline requirement.
SME Cybersecurity Demand Accelerates Amid Skills Crisis
SMEs suffer 43% of cyberattacks, yet 18% still lack formal defenses; a further 44% rely on basic tools. With 60% of impacted SMEs folding within six months, service providers are tailoring subscription-based offerings that bundle 24/7 SOC oversight, compliance guidance, and cyber-insurance facilitation. Government schemes like the U.K.'s Cyber Essentials and lower-cost SOC bundles priced from USD 10,000 per month are expanding addressable demand.
Data Sovereignty Concerns Create Service Delivery Challenges
NIS2 pushes 350,000 European entities to tighten supply-chain oversight, compelling providers to host telemetry inside the bloc to satisfy residency mandates. Similar rules in Singapore and India force global MSSPs to replicate infrastructure regionally, raising capex and complicating threat-intelligence sharing. Enterprises wary of vendor lock-in increasingly demand contractual exit clauses and open-standards telemetry to mitigate switching barriers.
Other drivers and restraints analyzed in the detailed report include:
- Cloud Migration Expands Attack Surfaces and Service Requirements
- Cyber-Insurance Evolution Mandates Continuous Monitoring
- Multi-Cloud Visibility Gaps Undermine Service Effectiveness
For complete list of drivers and restraints, kindly check the Table Of Contents.
Segment Analysis
Large enterprises accounted for 71.35% of Cybersecurity As A Service Market share in 2025, driven by budgets that support multi-layered MDR, threat-hunting, and compliance orchestration engagements. Contract values routinely surpass USD 500,000 per year for holistic coverage that includes incident-response retainers and breach-insurance alignment. The SME segment, however, is forecast to grow at 13.98% CAGR, fueled by turnkey SOC-as-a-Service bundles and regulatory programs that extend NIS2 obligations to smaller supply-chain partners.
Cost-effective cloud delivery models, flat-fee subscription pricing, and insurer-linked discounts are lowering barriers for SMEs, especially in Asia Pacific, where SMB cloud adoption is surging. Providers tailoring language-localized dashboards and compliance templates are capturing outsized share among first-time buyers of managed security services.
Managed detection and response held 29.10% of the Cybersecurity As A Service Market size in 2025, reflecting enterprises' preference for proactive threat-hunting fused with rapid remediation. CrowdStrike's platform model illustrates competitive advantage achieved through endpoint, identity, and cloud telemetry convergence. SOC as a Service is expanding at 16.95% CAGR, supported by AI-driven triage and pay-as-you-grow licensing that resonates with resource-constrained organizations.
Identity-as-a-Service is also climbing as machine-to-machine traffic explodes in AI workflows, prompting firms to outsource credential lifecycle management. Vulnerability testing and compliance assessment remain foundational, yet differentiation now hinges on continuous validation capabilities that map directly to insurance and board-level risk metrics.
Complete Report Scope:
- By End-user Enterprise Size
- Small and Medium Enterprises (SMEs)
- Large Enterprises
- By Service Model
- Managed Detection and Response (MDR)
- SOC as a Service
- Identity and Access Management as a Service
- Vulnerability and Pen-Test as a Service
- Compliance and Risk Assessment as a Service
- Data Loss Prevention as a Service
- By Security Type
- Risk and Vulnerability Assessment
- Threat Intelligence and Analytics
- Auditing and Logging
- Continuous Monitoring and Encryption
- Identity and Access Management
- Incident Response and Disaster Recovery aaS
- By Deployment Mode
- Public Cloud
- Private Cloud
- Hybrid Cloud
- By End-user Industry
- BFSI
- Healthcare and Life Sciences
- IT and Telecom
- Government and Defense
- Energy and Utilities
- Retail and E-commerce
- Manufacturing
- Geography
- North America
- United States
- Canada
- Mexico
- South America
- Brazil
- Argentina
- Rest of South America
- Europe
- United Kingdom
- Germany
- France
- Russia
- Rest of Europe
- Asia-Pacific
- China
- India
- Japan
- South Korea
- Rest of Asia-Pacific
- Middle East and Africa
- Middle East
- GCC
- Turkey
- Israel
- Rest of Middle East
- Africa
- South Africa
- Nigeria
- Kenya
- Rest of Africa
- Middle East
- North America
Geography Analysis
North America generated 34.10% of 2025 revenue, supported by the world's highest breach costs U.S. organizations pay USD 9.8 million per incident and by stringent SEC disclosure mandates that prioritize continuous detection and reporting. Spending growth remains healthy as boards favor single-platform vendors that cut tool overlap and simplify audit readiness. Venture capital continues to fund AI-centric disruptors, sustaining a vibrant partner ecosystem.
Asia Pacific is the fastest-growing region, advancing at 14.95% CAGR to 2031 as enterprises rush to secure multi-cloud migrations and online-payment channels. India's technology expenditure is set to reach INR 5 trillion (USD 60.4 billion) in 2025, stimulating demand for hybrid-cloud security consulting, while the region's cyber-insurance market grows almost 50% annually. Local regulations ranging from Singapore's Cybersecurity Act to China's Personal Information Protection Law are spurring localized SOC buildouts that blend global threat intelligence with in-country data processing.
Europe maintains steady expansion underpinned by NIS2, which extends mandatory 24/7 SOC coverage to roughly 350,000 critical entities. Data-sovereignty sensitivities drive preference for providers that operate regional clouds and support privacy-enhancing technologies. Economic incentives are emerging as insurers lower premiums for organizations demonstrating adherence to ENISA guidance, further embedding service consumption across mid-market and enterprise segments.
- International Business Machines (IBM) Corporation
- Accenture plc
- Cisco Systems, Inc.
- AT&T Cybersecurity (AT&T Inc.)
- Secureworks, Inc.
- McAfee, LLC
- Trellix LLC (Musarubra US LLC)
- Fortinet, Inc.
- Palo Alto Networks Inc.
- Check Point Software Technologies Ltd.
- CrowdStrike Holdings, Inc.
- Rapid7, Inc.
- Sophos Ltd
- Proofpoint Inc.
- Zscaler, Inc.
- FireEye, LLC
- Armor Defense Inc.
- Convergent Network Solutions Ltd.
- Transputec Ltd.
- Zeguro Inc.
- Sara Technologies Inc.
- Cloud24x7 Pvt. Ltd.
Additional Benefits:
- The market estimate (ME) sheet in Excel format
- 3 months of analyst support
TABLE OF CONTENTS
1 INTRODUCTION
- 1.1 Study Assumptions and Market Definition
- 1.2 Scope of the Study
2 RESEARCH METHODOLOGY
3 EXECUTIVE SUMMARY
4 MARKET LANDSCAPE
- 4.1 Market Overview
- 4.2 Market Drivers
- 4.2.1 Rising cost and frequency of data breaches
- 4.2.2 SME demand amid cyber-skills shortage
- 4.2.3 Cloud and remote-work-led attack surface expansion
- 4.2.4 Cyber-insurance clauses mandating continuous monitoring
- 4.2.5 Identity-centric security for API/M2M traffic
- 4.2.6 NIS2 and similar 24X7 SOC requirements for critical entities
- 4.3 Market Restraints
- 4.3.1 Data-sovereignty / vendor-lock-in concerns
- 4.3.2 Visibility gaps in multi-cloud environments
- 4.3.3 Targeted attacks on MSSP/CSaaS supply chain
- 4.3.4 Talent-cost inflation eroding provider margins
- 4.4 Industry Value Chain Analysis
- 4.5 Regulatory Landscape
- 4.6 Technological Outlook
- 4.7 Porter's Five Forces Analysis
- 4.7.1 Bargaining Power of Suppliers
- 4.7.2 Bargaining Power of Buyers
- 4.7.3 Threat of New Entrants
- 4.7.4 Threat of Substitutes
- 4.7.5 Competitive Rivalry
5 MARKET SIZE AND GROWTH FORECASTS (VALUE)
- 5.1 By End-user Enterprise Size
- 5.1.1 Small and Medium Enterprises (SMEs)
- 5.1.2 Large Enterprises
- 5.2 By Service Model
- 5.2.1 Managed Detection and Response (MDR)
- 5.2.2 SOC as a Service
- 5.2.3 Identity and Access Management as a Service
- 5.2.4 Vulnerability and Pen-Test as a Service
- 5.2.5 Compliance and Risk Assessment as a Service
- 5.2.6 Data Loss Prevention as a Service
- 5.3 By Security Type
- 5.3.1 Risk and Vulnerability Assessment
- 5.3.2 Threat Intelligence and Analytics
- 5.3.3 Auditing and Logging
- 5.3.4 Continuous Monitoring and Encryption
- 5.3.5 Identity and Access Management
- 5.3.6 Incident Response and Disaster Recovery aaS
- 5.4 By Deployment Mode
- 5.4.1 Public Cloud
- 5.4.2 Private Cloud
- 5.4.3 Hybrid Cloud
- 5.5 By End-user Industry
- 5.5.1 BFSI
- 5.5.2 Healthcare and Life Sciences
- 5.5.3 IT and Telecom
- 5.5.4 Government and Defense
- 5.5.5 Energy and Utilities
- 5.5.6 Retail and E-commerce
- 5.5.7 Manufacturing
- 5.6 Geography
- 5.6.1 North America
- 5.6.1.1 United States
- 5.6.1.2 Canada
- 5.6.1.3 Mexico
- 5.6.2 South America
- 5.6.2.1 Brazil
- 5.6.2.2 Argentina
- 5.6.2.3 Rest of South America
- 5.6.3 Europe
- 5.6.3.1 United Kingdom
- 5.6.3.2 Germany
- 5.6.3.3 France
- 5.6.3.4 Russia
- 5.6.3.5 Rest of Europe
- 5.6.4 Asia-Pacific
- 5.6.4.1 China
- 5.6.4.2 India
- 5.6.4.3 Japan
- 5.6.4.4 South Korea
- 5.6.4.5 Rest of Asia-Pacific
- 5.6.5 Middle East and Africa
- 5.6.5.1 Middle East
- 5.6.5.1.1 GCC
- 5.6.5.1.2 Turkey
- 5.6.5.1.3 Israel
- 5.6.5.1.4 Rest of Middle East
- 5.6.5.2 Africa
- 5.6.5.2.1 South Africa
- 5.6.5.2.2 Nigeria
- 5.6.5.2.3 Kenya
- 5.6.5.2.4 Rest of Africa
- 5.6.5.1 Middle East
- 5.6.1 North America
6 COMPETITIVE LANDSCAPE
- 6.1 Market Concentration
- 6.2 Strategic Moves
- 6.3 Market Share Analysis
- 6.4 Company Profiles (includes Global level Overview, Market level overview, Core Segments, Financials as available, Strategic Information, Market Rank/Share for key companies, Products and Services, Recent Developments)
- 6.4.1 International Business Machines (IBM) Corporation
- 6.4.2 Accenture plc
- 6.4.3 Cisco Systems, Inc.
- 6.4.4 AT&T Cybersecurity (AT&T Inc.)
- 6.4.5 Secureworks, Inc.
- 6.4.6 McAfee, LLC
- 6.4.7 Trellix LLC (Musarubra US LLC)
- 6.4.8 Fortinet, Inc.
- 6.4.9 Palo Alto Networks Inc.
- 6.4.10 Check Point Software Technologies Ltd.
- 6.4.11 CrowdStrike Holdings, Inc.
- 6.4.12 Rapid7, Inc.
- 6.4.13 Sophos Ltd
- 6.4.14 Proofpoint Inc.
- 6.4.15 Zscaler, Inc.
- 6.4.16 FireEye, LLC
- 6.4.17 Armor Defense Inc.
- 6.4.18 Convergent Network Solutions Ltd.
- 6.4.19 Transputec Ltd.
- 6.4.20 Zeguro Inc.
- 6.4.21 Sara Technologies Inc.
- 6.4.22 Cloud24x7 Pvt. Ltd.
7 MARKET OPPORTUNITIES and FUTURE OUTLOOK
- 7.1 White-space and Unmet-need Assessment

 門禁即服務 (ACaaS) 市場報告:趨勢、預測和競爭分析(至 2035 年)
 存取即服務 (ACaaS) 市場:按模型類型、服務類型、身分驗證模型、網路基地台、組織規模、部署模型和最終用戶分類-2026-2032 年全球市場預測
 2026年全球安全軟體即服務市場報告2026年全球程式碼簽章憑證即服務市場報告2026年全球門禁控制即服務市場報告
 全球SaaS(安全即服務)市場:市場規模、佔有率和趨勢分析(按類型、部署方式、定價模式、最終用途和地區分類),細分市場預測(2026-2033年)
 全球門禁服務市場規模、佔有率、趨勢及成長分析報告(2026-2034年)
 2026-2030年存取控制服務(ACAAS)市場
 存取控制服務市場規模、佔有率和成長分析(按存取控制模型、雲端部署模型、垂直行業和地區分類)—產業預測(2026-2033 年)
 門禁控制即服務市場-全球產業規模、佔有率、趨勢、機會和預測(按服務、部署方式、最終用途、地區和競爭格局分類,2020-2030 年預測)