


 |
市場調查報告書
商品編碼
2100544
浮體式生產儲卸油裝置(FPSO):市場佔有率分析、產業趨勢和統計數據以及成長預測(2026-2031 年)Floating Production Storage and Offloading (FPSO) - Market Share Analysis, Industry Trends & Statistics, Growth Forecasts (2026 - 2031) |
||||||

※ 本網頁內容可能與最新版本有所差異。詳細情況請與我們聯繫。
2025 年浮體式生產儲卸油船 (FPSO) 市值為 82.9 億美元,預計到 2031 年將達到 134.3 億美元,而 2026 年為 90.3 億美元,預測期內(2026-2031 年)的複合年成長率為 8.26%。
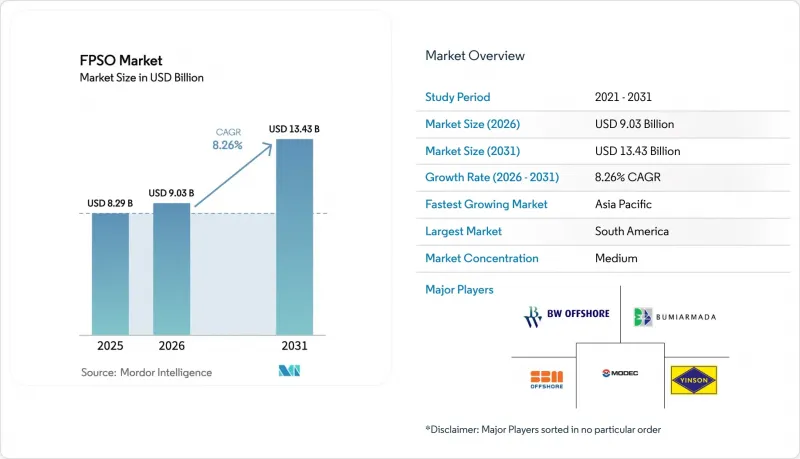
本報告按類型(改裝油輪和專用建造)、船體類型(雙殼和單殼)、推進系統(自航式FPSO和拖曳式FPSO)、水深(淺水、深海域和超深海域)、儲存能力(小於100萬桶、100萬至200萬桶和超過200萬桶)、200萬桶、100萬至200萬桶和超過200萬桶、儲存能力(
全球浮體式生產儲卸油船(FPSO)市場趨勢與洞察
疫情後深海計畫最終投資決定(FID)的恢復
巴西石油公司(Petrobras)已批准在2025年建造四艘鹽層下生產儲卸油船),總價值達180億美元。同時,埃克森美孚也批准在圭亞那的斯塔布布魯克區塊建造三艘日處理能力為25萬桶的FPSO。這與2020年至2021年間全球簽署的七份FPSO合約形成鮮明對比。預先設計的船體方案將決策週期從36個月縮短至24個月,改善了承包商的早期現金流前景。模組化上部模組為未來加裝碳捕集裝置預留了空間,從而平衡了當前預算與未來的監管合規性。深海油田的損益平衡點約為每桶35至40美元,能夠有效保護營運商的盈利免受油價波動的影響。由此產生的訂單積壓將確保造船廠的運作持續到2028年,並提振市場對浮體式生產儲卸油船(FPSO)市場的信心。
由於陸上蘊藏量枯竭,資本投資正轉移到海外。
目前,成熟的陸上油田產量正以每年6-8%的速度下降,導致資本轉向海上油田,預計未來20年海上油田的產量將保持穩定。沙烏地阿美計畫在2028年將其上游投資的35%分配給海上資產,高於2023年的22%。雪佛龍在墨西哥灣的FPSO產量已占公司總產量的18%,顯示這種轉變是永久性的。馬來西亞國家石油公司(Petronas)也效法此舉,為產量低於1億桶的邊際油田訂購了三艘FPSO,因為在這些油田上建造固定平台並不划算。儘管陸上頁岩油生產效率有所提高,但這種投資轉移仍然維持了浮體式生產儲卸油裝置(FPSO)市場的長期需求。
高額的初始資本支出(CAPEX)和較長的前置作業時間
專用FPSO造價在15億至35億美元之間,建造週期為4至5年,對小規模業者的財務狀況造成了沉重負擔。將現有船舶改造為FPSO可將成本降低至6億至12億美元,但仍需30至36個月,使工程面臨商品價格波動和利率上升的風險。利率上升已導致加權平均資本成本從7.5%上升至2025年的9.2%。鋼材價格波動迫使承包商採用價格上漲條款,進一步增加了預算編制的複雜性。這些趨勢正在減緩短期成長,儘管租賃模式在一定程度上抵消了這些障礙。
細分市場分析
改裝油輪具有資本投資減少30-40%、前置作業時間週期縮短至12-18個月等優勢,預計2025年,在浮體式生產儲卸油船(FPSO)市場規模中將佔65.1%的收入。儘管隨著單體船拆解速度加快,超大型原油運輸船(VLCC)的供應趨緊,且預計未來的改裝項目將受到限制,但由於現有船舶的重新部署,短期需求依然強勁。特殊設計的船體正以9.7%的複合年成長率快速成長,能夠滿足超過2000噸的超深海結構載荷需求,而改裝船舶則無法經濟有效地應對這些載荷。巴西石油公司(Petrobras)的「Mero-5」號油輪結合了加固船體和350萬桶的儲油能力,使其能夠在2200米深的海域作業,充分體現了對新型船舶的需求。
從中長期來看,像SBM Offshore的「Fast4Ward」這樣的混合方案正受到關注。該方案在中國製造標準化船體,然後客製化上層建築,旨在將新船的堅固性與改造速度相結合,從而保持浮體式生產儲卸油裝置(FPSO)市場的技術發展勢頭。
儘管單殼FPSO仍佔運作中船隊的58.9%,但根據國際海事組織(IMO)和北海相關法規的要求,雙殼FPSO的數量正以每年9.4%的速度成長,這些法規強制要求加強對溢油的防護。殼牌公司的「企鵝號」改造計畫儘管面臨12%的溢價,但仍選擇了雙殼設計,理由是可以節省保險費用並降低環境責任。像BW Offshore公司對「波爾沃號」一樣,對老舊的單殼船舶進行雙底維修只是權宜之計,直到強制更換成為現實。目前,保險公司對在敏感水域作業的單殼船舶加收15-20%的額外保費,這進一步加速了浮體式生產儲卸油船(FPSO)市場的結構性轉變。
此外,雙層船體之間的空隙處安裝了安定器系統,每年可減少運作因惡劣天氣停航約10天。對於日租金取決於運轉率的租賃經營承包商而言,這無疑是一項極具吸引力的營運優勢。
區域分析
2025年,南美洲將佔浮體式生產儲卸油船(FPSO)市場收入的33.3%。巴西是這一市場的核心,擁有18艘運作中的FPSO,日產量達210萬桶,損益平衡點約為每桶35-40美元。圭亞那正在提升其區域排名,計劃在2024年至2025年間新增三艘FPSO,目標是到2027年實現日產量80萬桶。儘管在地採購規則將使預算增加10-15%,但巴西各造船廠已形成一條擁有4.5萬名員工的供應鏈。
亞太地區是成長最快的地區,預計到2031年將以每年9.9%的速度成長。馬來西亞國家石油公司(Petronas)已中標朗勒巴(Lang Leba)、林巴永(Limbayon)和傑隆(Jellung)油田項目,每個項目的蘊藏量均不足1.5億桶,並將使用可重構設備進行運作。澳洲的巴羅薩(Barossa)FPSO已配備抗旋風可拆卸轉塔。同時,印度透過在孟買海(Mumbai Hai)運作其首艘深海裝置,展現了其業務多元化的態勢。中國國營企業中海油(CNOOC)憑藉其國內造船廠保持成本優勢,但技術轉移限制意味著其產品在海外競爭中鮮有勝算。
到2025年,中東和非洲佔總價值的22%。阿布達比國家石油公司(ADNOC)投資28億美元建造的酸性天然氣浮式生產儲卸油裝置(FPSO)採用酸性氣體注入技術,每年可封存230萬噸二氧化碳,與阿拉伯聯合大公國的淨零排放計畫緊密合作。奈及利亞的邦加西南油田和安哥拉的中期計畫阿戈戈油田是成熟盆地更新需求的典型例證。北美和歐洲佔銷售額的18%,墨西哥灣和挪威北海的業者正在嚴格的環境法規下,轉型為碳捕獲就緒型設備。
其他好處:
- Excel格式的市場預測(ME)表
- 3個月的分析師支持
目錄
第1章:引言
- 研究假設和市場定義
- 調查範圍
第2章:調查方法
第3章執行摘要
第4章 市場狀況
- 市場概覽
- 市場促進因素
- 疫情後深海計畫最終投資決定(FID)的恢復
- 由於陸上蘊藏量枯竭,資本投資正轉移到海外。
- 為企業降低資本支出(CAPEX)的承包租賃模式。
- 可移動的中型單元能夠開發邊際油田。
- 設計一艘具備碳捕集與封存能力的浮式生產儲卸油船,以實現範圍 1 的目標
- 專門用於天然氣的FPSO正在將未充分利用的天然氣貨幣化。
- 市場限制因素
- 高額的初始資本支出(CAPEX)和較長的前置作業時間
- 原油價格波動正在減緩最終投資決策(FID)。
- 船舶延壽和維修所需的船塢短缺
- 在地採購義務推高了成本
- 供應鏈分析
- 監理情勢
- 技術展望
- 波特五力模型
第5章 市場規模與成長預測
- 按類型
- 改裝油輪
- 客製化設計(新建)
- 依船體類型
- 雙體船
- 單體船
- 透過推進力
- 自航式FPSO
- 拖曳式FPSO
- 按水深
- 淺水區
- 深水
- 超深海
- 按儲存容量
- 不足100萬桶
- 100萬至200萬桶
- 超過200萬桶
- 按處理能力
- 石油FPSO
- 天然氣FPSO
- 混合(石油和天然氣)
- 按地區
- 北美洲
- 美國
- 加拿大
- 墨西哥
- 歐洲
- 德國
- 英國
- 西班牙
- 法國
- 義大利
- 挪威
- 荷蘭
- 俄羅斯
- 其他歐洲國家
- 亞太地區
- 中國
- 印度
- 日本
- 韓國
- 馬來西亞
- 新加坡
- 澳洲
- 其他亞太國家
- 南美洲
- 巴西
- 阿根廷
- 哥倫比亞
- 其他南美國家
- 中東和非洲
- 沙烏地阿拉伯
- 阿拉伯聯合大公國
- 卡達
- 南非
- 埃及
- 阿爾及利亞
- 其他中東和非洲國家
- 北美洲
第6章 競爭情勢
- 市場集中度
- 策略趨勢(併購、聯盟、購電協議)
- 市場佔有率分析(主要公司的市場排名和佔有率)
- 公司簡介
- FPSO Contractors
- SBM Offshore NV
- Modec Inc.
- BW Offshore Ltd.
- Yinson Holdings Bhd.
- Bumi Armada Bhd.
- Saipem SpA
- Keppel Offshore & Marine Ltd.
- Samsung Heavy Industries Co. Ltd.
- China Offshore Oil Engineering Co.
- Bluewater Holding BV
- Teekay Corp.
- Petrofac Ltd.
- MISC Berhad
- COSCO Shipping Heavy Industry
- FPSO Operators
- Petrobras
- CNOOC Ltd.
- TotalEnergies SE
- ExxonMobil Corp.
- Chevron Corp.
- Shell plc
- BP plc
- Equinor ASA
- Petronas
- ADNOC
- FPSO Contractors
第7章 市場機會與未來展望
According to Mordor Intelligence, the floating production storage and Offloading (FPSO) Market size was valued at USD 8.29 billion in 2025 and is estimated to grow from USD 9.03 billion in 2026 to reach USD 13.43 billion by 2031, at a CAGR of 8.26% during the forecast period (2026-2031).
This report is Segmented by Type (Converted Tanker and Purpose-Built), Hull Type (Double Hull and Single Hull), Propulsion (Self-Propelled FPSO and Towed FPSO), Water Depth (Shallow Water, Deep Water, and Ultra-Deep Water), Storage Capacity (Below 1 Mn Bbl, 1 To 2 Mn Bbl, and Above 2 Mn Bbl), Processing Capability (Oil FPSO, Gas FPSO, and Hybrid), and Geography (North America, Europe, Asia-Pacific, and More).
Global Floating Production Storage and Offloading (FPSO) Market Trends and Insights
Post-Pandemic Rebound in Deep-Water Project FIDs
Petrobras sanctioned four pre-salt FPSOs in 2025 valued at USD 18 billion, while ExxonMobil approved three 250,000 bpd units in Guyana's Stabroek block - in stark contrast to the seven global awards during 2020-2021. Pre-engineered hull programs trimmed decision cycles from 36 months to 24 months and improved early cash-flow visibility for contractors. Modular topsides preserve space to add carbon-capture units later, balancing current budgets with future regulatory compliance. With break-even costs near USD 35-40 per barrel, deep-water plays shield operator economics from price swings. The resulting backlog secures fabrication yards through 2028 and underpins confidence in the Floating Production Storage and Offloading (FPSO) Market.
Depleting Onshore Reserves Shifting CAPEX Offshore
Mature onshore reservoirs now decline 6-8% annually, steering capital toward offshore prospects where plateau profiles run 20 years. Saudi Aramco intends to devote 35% of upstream spending to offshore assets by 2028, up from 22% in 2023. Chevron's Gulf of Mexico FPSOs already provide 18% of its total production, underscoring the permanence of this pivot. Petronas followed suit, awarding three FPSOs for marginal fields under 100 million barrels that cannot justify fixed platforms. The redirection sustains long-cycle demand in the Floating Production Storage and Offloading (FPSO) Market even as onshore shale efficiency improves.
High Upfront CAPEX and Long Lead Times
Purpose-built units demand USD 1.5-3.5 billion and four-to-five-year execution windows, weighing on small operators' balance sheets. Conversions reduce cost to USD 600 million-1.2 billion but still span 30-36 months, exposing projects to commodity swings and rising interest rates that lifted weighted-average capital costs from 7.5% to 9.2% in 2025. Steel-price volatility pushed contractors to adopt escalation clauses, adding complexity to budgeting. These dynamics moderate near-term growth, but leasing models partly offset the barrier.
Other drivers and restraints analyzed in the detailed report include:
- Turn-Key Lease Models Lowering Operator CAPEX
- Redeployable Midsize Units Unlocking Marginal Fields
- Oil-Price Volatility Dampening FIDs
For complete list of drivers and restraints, kindly check the Table Of Contents.
Segment Analysis
Converted tankers captured 65.1% of 2025 revenue within the Floating Production Storage and Offloading (FPSO) Market size thanks to 30-40% capex savings and 12-18-month lead-time advantages. Tightening VLCC supply as single-hull scrapping accelerates, restraining future conversions, yet redeployments of existing units keep near-term demand vibrant. Purpose-built hulls, expanding at a 9.7% CAGR, satisfy ultra-deepwater structural loads above 2,000 tonnes that conversions cannot economically meet. Petrobras' Mero-5 demonstrates newbuild necessity, pairing a reinforced hull and 3.5 million-barrel storage to operate at 2,200 m water depth.
In the medium term, hybrid approaches such as SBM Offshore's Fast4Ward, which fabricates standardized hulls in China before topside customization, aim to blend newbuild integrity with conversion speed, sustaining technological momentum in the Floating Production Storage and Offloading (FPSO) Market.
Single-hull units still represent 58.9% of the installed fleet, but double-hull FPSOs are growing 9.4% annually under IMO and North Sea regulations that require enhanced spill protection. Shell's Penguins redevelopment selected a double-hull despite a 12% premium, citing insurance savings and lower environmental liability. Retrofitting older single-hulls with double-bottom plating, as BW Offshore did on Polvo, offers a bridge solution until replacement becomes mandatory. Insurers now add 15-20% surcharges for single-hulls in sensitive areas, reinforcing a structural pivot in the Floating Production Storage and Offloading (FPSO) Market.
Double-hull void spaces also house ballast systems that cut weather downtime by roughly 10 days annually, an operational edge attractive to lease-and-operate contractors who depend on uptime-indexed day rates.
Complete Report Scope:
- By Type
- Converted Tanker
- Purpose-built (Newbuild)
- By Hull Type
- Double Hull
- Single Hull
- By Propulsion
- Self-Propelled FPSO
- Towed FPSO
- By Water Depth
- Shallow Water
- Deep Water
- Ultra-deep Water
- By Storage Capacity
- Below 1 Mn Bbl
- 1 to 2 Mn Bbl
- Above 2 Mn Bbl
- By Processing Capability
- Oil FPSO
- Gas FPSO
- Hybrid (Oil and Gas)
- By Geography
- North America
- United States
- Canada
- Mexico
- Europe
- Germany
- United Kingdom
- Spain
- France
- Italy
- Norway
- Netherlands
- Russia
- Rest of Europe
- Asia-Pacific
- China
- India
- Japan
- South Korea
- Malaysia
- Singapore
- Australia
- Rest of Asia-Pacific
- South America
- Brazil
- Argentina
- Colombia
- Rest of South America
- Middle East and Africa
- Saudi Arabia
- United Arab Emirates
- Qatar
- South Africa
- Egypt
- Algeria
- Rest of Middle East and Africa
- North America
Geography Analysis
South America generated 33.3% of the 2025 Floating Production Storage and Offloading (FPSO) Market revenue, led by Brazil's 18 active units producing 2.1 million bpd at break-even costs near USD 35-40 per barrel. Guyana added three FPSOs between 2024-2025 and targets 800,000 bpd by 2027, reshaping regional rankings. Local-content rules inflate budgets by 10-15% but cultivate a 45,000-person supply chain across Brazilian yards.
Asia-Pacific is the fastest-growing territory, rising 9.9% annually to 2031. Petronas awarded Lang Lebah, Limbayong, and Jerun, each with under 150 million-barrel reserves, serviced by redeployable units. Australia's Barossa FPSO adds cyclone-proof disconnectable turrets, while India commissioned its first deep-water unit in Mumbai High, signaling diversification. China's state-owned CNOOC maintains cost advantages through domestic yards, yet its units seldom compete abroad due to technology-transfer constraints.
The Middle East and Africa collectively delivered 22% of the 2025 value. ADNOC's USD 2.8 billion sour-gas FPSO incorporates acid-gas injection to sequester 2.3 million t CO2 annually, dovetailing with the UAE's net-zero program. Nigeria's Bonga South-West and Angola's mid-life Agogo projects exemplify replacement demand in maturing basins. North America and Europe held 18% of revenue as Gulf of Mexico and Norwegian North Sea operators pivot toward carbon-capture-ready specifications under stringent environmental frameworks.
- FPSO Contractors
- FPSO Operators
Additional Benefits:
- The market estimate (ME) sheet in Excel format
- 3 months of analyst support
TABLE OF CONTENTS
1 Introduction
- 1.1 Study Assumptions & Market Definition
- 1.2 Scope of the Study
2 Research Methodology
3 Executive Summary
4 Market Landscape
- 4.1 Market Overview
- 4.2 Market Drivers
- 4.2.1 Post-pandemic rebound in deep-water project FIDs
- 4.2.2 Depleting on-shore reserves shifting CAPEX offshore
- 4.2.3 Turn-key lease models lowering operator CAPEX
- 4.2.4 Redeployable midsize units unlocking marginal fields
- 4.2.5 CCS-ready FPSO designs meeting Scope-1 targets
- 4.2.6 Gas-focused FPSOs monetising stranded gas
- 4.3 Market Restraints
- 4.3.1 High upfront CAPEX & long lead times
- 4.3.2 Oil-price volatility dampening FIDs
- 4.3.3 Dry-dock scarcity for life-extension conversions
- 4.3.4 Local-content mandates inflating costs
- 4.4 Supply-Chain Analysis
- 4.5 Regulatory Landscape
- 4.6 Technological Outlook
- 4.7 Porter's Five Forces
- 4.7.1 Bargaining Power of Suppliers
- 4.7.2 Bargaining Power of Buyers
- 4.7.3 Threat of New Entrants
- 4.7.4 Threat of Substitutes
- 4.7.5 Intensity of Rivalry
5 Market Size & Growth Forecasts
- 5.1 By Type
- 5.1.1 Converted Tanker
- 5.1.2 Purpose-built (Newbuild)
- 5.2 By Hull Type
- 5.2.1 Double Hull
- 5.2.2 Single Hull
- 5.3 By Propulsion
- 5.3.1 Self-Propelled FPSO
- 5.3.2 Towed FPSO
- 5.4 By Water Depth
- 5.4.1 Shallow Water
- 5.4.2 Deep Water
- 5.4.3 Ultra-deep Water
- 5.5 By Storage Capacity
- 5.5.1 Below 1 Mn Bbl
- 5.5.2 1 to 2 Mn Bbl
- 5.5.3 Above 2 Mn Bbl
- 5.6 By Processing Capability
- 5.6.1 Oil FPSO
- 5.6.2 Gas FPSO
- 5.6.3 Hybrid (Oil and Gas)
- 5.7 By Geography
- 5.7.1 North America
- 5.7.1.1 United States
- 5.7.1.2 Canada
- 5.7.1.3 Mexico
- 5.7.2 Europe
- 5.7.2.1 Germany
- 5.7.2.2 United Kingdom
- 5.7.2.3 Spain
- 5.7.2.4 France
- 5.7.2.5 Italy
- 5.7.2.6 Norway
- 5.7.2.7 Netherlands
- 5.7.2.8 Russia
- 5.7.2.9 Rest of Europe
- 5.7.3 Asia-Pacific
- 5.7.3.1 China
- 5.7.3.2 India
- 5.7.3.3 Japan
- 5.7.3.4 South Korea
- 5.7.3.5 Malaysia
- 5.7.3.6 Singapore
- 5.7.3.7 Australia
- 5.7.3.8 Rest of Asia-Pacific
- 5.7.4 South America
- 5.7.4.1 Brazil
- 5.7.4.2 Argentina
- 5.7.4.3 Colombia
- 5.7.4.4 Rest of South America
- 5.7.5 Middle East and Africa
- 5.7.5.1 Saudi Arabia
- 5.7.5.2 United Arab Emirates
- 5.7.5.3 Qatar
- 5.7.5.4 South Africa
- 5.7.5.5 Egypt
- 5.7.5.6 Algeria
- 5.7.5.7 Rest of Middle East and Africa
- 5.7.1 North America
6 Competitive Landscape
- 6.1 Market Concentration
- 6.2 Strategic Moves (M&A, Partnerships, PPAs)
- 6.3 Market Share Analysis (Market Rank/Share for key companies)
- 6.4 Company Profiles (includes Global level Overview, Market level overview, Core Segments, Financials as available, Strategic Information, Products & Services, and Recent Developments)
- 6.4.1 FPSO Contractors
- 6.4.1.1 SBM Offshore N.V.
- 6.4.1.2 Modec Inc.
- 6.4.1.3 BW Offshore Ltd.
- 6.4.1.4 Yinson Holdings Bhd.
- 6.4.1.5 Bumi Armada Bhd.
- 6.4.1.6 Saipem SpA
- 6.4.1.7 Keppel Offshore & Marine Ltd.
- 6.4.1.8 Samsung Heavy Industries Co. Ltd.
- 6.4.1.9 China Offshore Oil Engineering Co.
- 6.4.1.10 Bluewater Holding BV
- 6.4.1.11 Teekay Corp.
- 6.4.1.12 Petrofac Ltd.
- 6.4.1.13 MISC Berhad
- 6.4.1.14 COSCO Shipping Heavy Industry
- 6.4.2 FPSO Operators
- 6.4.2.1 Petrobras
- 6.4.2.2 CNOOC Ltd.
- 6.4.2.3 TotalEnergies SE
- 6.4.2.4 ExxonMobil Corp.
- 6.4.2.5 Chevron Corp.
- 6.4.2.6 Shell plc
- 6.4.2.7 BP plc
- 6.4.2.8 Equinor ASA
- 6.4.2.9 Petronas
- 6.4.2.10 ADNOC
- 6.4.1 FPSO Contractors
7 Market Opportunities & Future Outlook
- 7.1 White-space & Unmet-need Assessment

 全球浮體式生產儲運設備市場規模、佔有率、趨勢和成長分析報告(2026-2034年)
 浮式生產儲油卸油設備(FPSO)市場規模、佔有率和成長分析(按類型、推進方式、船體類型、應用和地區分類)-2026-2033年產業預測
 FPSO市場分析及2034年預測:類型、產品、服務、技術、組件、應用、流程、最終用戶、安裝類型、設備
 浮式生產儲油卸油設備(FPSO) 全球市場規模、佔有率、趨勢分析報告:按類型、推進、應用、船舶類型、地區、展望和預測,2024-2031 年
 FPSO 市場機會、成長動力、產業趨勢分析與 2025 - 2034 年預測