


 |
市場調查報告書
商品編碼
2100528
甲醇:市場佔有率分析、產業趨勢與統計、成長預測(2026-2031)Methanol - Market Share Analysis, Industry Trends & Statistics, Growth Forecasts (2026 - 2031) |
||||||

※ 本網頁內容可能與最新版本有所差異。詳細情況請與我們聯繫。
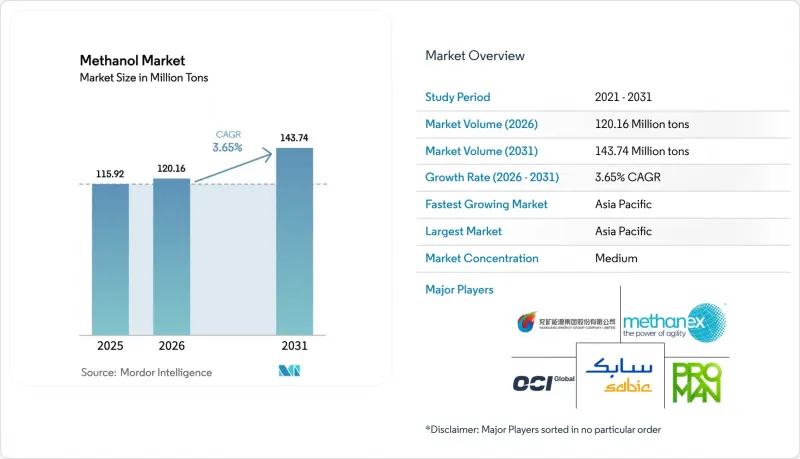
根據 Mordor Intelligence 預測,甲醇市場預計將從 2025 年的 1.1592 億噸成長到 2026 年的 1.2016 億噸,到 2031 年達到 1.4374 億噸,預計 2026 年至 2031 年的複合年成長率為 3.65%。
本報告按原料(天然氣、煤炭等)、衍生產品/應用(傳統化學品和能源相關產品)、終端用戶產業(汽車和運輸、化學產品等)、等級(化工級、燃料級等)以及地區(亞太地區、北美地區、歐洲地區、南美地區、中東和非洲地區)進行細分。市場預測以噸為單位。
全球甲醇市場趨勢及洞察
中國、美國和新興亞洲國家石化產能擴張
在中國,2024年至2025年間,每年新增超過1,000萬噸煤製甲醇產能,主要集中在內蒙古和陝西省。在這些地區,即使在現行環境課稅下,煤炭仍具有成本競爭力。美國墨西哥灣沿岸地區的生產商利用亨利樞紐天然氣(預計2026年價格約為每百萬英熱單位4美元)以優惠的分銷成本向拉丁美洲進口商供貨。在越南、泰國和印尼,由於甲醛和乙酸產能超過國內供應,進口需求增加。這縮小了甲醇市場從亞洲到歐洲的現貨價格差,迫使貿易商最佳化車隊配置。如果房地產市場活動放緩的速度超過甲醇向烯烴的需求吸收速度,產能擴張將增加供應過剩的風險。這凸顯了靈活的提貨安排和與下游產業的整合的重要性。
航運業向低碳燃料轉型-引進綠色甲醇
國際海事組織(IMO)規定,2030年,船舶排放強度需降低20%,2050年達到淨零排放。碳排放罰款從2028年起為每噸二氧化碳當量100美元,此後逐步增加。馬士基已簽訂契約,每年採購50萬噸綠色甲醇,併計劃到2027年投入使用25艘雙燃料船舶,積極應對全球加油樞紐的基礎設施瓶頸。達飛輪船(CMA CGM)和地中海航運(MSC)的類似舉措可望將航運業到2030年每年吸收1,300萬噸綠色甲醇,約佔2026年全球甲醇市場供應量的9%。 2025年綠色甲醇的溢價(每噸200-400美元)反映了可再生能源投入成本和排碳權的價值。全球僅有 15 個港口具備有限的加油能力,這是一個瓶頸。但隨著碳排放稅的引進已成定局,鹿特丹和新加坡相繼宣布了碼頭維修計畫。
原物料價格波動
2024年至2025年間,北美天然氣價格在每百萬英熱單位2美元至6美元之間波動,每波動1美元,甲醇生產成本就會增加約30美元/噸。 2025年,中國煤炭現貨價格在每噸800元至1,200元人民幣之間,高硫煤的環境稅進一步削弱了其成本優勢。擁有自有礦山或長期天然氣供應合約的生產商能夠維持運轉率,但獨立工廠在價格飆升期間將運轉率降至70%以下。雙原料方案和合約生產協議正逐漸成為避險工具,但價差擴大會削弱利潤成長。
細分市場分析
到2025年,天然氣製甲醇將佔據65.12%的市場佔有率,這主要得益於美國墨西哥灣沿岸和中東地區的低成本供應。可再生燃料的複合年成長率(CAGR)為5.07%,成長率高於整體市場。 Enerkem公司的瓦倫工廠透過收取廠門費和排碳權來獲利,在強力的政策獎勵下展現出卓越的經濟效益。 Repsol公司的塔拉戈納計畫於2029年運作,顯示儘管資本密集度高,但歐洲轉型為循環燃料的步伐正在加快。在中國,煤炭仍然扮演著重要角色,但更嚴格的空氣品質法規和環境稅的引入正在擠壓煤炭的利潤空間。新興的「二氧化碳+綠氫」路線雖然規模較小,但卻得到了強而有力的政策支持,預示著未來供應多元化的趨勢。
儘管目前全球可再生能源甲醇市場規模仍然較小,但碳定價的長期前景表明,資本配置將持續轉移到這些管道。能夠靈活地在天然氣、煤炭和廢棄物衍生能源之間進行套利的生產商,將能夠更柔軟性平衡合規溢價與原料成本波動。領先達成廢棄物分類夥伴關係和可再生能源合約的企業,將能夠隨著監管標準的逐步提高,鞏固其利潤優勢。
至2025年,能源相關衍生物將佔甲醇市場總量的54.34%,預計到2031年將以4.18%的複合年成長率成長,成長率高於傳統化工應用領域。中國20座甲醇製石油轉化(MTO)裝置以及不斷成長的甲醇燃料船舶船隊正在支撐這一成長趨勢。印尼和越南的二甲醚試點計畫被視為柴油燃料的替代品,預計將進一步擴大其在能源領域的應用。同時,由於環保法規的限制,北美和歐洲對甲基叔丁基醚(MTBE)的需求正在下降,但中國二線城市將其與汽油混合使用,在一定程度上抵消了這一降幅。
傳統化學衍生物仍佔全球需求的三分之一,其中甲醛與建設活動密切相關,而醋酸則與包裝和紡織業緊密相連。成長率的差異表明,供應成長將嚴重偏向能源應用領域,這可能導致化學品買家面臨供應緊張,並在原油價格上漲期間加劇因品質差異而導致的價格差距擴大。
區域分析
亞太地區將在2025年佔據甲醇市場78.10%的佔有率,並預計到2031年將以3.91%的複合年成長率成長。中國每年5000萬噸煤炭製甲醇的能力以及其積極推進的甲醇製油(MTO)項目,鞏固了該地區的主導地位。在印度,透過煤炭氣化和政策支持的燃料摻混實現自給自足的努力,推動了甲醇需求的成長。在東南亞,為滿足建築業對甲醛的需求,進口量持續增加。日本和韓國仍是甲醇淨進口國,主要進口用於電子和汽車產業的高純度甲醇。
北美保持著中等個位數的市場佔有率,這主要得益於Metanex公司位於蓋斯瑪的天然氣生產基地和Enerchem公司新建的可再生能源產能。低成本的頁岩氣和接近性拉丁美洲市場的地理優勢為其提供了結構性優勢,但液化天然氣出口的增加正在冬季高峰期加劇國內天然氣供需失衡。加拿大對廢棄物甲醇的重視凸顯了政策主導的多元化發展,而墨西哥的需求則與汽車和建設產業的商業週期密切相關。
儘管歐洲的佔有率較小,但由於其正在向電子甲醇轉型,因此佔據著重要的戰略地位。創新基金的津貼、OCI公司將其設施維修為生產藍色甲醇,以及雷普索爾公司在塔拉戈納的投資,都體現了歐洲致力於向低碳供應領域進行資本投資的決心。鹿特丹港的目標是到2030年實現年燃料庫量200萬噸,從而將該地區打造成為綠色甲醇的貿易中心。碳邊境調節機制(CBAM)正在增強低碳國內生產商相對於高碳進口產品的競爭力。
南美洲和中東/非洲各佔甲醇市場佔有率約5.5%。巴西的甲醇需求主要依賴生質柴油和建設產業,而阿根廷正在探索與瓦卡穆爾塔頁岩相關的天然氣製甲醇(GTM)計畫。中東地區利用廉價的聯產氣出口到亞洲,從而維持了成本優勢。非洲的需求依賴進口,並受外匯波動和物流成本的限制,但採礦業和建設產業提供了穩定的基礎消費。
其他好處:
- Excel格式的市場預測(ME)表
- 3個月的分析師支持
目錄
第1章:引言
- 研究假設和市場定義
- 調查範圍
第2章:調查方法
第3章執行摘要
第4章 市場狀況
- 市場概覽
- 市場促進因素
- 擴大中國、美國和新興亞洲國家的石化產品產能。
- 航運業向低碳燃料轉型:引進綠色甲醇
- 擴大甲醇制烯烴轉化製程的應用
- 擴大廢棄物。
- 二氧化碳利用中心推動歐洲對電子甲醇的需求。
- 市場限制因素
- 原物料價格波動
- 甲醇處理相關的健康與安全風險
- 生物基MPG與RNG在船舶脫碳領域的競爭
- 價值鏈分析
- 技術展望
- 波特五力模型
- 主要原料產能分析
- 貿易流量分析
- 價格趨勢和預測
第5章 市場規模與成長預測
- 按原料
- 天然氣
- 煤炭
- 可再生資源(生質能、都市固態廢棄物)
- 其他(二氧化碳、綠氫、石油殘渣)
- 透過衍生性商品/透過應用
- 傳統化學品
- 甲醛
- 醋酸
- 溶劑
- 甲胺
- 其他常規化學品
- 能源相關
- 甲醇制烯烴(MTO)
- 甲基叔丁基醚(MTBE)
- 汽油混合物
- 二甲醚(DME)
- 生質柴油
- 傳統化學品
- 產業最終用途
- 汽車和運輸業
- 化學品
- 船用燃料
- 其他(電子產品、電力)
- 按年級
- 化學級
- 燃料等級
- 其他(超淨/電池級和可再生(生物/電化學甲醇))
- 按地區
- 亞太地區
- 中國
- 印度
- 日本
- 韓國
- 越南
- 泰國
- 印尼
- 馬來西亞
- 澳洲
- 紐西蘭
- 其他亞太國家
- 北美洲
- 美國
- 加拿大
- 墨西哥
- 歐洲
- 德國
- 英國
- 義大利
- 法國
- 土耳其
- 俄羅斯
- 北歐的
- 西班牙
- 其他歐洲國家
- 南美洲
- 巴西
- 阿根廷
- 哥倫比亞
- 其他南美國家
- 中東和非洲
- 沙烏地阿拉伯
- 卡達
- 阿拉伯聯合大公國
- 南非
- 奈及利亞
- 埃及
- 其他中東和非洲國家
- 亞太地區
第6章 競爭情勢
- 市場集中度
- 策略趨勢
- 市佔率和排名分析
- 公司簡介
- Atlantic Methanol
- BASF SE
- Carbon Recycling International(CRI)
- Celanese Corporation
- China National Chemical Corporation(ChemChina)
- Coogee
- Enerkem
- Eni SpA
- Gujarat State Fertilizers & Chemicals Limited(GSFC)
- INEOS
- Kaveh Methanol Company
- Kingboard Holdings Limited
- LyondellBasell Industries Holdings BV
- Methanex Corporation
- MITSUBISHI GAS CHEMICAL COMPANY, INC
- Natgasoline
- OCI
- Petroliam Nasional Berhad(PETRONAS)
- Proman
- SABIC
- Ningxia Baofeng Energy Group
- Yankuang Energy Group Company Limited
- ZPC Integrated Refining & Petrochemical(Zhejiang)
第7章 市場機會與未來展望
According to Mordor Intelligence, the methanol market size is expected to increase from 115.92 million tons in 2025 to 120.16 million tons in 2026 and reach 143.74 million tons by 2031, growing at a CAGR of 3.65% over 2026-2031.
This report is Segmented by Feedstock (Natural Gas, Coal, and More), Derivative/Application (Traditional Chemical and Energy-Related), End-Use Industry (Automotive and Transportation, Chemicals, and More), Grade (Chemical Grade, Fuel Grade, and Others), and Geography (Asia-Pacific, North America, Europe, South America, and Middle East and Africa). Market Forecasts are Provided in Terms of Volume (tons).
Global Methanol Market Trends and Insights
Expanding Petrochemical Capacity in China, US, and Emerging Asia
China added more than 10 million tons per year of coal-to-methanol capacity between 2024 and 2025, primarily in Inner Mongolia and Shaanxi, where coal remains cost-competitive under current environmental levies. US Gulf Coast producers leveraged Henry Hub gas near USD 4.00 per million Btu in 2026 to supply Latin American importers at a delivered-cost advantage. Import demand in Vietnam, Thailand, and Indonesia rose as formaldehyde and acetic-acid capacity outpaced indigenous supply, compressing methanol market Asia-to-Europe spot differentials and forcing traders to optimize fleet allocation. Capacity additions raise an over-supply risk should real-estate activity soften faster than methanol-to-olefins absorption, underscoring the importance of flexible offtake structures and downstream integration.
Marine Sector Shift to Low-Carbon Fuels - Green Methanol Adoption
The International Maritime Organization mandates a 20% emissions-intensity cut by 2030 and net-zero by 2050, with carbon penalties beginning at USD 100 per ton CO2-equivalent in 2028 and escalating thereafter. Maersk contracted 500,000 tons per year of green methanol and is deploying 25 dual-fuel vessels by 2027, front-running infrastructure constraints at global bunkering hubs. Similar commitments from CMA CGM and MSC suggest shipping could absorb 13 million tons annually by 2030, equal to roughly 9% of the 2026 global methanol market supply. Green-methanol premiums of USD 200-400 per ton in 2025 mirror renewable-energy input costs and carbon-credit value capture. Limited refueling capacity at only 15 ports worldwide creates a bottleneck, yet high carbon-levy visibility is accelerating terminal-upgrade announcements in Rotterdam and Singapore.
Feedstock Price Volatility
North American gas ranged between USD 2.00 and USD 6.00 per million Btu during 2024-2025, with each USD 1.00 swing adding roughly USD 30 per ton to to methanol market production cost. Chinese coal spot prices moved between CNY 800 and CNY 1,200 per ton in 2025; environmental levies on high-sulfur coal further eroded cost advantages. Producers with integrated coal mines or long-term gas supply managed higher utilizations, whereas merchant plants cut operating rates below 70% during price spikes. Dual-feedstock designs and tolling agreements are emerging as hedge mechanisms, but dilute upside when spreads widen.
Other drivers and restraints analyzed in the detailed report include:
- Increasing Use of Methanol-to-Olefins Routes
- Waste-to-Methanol Projects Scaling via MSW Gasification
- Health and Safety Hazards of Methanol Handling
For complete list of drivers and restraints, kindly check the Table Of Contents.
Segment Analysis
Natural-gas feedstock controlled 65.12% of the Methanol market share in 2025, anchored by low-cost supply in the US Gulf Coast and the Middle East. Renewable feedstock is expanding at a 5.07% CAGR, outpacing the overall market. Enerkem's Varennes plant monetizes both gate fees and carbon credits, illustrating superior economics under robust policy incentives. Repsol's Tarragona project, due in 2029, signals European momentum toward circular feedstock despite higher capital intensity. Coal remains relevant in China, yet tightening air-quality rules and environmental levies are squeezing margins. Emerging CO2-plus-green-hydrogen routes are subscale but enjoy strong policy tailwinds, hinting at future supply diversification.
The global methanol market size attributable to renewable feedstock remains small today, yet long-term visibility on carbon pricing suggests a sustained shift in capital allocation toward these pathways. Producers capable of arbitraging between gas, coal, and waste-derived feedstocks will gain flexibility in balancing compliance premiums against feedstock cost volatility. Early movers that secure waste-sorting partnerships and renewable-power contracts are likely to lock in margin advantages as regulatory thresholds ratchet upward.
Energy-related derivatives held 54.34% of 2025 methanol market volume and are projected to grow at a 4.18% CAGR through 2031, faster than traditional chemical uses. Twenty MTO units in China and a rising fleet of methanol-fueled vessels underpin this trajectory. Dimethyl ether pilots in Indonesia and Vietnam show promise as diesel substitutes, further broadening the energy footprint. Conversely, MTBE demand is retreating in North America and Europe due to environmental restrictions, although gasoline blending in Chinese tier-2 cities is offsetting some of the decline.
Traditional chemical derivatives still anchor one-third of global demand, with formaldehyde tied to construction activity and acetic acid linked to packaging and textiles. The divergence in growth rates suggests incremental supply will tilt toward energy applications, tightening availability for chemical buyers during crude-oil up-cycles and potentially widening quality-based price differentials.
Complete Report Scope:
- By Feedstock
- Natural Gas
- Coal
- Renewable (Biomass, Municipal Solid Waste)
- Others (Carbon Dioxide, Green Hydrogen, Petroleum Residues)
- By Derivative / Application
- Traditional Chemical
- Formaldehyde
- Acetic Acid
- Solvents
- Methylamines
- Other Traditional Chemicals
- Energy-related
- Methanol-to-Olefins (MTO)
- Methyl Tert-Butyl Ether (MTBE)
- Gasoline Blending
- Dimethyl Ether (DME)
- Biodiesel
- Traditional Chemical
- By End-use Industry
- Automotive & Transportation
- Chemicals
- Marine Fuel
- Others (Electronics, Power)
- By Grade
- Chemical Grade
- Fuel Grade
- Others (Ultra-Clean/Battery Grade and Renewable (Bio-/E-Methanol))
- By Geography
- Asia-Pacific
- China
- India
- Japan
- South Korea
- Vietnam
- Thailand
- Indonesia
- Malaysia
- Australia
- New Zealand
- Rest of Asia-Pacific
- North America
- United States
- Canada
- Mexico
- Europe
- Germany
- United Kingdom
- Italy
- France
- Turkey
- Russia
- Nordics
- Spain
- Rest of Europe
- South America
- Brazil
- Argentina
- Colombia
- Rest of South America
- Middle East and Africa
- Saudi Arabia
- Qatar
- United Arab Emirates
- South Africa
- Nigeria
- Egypt
- Rest of Middle East & Africa
- Asia-Pacific
Geography Analysis
Asia-Pacific dominated the methanol market with a 78.10% share in 2025 and is forecast to grow at a 3.91% CAGR through 2031. China's 50 million tons per year coal-to-methanol capacity and aggressive MTO expansion underpin regional leadership. India's push for self-sufficiency through coal gasification and policy-backed fuel blending adds incremental demand. Southeast Asian imports continue rising to serve construction-driven formaldehyde needs. Japan and South Korea remain net importers, focusing on high-purity methanol for electronics and automotive uses.
North America maintained a mid-single-digit share, with Methanex's Geismar complex and new renewable capacity from Enerkem anchoring supply. Low-cost shale gas and proximity to Latin American markets offer a structural advantage, though LNG export growth is tightening domestic gas balances during winter peaks. Canada's focus on waste-to-methanol highlights policy-driven diversification, while Mexico's demand tracks automotive and construction cycles.
Europe's share is small but strategically important due to its pivot toward e-methanol. Innovation-Fund grants, OCI's blue-methanol retrofit, and Repsol's Tarragona investment demonstrate capital commitment to low-carbon supply. The Port of Rotterdam targets 2 million tons per year of bunkering capacity by 2030, positioning the region as a trading hub for green methanol. The Carbon Border Adjustment Mechanism strengthens the competitive position of low-carbon domestic producers versus high-carbon imports.
South America and the Middle East & Africa each hold mid-single-digit shares of the methanol market. Brazil's methanol demand is tied to biodiesel and construction, while Argentina explores gas-to-methanol projects linked to Vaca Muerta shale. The Middle East remains a cost leader, leveraging cheap associated gas to export to Asia. African demand is import-dependent and constrained by currency volatility and logistics costs, though mining and construction provide stable baseline consumption.
- Atlantic Methanol
- BASF SE
- Carbon Recycling International (CRI)
- Celanese Corporation
- China National Chemical Corporation (ChemChina)
- Coogee
- Enerkem
- Eni S.p.A.
- Gujarat State Fertilizers & Chemicals Limited (GSFC)
- INEOS
- Kaveh Methanol Company
- Kingboard Holdings Limited
- LyondellBasell Industries Holdings B.V.
- Methanex Corporation
- MITSUBISHI GAS CHEMICAL COMPANY, INC
- Natgasoline
- OCI
- Petroliam Nasional Berhad (PETRONAS)
- Proman
- SABIC
- Ningxia Baofeng Energy Group
- Yankuang Energy Group Company Limited
- ZPC Integrated Refining & Petrochemical (Zhejiang)
Additional Benefits:
- The market estimate (ME) sheet in Excel format
- 3 months of analyst support
TABLE OF CONTENTS
1 Introduction
- 1.1 Study Assumptions & Market Definition
- 1.2 Scope of the Study
2 Research Methodology
3 Executive Summary
4 Market Landscape
- 4.1 Market Overview
- 4.2 Market Drivers
- 4.2.1 Expanding petrochemical capacity in China, US, and emerging Asia
- 4.2.2 Marine sector shift to low-carbon fuels - green methanol adoption
- 4.2.3 Increasing use of methanol-to-olefins routes
- 4.2.4 Waste-to-methanol projects scaling via MSW gasification
- 4.2.5 CO2-utilisation hubs driving e-methanol demand in Europe
- 4.3 Market Restraints
- 4.3.1 Feedstock price volatility
- 4.3.2 Health and safety hazards of methanol handling
- 4.3.3 Competition from bio-MPG and RNG in marine decarbonisation
- 4.4 Value Chain Analysis
- 4.5 Technological Outlook
- 4.6 Porter's Five Forces
- 4.6.1 Bargaining Power of Suppliers
- 4.6.2 Bargaining Power of Buyers
- 4.6.3 Threat of New Entrants
- 4.6.4 Threat of Substitutes
- 4.6.5 Degree of Competition
- 4.7 Production Capacity Analysis by Key Feedstock
- 4.8 Trade Flow Analysis
- 4.9 Pricing Trends and Forecasts
5 Market Size & Growth Forecasts (Value & Volume)
- 5.1 By Feedstock
- 5.1.1 Natural Gas
- 5.1.2 Coal
- 5.1.3 Renewable (Biomass, Municipal Solid Waste)
- 5.1.4 Others (Carbon Dioxide, Green Hydrogen, Petroleum Residues)
- 5.2 By Derivative / Application
- 5.2.1 Traditional Chemical
- 5.2.1.1 Formaldehyde
- 5.2.1.2 Acetic Acid
- 5.2.1.3 Solvents
- 5.2.1.4 Methylamines
- 5.2.1.5 Other Traditional Chemicals
- 5.2.2 Energy-related
- 5.2.2.1 Methanol-to-Olefins (MTO)
- 5.2.2.2 Methyl Tert-Butyl Ether (MTBE)
- 5.2.2.3 Gasoline Blending
- 5.2.2.4 Dimethyl Ether (DME)
- 5.2.2.5 Biodiesel
- 5.2.1 Traditional Chemical
- 5.3 By End-use Industry
- 5.3.1 Automotive & Transportation
- 5.3.2 Chemicals
- 5.3.3 Marine Fuel
- 5.3.4 Others (Electronics, Power)
- 5.4 By Grade
- 5.4.1 Chemical Grade
- 5.4.2 Fuel Grade
- 5.4.3 Others (Ultra-Clean/Battery Grade and Renewable (Bio-/E-Methanol))
- 5.5 By Geography
- 5.5.1 Asia-Pacific
- 5.5.1.1 China
- 5.5.1.2 India
- 5.5.1.3 Japan
- 5.5.1.4 South Korea
- 5.5.1.5 Vietnam
- 5.5.1.6 Thailand
- 5.5.1.7 Indonesia
- 5.5.1.8 Malaysia
- 5.5.1.9 Australia
- 5.5.1.10 New Zealand
- 5.5.1.11 Rest of Asia-Pacific
- 5.5.2 North America
- 5.5.2.1 United States
- 5.5.2.2 Canada
- 5.5.2.3 Mexico
- 5.5.3 Europe
- 5.5.3.1 Germany
- 5.5.3.2 United Kingdom
- 5.5.3.3 Italy
- 5.5.3.4 France
- 5.5.3.5 Turkey
- 5.5.3.6 Russia
- 5.5.3.7 Nordics
- 5.5.3.8 Spain
- 5.5.3.9 Rest of Europe
- 5.5.4 South America
- 5.5.4.1 Brazil
- 5.5.4.2 Argentina
- 5.5.4.3 Colombia
- 5.5.4.4 Rest of South America
- 5.5.5 Middle East and Africa
- 5.5.5.1 Saudi Arabia
- 5.5.5.2 Qatar
- 5.5.5.3 United Arab Emirates
- 5.5.5.4 South Africa
- 5.5.5.5 Nigeria
- 5.5.5.6 Egypt
- 5.5.5.7 Rest of Middle East & Africa
- 5.5.1 Asia-Pacific
6 Competitive Landscape
- 6.1 Market Concentration
- 6.2 Strategic Moves
- 6.3 Market Share/Ranking Analysis
- 6.4 Company Profiles (includes Global level Overview, Market level overview, Core Segments, Financials as available, Strategic Information, Market Rank/Share for key companies, Products & Services, and Recent Developments)
- 6.4.1 Atlantic Methanol
- 6.4.2 BASF SE
- 6.4.3 Carbon Recycling International (CRI)
- 6.4.4 Celanese Corporation
- 6.4.5 China National Chemical Corporation (ChemChina)
- 6.4.6 Coogee
- 6.4.7 Enerkem
- 6.4.8 Eni S.p.A.
- 6.4.9 Gujarat State Fertilizers & Chemicals Limited (GSFC)
- 6.4.10 INEOS
- 6.4.11 Kaveh Methanol Company
- 6.4.12 Kingboard Holdings Limited
- 6.4.13 LyondellBasell Industries Holdings B.V.
- 6.4.14 Methanex Corporation
- 6.4.15 MITSUBISHI GAS CHEMICAL COMPANY, INC
- 6.4.16 Natgasoline
- 6.4.17 OCI
- 6.4.18 Petroliam Nasional Berhad (PETRONAS)
- 6.4.19 Proman
- 6.4.20 SABIC
- 6.4.21 Ningxia Baofeng Energy Group
- 6.4.22 Yankuang Energy Group Company Limited
- 6.4.23 ZPC Integrated Refining & Petrochemical (Zhejiang)
7 Market Opportunities & Future Outlook
- 7.1 White-space & Unmet-Need Assessment

 甲醇經濟市場預測至2034年-按甲醇類型、原料、生產技術、通路、應用、最終用戶和地區分類的全球分析
 甲醇市場:依來源、生產方法、純度、碳強度、應用、終端用戶產業和通路分類-2026-2032年全球市場預測
 全球甲醇市場(2026-2036 年)甲醇市場規模、佔有率、成長及全球產業分析:按類型和應用分類,區域洞察及2026-2034年預測碳再生甲醇市場:依排放源、原料類型、生產技術及最終用戶分類-2026-2032年全球預測甲醇加熱器市場:按類型、容量、安裝方式、應用領域和分銷管道分類,全球預測(2026-2032年)
 甲醇市場分析及預測(至2035年):類型、產品、應用、技術、最終用戶、製程、組件、安裝類型、解決方案和模式全球甲醇市場規模、佔有率、趨勢和成長分析報告(2026-2034年)
 2026年全球二氧化碳再生甲醇市場報告
 甲醇市場-全球產業規模、佔有率、趨勢、機會、預測:按來源、最終用戶、地區和競爭對手分類,2021-2031年