


 |
市場調查報告書
商品編碼
2100524
光電:市場佔有率分析、產業趨勢與統計、成長預測(2026-2031)Photonics - Market Share Analysis, Industry Trends & Statistics, Growth Forecasts (2026 - 2031) |
||||||

※ 本網頁內容可能與最新版本有所差異。詳細情況請與我們聯繫。
根據 Mordor Intelligence 預測,光電市場規模預計將在 2026 年達到 1.46 兆美元,並在 2031 年擴大到 1.79 兆美元,預測期內複合年成長率為 4.16%。
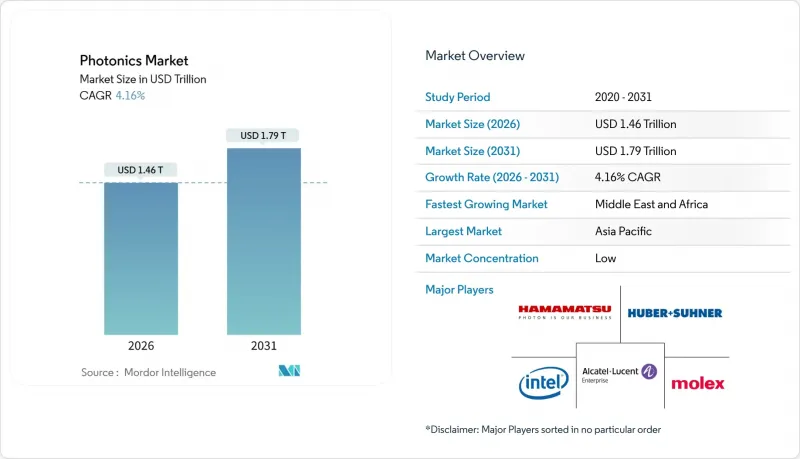
本報告按產品(雷射、LED、感測器和檢測器、波導管、調製器和開關、其他)、材料(矽、玻璃和二氧化矽、其他)、波長(紫外線、可見光、紅外線)、航空終端用戶產業(消費性電子、航太與國防、其他)以及航太地區進行細分。市場預測以美元計價。
全球光電市場趨勢與洞察
資料中心互連的激增正在推動對矽光電收發器的需求。
為了降低人工智慧訓練叢集的延遲和功耗,超大規模營運商正在將Gigabit的插入式光學模組升級到Gigabit、 Terabit的共封裝模組。英特爾報告稱,受GPU晶片出貨量(每個晶片包含超過1萬個加速器)的推動,2024年矽光電銷售額將年增40%。 [2] Lumentum的Terabit雲端人工智慧平台實現了15瓦的熱設計功耗(TDP),促使資料中心設計人員以板載光學模組取代分立式收發器。因此,傳統模組供應商正在收購光子積體電路設計公司以維持其毛利率。這種產能擴張導致磷化銦(InP)增益晶片供不應求,而日本和美國的基板產能仍僅限於100mm晶圓。
中國汽車製造商採用基於雷射雷達的ADAS系統的現狀
中國電動車品牌的目標是到2025年為120萬輛乘用車配備雷射雷達感測器,達到18%的滲透率,遠高於歐美7%的水準。比亞迪的「Seal」和「Han」車型採用了和賽電子價值500美元的固態雷射雷達單元,成本僅為機械掃描方案的一半。蔚來汽車則採用了一套結合了Innovusion公司1550奈米光纖雷射和遠距離感測功能的系統,歐盟監管機構正在評估該系統是否符合L3級自動駕駛認證標準。雷射雷達的快速普及正在壓縮砷化鎵邊發射雷射的成本曲線,使得二級供應商能夠在2026年底前將模組價格控制在300美元以下。這一趨勢也帶動了對矽崩光二極體和高頻驅動積體電路的需求。
化合物半導體晶圓(InP、GaN:小於150mm)的瓶頸
磷化銦和氮化鎵基板的尺寸仍僅限於 100 毫米和 150 毫米,晶圓價格分別為 1500 美元和 800 美元。相比之下,300 毫米矽晶圓的價格僅為 50 美元。到 2025 年,對連貫收發器的需求激增,導致前置作業時間延長至 26 週。美國對金屬有機化學氣相沉積 (MOCVD) 設備的出口限制進一步收緊了供應,迫使中國晶圓廠對國產設備進行認證。尺寸擴大到 200 毫米會導致缺陷密度超過 10⁴ cm⁻²,從而降低良率。這種限制在高頻功率放大器和高功率雷射中最為嚴重,因為在這些應用中矽替代並不可行。
細分市場分析
預計到2025年,雷射將佔產品銷售額的38.32%,鞏固其在光電市場中最大的市佔率地位。 IPG和Trumpf光纖雷射系統在金屬切割、焊接和積層製造領域佔據主導地位。相干公司在2024年出貨了200萬條用於感測和泵浦應用的邊發射二極體(LED)條,凸顯了其在雷射雷達(LiDAR)和醫療泵浦領域的深度滲透。預計到2031年,年複合成長率(CAGR)將達到4.91%,主要得益於51.2Terabit交換器中從插件模組轉向共封裝光學元件。儘管通用LED的利潤率面臨壓力,但用於擴增實境(AR)和汽車抬頭顯示器的微型LED顯示器正吸引著AMS OSRAM和Plessey等公司的美元投資。
感測器、檢測器、光纖和光學元件等「長尾」產品系列對系統性能仍然至關重要。濱松光子學預計,在生物感測和自動駕駛汽車需求的推動下,檢測器出貨量在2024年增加了25%。康寧的抗彎曲光纖滿足了5G去程傳輸的彎曲半徑要求,預計2024年光纖出貨量將超過1億公里。隔離器和環形器等微光學元件繼續提供通訊級可靠性。雖然每個細分市場的規模都不大,但它們共同支撐著整個光電市場的成長。
由於矽光電收發器和CMOS影像感測器的廣泛應用,預計到2025年,矽光子收發器和CMOS影像感測器中的廣泛應用,預計到2025年,矽光子仍將維持34.52%的銷售額佔有率。然而,複合半導體的毛利率更高,因為它們的性能直接取決於其帶隙和寬頻隙的特性。磷化銦是連貫400G和800G收發器的基礎材料,能夠實現僅用矽無法達到的參數,例如小於100 kHz的雷射線寬。在電動車逆變器中,氮化鎵正在取代碳化矽,用於1200V以上的電壓範圍,英飛凌和Wolfspeed已開始出貨用於驅動系統的200毫米晶圓。聚合物和塑膠雖然仍處於小眾領域,但隨著軟性波導管在穿戴式生物感測器和折疊式顯示器中的應用,其複合年成長率(CAGR)仍達到4.67%。
鑽石和藍寶石基板滿足國防和雷射市場對極端熱性能和機械性能的要求。玻璃和二氧化矽仍然是光纖、光刻鏡和精密透鏡的關鍵材料,其中肖特和奧哈拉公司為深紫外線掃描儀提供超低膨脹等級的材料。這種材料成分的演變代表著向複合材料和特殊應用平台的穩定轉變,這也是更廣泛的光電市場的核心主題。
區域分析
預計到2025年,亞太地區將佔全球銷售額的41.37%,鞏固其作為光電市場最大區域市場的地位。中國的雷射雷達生態系統、日本的精密光學儀器以及韓國的顯示器背光技術構成了一個密集的供應商網路。到2025年,光是中國就將佔全球雷射雷達出貨量的60%,其中合賽光電和RoboSense兩家公司將佔65%的佔有率。印度的生產連結獎勵計畫(PLI)政策正在將組裝從東南亞轉移到班加羅爾和海得拉巴,預計到2031年,此舉將逐步擴大印度在光電市場的佔有率。各邦政府仍在努力平衡出口限制和國內採購目標,進而影響光電市場的發展方向。
北美仍然是矽光電、收發器和國防光電的設計中心。 2024年,包括英特爾、博通和無晶圓廠新創公司在內的一批公司佔據了資料中心光學模組約55%的市場。國防相關合約為夜視設備和飛彈導引光學裝置帶來了穩定的需求,而這些產品必須符合美國的出口許可要求。儘管北美擁有這些優勢,但出於成本考慮,組裝和測試等製造環節正逐漸轉移到墨西哥。歐洲正憑藉ASML、通快和卡爾蔡司等設備供應商,將自身打造成為光電價值鏈中的增值中心。
中東是成長最快的地區,預計到2031年複合年成長率將達到5.23%。阿拉伯聯合大公國和沙烏地阿拉伯的主權財富基金分別撥款30億美元用於建造需要數百PB光纖連接的超大規模資料中心。長達50年的稅收豁免和放寬的數據居住要求等監管激勵措施,正在吸引先前集中在歐洲的雲端平台。南美和非洲仍在發展中,但光纖到府(FTTH)和5G回程傳輸的機會預計將在未來十年逐步擴大光電市場的規模。
其他好處:
- Excel格式的市場預測(ME)表
- 3個月的分析師支持
目錄
第1章:引言
- 研究假設和市場定義
- 調查範圍
第2章:調查方法
第3章執行摘要
第4章 市場狀況
- 市場概覽
- 市場促進因素
- 資料中心互連的普及正在推動對矽光電收發器的需求。
- 中國汽車製造商採用配備雷射雷達的ADAS系統的現狀
- 歐盟綠色交易對微型LED和氮化鎵光電製造工廠的獎勵
- 印度的生產關聯激勵計畫正在重振該國的光電叢集。
- 美國和歐洲照護現場感測技術的激增
- 投資建設符合航太標準的光電領域衛星衛星群。
- 市場限制因素
- 化合物半導體晶圓(InP、GaN:小於150mm)的瓶頸
- 功率超過10kW的二極體雷射溫度控管的局限性
- 積體光子積體電路標準之間的互通性差距
- 中美之間的貿易限制增加了工具機製造商的資本投資風險。
- 產業價值鏈分析
- 監理情勢
- 技術展望
- 宏觀經濟因素對市場的影響
- 波特五力分析
第5章 市場規模與成長預測
- 依產品
- 雷射
- 二極體雷射
- 光纖雷射
- 固體雷射及其他
- LED
- 感測器和檢測器
- 光纖和波導管
- 調製器和開關
- 其他
- 雷射
- 材料
- 矽
- 玻璃二氧化矽
- 化合物半導體(InP、GaAs、GaN)
- 聚合物塑膠
- 其他
- 波長
- 紫外線 (UV)
- 可見光
- 紅外線的
- 按最終用戶行業分類
- 消費性電子產品
- 航太/國防
- 顯示影像
- 太陽能光電發電
- LED照明
- 醫療和生物測量儀器
- 工業和製造業
- 汽車(包括LiDAR)
- 數據通訊
- 其他
- 按地區
- 北美洲
- 美國
- 加拿大
- 墨西哥
- 歐洲
- 德國
- 英國
- 法國
- 義大利
- 西班牙
- 其他歐洲國家
- 亞太地區
- 中國
- 日本
- 韓國
- 印度
- 東南亞
- 其他亞太國家
- 南美洲
- 巴西
- 其他南美國家
- 中東
- 阿拉伯聯合大公國
- 沙烏地阿拉伯
- 其他中東國家
- 非洲
- 南非
- 其他非洲國家
- 北美洲
第6章 競爭情勢
- 市場集中度
- 策略趨勢
- 市佔率分析
- 公司簡介
- Hamamatsu Photonics KK
- Intel Corporation
- Nokia Corporation
- Coherent Corp.
- AMS OSRAM AG
- IPG Photonics Corp.
- Signify NV
- Lumentum Holdings Inc.
- Infinera Corp.
- NEC Corp.
- Corning Inc.
- Schott AG
- Thorlabs Inc.
- Jenoptik AG
- Trumpf Photonics GmbH
- Molex, LLC
- Rockley Photonics Ltd.
- Innolume GmbH
- Aeva Technologies Inc.
- Broadcom Inc.(Silicon Photonics)
- Carl Zeiss AG
- Nikon Corp.
- Teledyne Technologies Inc.
第7章 市場機會與未來展望
According to Mordor Intelligence, the photonics market size reached USD 1.46 trillion in 2026 and is projected to climb to USD 1.79 trillion by 2031, translating into a 4.16% CAGR over the forecast period.
This report is Segmented by Product (Lasers, Leds, Sensors and Detectors, Optical Fibers and Waveguides, Modulators and Switches, and Other Products), Material (Silicon, Glass and Silica, and More), Wavelength (Ultraviolet, Visible, and Infrared), End-User Industry (Consumer Electronics, Aerospace and Defense, and More), and Geography. The Market Forecasts are Provided in Terms of Value (USD).
Global Photonics Market Trends and Insights
Proliferation Of Data-Center Interconnect Spurring Silicon-Photonics Transceiver Demand
Hyperscale operators are upgrading from 400-gigabit pluggable optics to 800-gigabit and 1.6-terabit co-packaged modules to lower latency and power budgets in AI training clusters. Intel reported 40% year-over-year silicon-photonics revenue growth in 2024, anchored by shipments into GPU pods exceeding 10,000 accelerators per hall.[2] Lumentum's 1.6-terabit Cloud AI platform delivers 15-watt thermal envelopes, encouraging data-center architects to replace discrete transceivers with on-board optics. Traditional module vendors are therefore acquiring photonic-IC design houses to protect gross margins. The ramp is exposing a shortage of indium-phosphide gain chips, where substrate capacity remains limited to 100 mm wafers in Japan and the United States.
Adoption Of LiDAR-Based ADAS Across Chinese Automotive OEMs
Chinese electric-vehicle brands integrated LiDAR sensors into 1.2 million passenger cars during 2025, an 18% penetration rate that dwarfed the 7% seen in Europe and North America. BYD's Seal and Han models employ USD 500 solid-state units from Hesai, halving the cost of mechanically scanned alternatives. NIO pairs Innovusion 1,550-nanometer fiber-laser units with long-range detection that EU regulators are evaluating for Level 3 autonomy certification. Rapid uptake is compressing cost curves for gallium-arsenide edge-emitting lasers, enabling tier-two suppliers to introduce sub-USD 300 modules by late 2026. The trend is creating spill-over demand for silicon avalanche photodiodes and high-frequency driver ICs.
Compound-Semiconductor Wafer Bottlenecks (InP, GaN <150 mm)
Indium-phosphide and gallium-nitride substrates remain confined to 100 mm and 150 mm sizes, keeping wafer prices at USD 1,500 and USD 800 respectively versus USD 50 for 300 mm silicon. Lead times stretched to 26 weeks in 2025 as coherent-transceiver demand spiked. Trade controls imposed by the United States on metal-organic chemical-vapor-deposition tools further tightened supply, forcing Chinese fabs to qualify domestic equipment. Scaling to 200 mm faces defect densities above 10^4 cm^-2 that degrade yield. The constraint is most acute in radio-frequency power amplifiers and high-power lasers where silicon substitutes are infeasible.
Other drivers and restraints analyzed in the detailed report include:
- EU Green-Deal Incentives for Micro-LED And GaN Photonics Fabs
- India's PLI Scheme Catalyzing Domestic Photonics Clusters
- Thermal-Management Limits On >10 kW Diode Lasers
For complete list of drivers and restraints, kindly check the Table Of Contents.
Segment Analysis
Lasers generated 38.32% of 2025 product revenue, underscoring their status as the largest slice of the photonics market. Fiber-laser systems from IPG and Trumpf dominate metal cutting, welding, and additive manufacturing. Coherent shipped 2 million edge-emitting diode bars in 2024 for sensing and pumping, highlighting deep penetration into LiDAR and medical pumping tasks. Modulators and switches are slated for a 4.91% CAGR through 2031 as co-packaged optics displace pluggable modules in 51.2-terabit switches. Although general-illumination LEDs face margin pressure, micro-LED displays for augmented reality and automotive head-up systems are drawing USD-scale investments from AMS OSRAM and Plessey.
The long tail of sensors, detectors, fibers, and optical components remains essential for system performance. Hamamatsu recorded 25% shipment growth in detectors during 2024, driven by biosensing and autonomous-vehicle demand. Corning's bend-insensitive fiber met 5G fronthaul bend-radius requirements, shipping more than 100 million fiber-kilometers in 2024. Micro-optics such as isolators and circulators continue to enable telecom-grade reliability. While each niche is small, collectively they support the broader rise of the photonics market.
Silicon retained 34.52% revenue share in 2025 due to dominant use in silicon-photonics transceivers and CMOS image sensors. Yet compound semiconductors fetch higher gross margins because performance hinges on direct bandgap and wide-bandgap attributes. Indium-phosphide underpins coherent 400G and 800G transceivers with laser linewidths below 100 kHz, an unattainable parameter for silicon alone. Gallium-nitride is replacing silicon carbide above 1,200 V in electric-vehicle inverters, with Infineon and Wolfspeed shipping 200 mm wafers into traction platforms. Polymers and plastics, while only a niche, are registering a 4.67% CAGR as flexible waveguides enter wearable biosensors and foldable displays.
Diamond and sapphire substrates address extreme thermal or mechanical demands in defense and laser markets. Glass and silica remain workhorses for optical fibers, lithography mirrors, and precision lenses, with Schott and Ohara supplying ultra-low-expansion grades for deep-ultraviolet scanners. The evolving material mix signals a steady shift toward compound and specialty platforms, a core theme inside the wider photonics market.
Complete Report Scope:
- By Product
- Lasers
- Diode Lasers
- Fiber Lasers
- Solid-State and Others
- LEDs
- Sensors and Detectors
- Optical Fibers and Waveguides
- Modulators and Switches
- Other Products
- Lasers
- By Material
- Silicon
- Glass and Silica
- Compound Semiconductors (InP, GaAs, GaN)
- Polymers and Plastics
- Other Materials
- By Wavelength
- Ultraviolet (UV)
- Visible
- Infrared
- By End-User Industry
- Consumer Electronics
- Aerospace and Defense
- Display and Imaging
- Solar Photovoltaics
- LED Lighting
- Medical and Bio-Instrumentation
- Industrial and Manufacturing
- Automotive (incl. LiDAR)
- Data and Telecom
- Other End-User Industries
- By Geography
- North America
- United States
- Canada
- Mexico
- Europe
- Germany
- United Kingdom
- France
- Italy
- Spain
- Rest of Europe
- Asia Pacific
- China
- Japan
- South Korea
- India
- South-East Asia
- Rest of Asia Pacific
- South America
- Brazil
- Rest of South America
- Middle East
- United Arab Emirates
- Saudi Arabia
- Rest of Middle East
- Africa
- South Africa
- Rest of Africa
- North America
Geography Analysis
Asia Pacific commanded 41.37% of 2025 revenue, confirming its position as the largest regional block within the photonics market. China's LiDAR ecosystem, Japan's precision optics, and South Korea's display backlights create a dense supplier network. China alone shipped 60% of global LiDAR units in 2025, with Hesai and RoboSense controlling 65% of that volume. India's Production-Linked Incentive policy is drawing assembly lines from Southeast Asia into Bengaluru and Hyderabad, a shift expected to raise India's photonics market share modestly by 2031. Regional governments continue to balance export controls with domestic content targets, shaping how the photonics market evolves.
North America remains the design nucleus for silicon-photonics transceivers and defense photonics. Intel, Broadcom, and a cluster of fabless startups claimed roughly 55% of data-center optical-module sales in 2024. Defense contracting funnels steady demand for night-vision and missile-seeker optics that require U.S. export-license compliance. Despite these advantages, cost-sensitive manufacturing is gradually migrating toward Mexico for assembly and test operations. Europe leverages equipment suppliers ASML, Trumpf, and Carl Zeiss, positioning the region as a value-added node in the photonics supply chain.
The Middle East is the fastest-growing geography, forecast for a 5.23% CAGR through 2031. Sovereign wealth funds in the United Arab Emirates and Saudi Arabia have earmarked USD 3 billion for hyperscale data centers that each require hundreds of petabits of optical connectivity. Regulatory incentives include 50-year tax holidays and relaxed data-residency mandates, attracting cloud platforms previously concentrated in Europe. South America and Africa remain nascent but show fiber-to-the-home and 5G backhaul opportunities that will incrementally enlarge the photonics market size over the next decade.
- Hamamatsu Photonics KK
- Intel Corporation
- Nokia Corporation
- Coherent Corp.
- AMS OSRAM AG
- IPG Photonics Corp.
- Signify NV
- Lumentum Holdings Inc.
- Infinera Corp.
- NEC Corp.
- Corning Inc.
- Schott AG
- Thorlabs Inc.
- Jenoptik AG
- Trumpf Photonics GmbH
- Molex, LLC
- Rockley Photonics Ltd.
- Innolume GmbH
- Aeva Technologies Inc.
- Broadcom Inc. (Silicon Photonics)
- Carl Zeiss AG
- Nikon Corp.
- Teledyne Technologies Inc.
Additional Benefits:
- The market estimate (ME) sheet in Excel format
- 3 months of analyst support
TABLE OF CONTENTS
1 INTRODUCTION
- 1.1 Study Assumptions and Market Definition
- 1.2 Scope of the Study
2 RESEARCH METHODOLOGY
3 EXECUTIVE SUMMARY
4 MARKET LANDSCAPE
- 4.1 Market Overview
- 4.2 Market Drivers
- 4.2.1 Proliferation of Data-Center Interconnect Spurring Silicon Photonics Transceiver Demand
- 4.2.2 Adoption of LiDAR-Based ADAS Across Chinese Automotive OEMs
- 4.2.3 EU Green-Deal Incentives for Micro-LED and GaN Photonics Fabs
- 4.2.4 India's PLI Scheme Catalyzing Domestic Photonics Clusters
- 4.2.5 Point-of-Care Biosensing Surge in United States and Europe
- 4.2.6 Satellite Mega-Constellation Investments in Space-Qualified Photonics
- 4.3 Market Restraints
- 4.3.1 Compound-Semiconductor Wafer Bottlenecks (InP, GaN <150 mm)
- 4.3.2 Thermal-Management Limits on >10 kW Diode Lasers
- 4.3.3 Interoperability Gaps Among Integrated Photonic IC Standards
- 4.3.4 U.S.- China Trade Controls Elevating Cap-Ex Risk for Tool Makers
- 4.4 Industry Value-Chain Analysis
- 4.5 Regulatory Landscape
- 4.6 Technological Outlook
- 4.7 Impact of Macroeconomic Factors on the Market
- 4.8 Porter's Five Forces Analysis
- 4.8.1 Bargaining Power of Suppliers
- 4.8.2 Bargaining Power of Buyers
- 4.8.3 Threat of New Entrants
- 4.8.4 Threat of Substitutes
- 4.8.5 Intensity of Competitive Rivalry
5 MARKET SIZE AND GROWTH FORECASTS (VALUE)
- 5.1 By Product
- 5.1.1 Lasers
- 5.1.1.1 Diode Lasers
- 5.1.1.2 Fiber Lasers
- 5.1.1.3 Solid-State and Others
- 5.1.2 LEDs
- 5.1.3 Sensors and Detectors
- 5.1.4 Optical Fibers and Waveguides
- 5.1.5 Modulators and Switches
- 5.1.6 Other Products
- 5.1.1 Lasers
- 5.2 By Material
- 5.2.1 Silicon
- 5.2.2 Glass and Silica
- 5.2.3 Compound Semiconductors (InP, GaAs, GaN)
- 5.2.4 Polymers and Plastics
- 5.2.5 Other Materials
- 5.3 By Wavelength
- 5.3.1 Ultraviolet (UV)
- 5.3.2 Visible
- 5.3.3 Infrared
- 5.4 By End-User Industry
- 5.4.1 Consumer Electronics
- 5.4.2 Aerospace and Defense
- 5.4.3 Display and Imaging
- 5.4.4 Solar Photovoltaics
- 5.4.5 LED Lighting
- 5.4.6 Medical and Bio-Instrumentation
- 5.4.7 Industrial and Manufacturing
- 5.4.8 Automotive (incl. LiDAR)
- 5.4.9 Data and Telecom
- 5.4.10 Other End-User Industries
- 5.5 By Geography
- 5.5.1 North America
- 5.5.1.1 United States
- 5.5.1.2 Canada
- 5.5.1.3 Mexico
- 5.5.2 Europe
- 5.5.2.1 Germany
- 5.5.2.2 United Kingdom
- 5.5.2.3 France
- 5.5.2.4 Italy
- 5.5.2.5 Spain
- 5.5.2.6 Rest of Europe
- 5.5.3 Asia Pacific
- 5.5.3.1 China
- 5.5.3.2 Japan
- 5.5.3.3 South Korea
- 5.5.3.4 India
- 5.5.3.5 South-East Asia
- 5.5.3.6 Rest of Asia Pacific
- 5.5.4 South America
- 5.5.4.1 Brazil
- 5.5.4.2 Rest of South America
- 5.5.5 Middle East
- 5.5.5.1 United Arab Emirates
- 5.5.5.2 Saudi Arabia
- 5.5.5.3 Rest of Middle East
- 5.5.6 Africa
- 5.5.6.1 South Africa
- 5.5.6.2 Rest of Africa
- 5.5.1 North America
6 COMPETITIVE LANDSCAPE
- 6.1 Market Concentration
- 6.2 Strategic Moves
- 6.3 Market Share Analysis
- 6.4 Company Profiles (includes Global Level Overview, Market Level Overview, Core Segments, Financials as Available, Strategic Information, Market Rank, Products and Services, Recent Developments)
- 6.4.1 Hamamatsu Photonics KK
- 6.4.2 Intel Corporation
- 6.4.3 Nokia Corporation
- 6.4.4 Coherent Corp.
- 6.4.5 AMS OSRAM AG
- 6.4.6 IPG Photonics Corp.
- 6.4.7 Signify NV
- 6.4.8 Lumentum Holdings Inc.
- 6.4.9 Infinera Corp.
- 6.4.10 NEC Corp.
- 6.4.11 Corning Inc.
- 6.4.12 Schott AG
- 6.4.13 Thorlabs Inc.
- 6.4.14 Jenoptik AG
- 6.4.15 Trumpf Photonics GmbH
- 6.4.16 Molex, LLC
- 6.4.17 Rockley Photonics Ltd.
- 6.4.18 Innolume GmbH
- 6.4.19 Aeva Technologies Inc.
- 6.4.20 Broadcom Inc. (Silicon Photonics)
- 6.4.21 Carl Zeiss AG
- 6.4.22 Nikon Corp.
- 6.4.23 Teledyne Technologies Inc.
7 MARKET OPPORTUNITIES AND FUTURE OUTLOOK
- 7.1 White-Space and Unmet-Need Assessment

 氮化矽光源市場:全球市場預測,2026-2032年
 光子半導體市場預測至2034年-全球分析(按元件類型、半導體材料、整合方法、雷射類型、調變器類型、檢測器類型、技術、應用、最終用戶和地區分類)光電市場-2026-2032年全球市場預測先進光子材料市場預測至2034年—按材料類型、技術、波長範圍、應用、最終用戶和地區分類的全球分析
 2026年全球電子與光電市場報告光電半導體市場預測至2034年:按產品、材料、波長、應用和地區分類的全球分析2026年全球光電市場報告先進光電市場預測至2034年—按產品、技術、應用、最終用戶和地區分類的全球分析
 光電研究評論:2025
 光電市場報告:按類型、應用、最終用戶和地區分類(2026-2034 年)