


 |
市場調查報告書
商品編碼
2100515
光子感測器:市場佔有率分析、產業趨勢與統計、成長預測(2026-2031)Photonic Sensors - Market Share Analysis, Industry Trends & Statistics, Growth Forecasts (2026 - 2031) |
||||||

※ 本網頁內容可能與最新版本有所差異。詳細情況請與我們聯繫。
根據 Mordor Intelligence 預測,光子感測器市場規模將從 2025 年的 330.1 億美元成長到 2026 年的 366.8 億美元,然後在 2031 年達到 621.3 億美元,2026 年至 2031 年的複合年成長率為 11.12%。
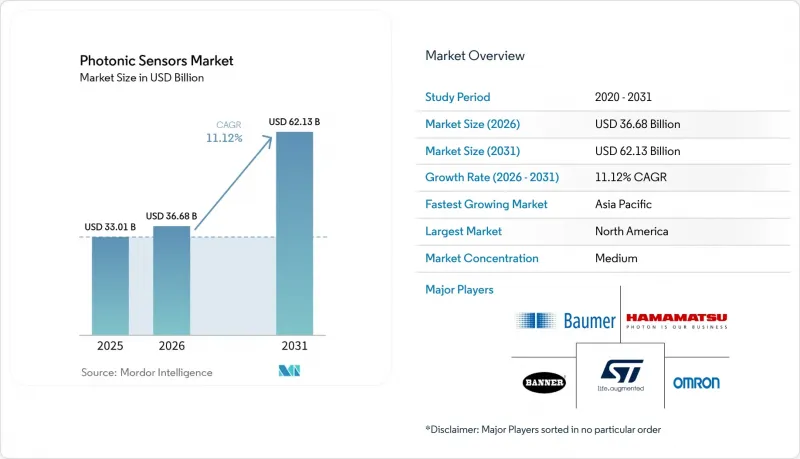
本報告按產品類型(光纖感測器、影像感測器及其他)、終端用戶產業(航太與國防、汽車、工業自動化及其他)、應用領域(結構完整性監測、溫度和壓力感測及其他)、技術(光纖布拉格光柵、法布里-珀羅干涉法及其他)和地區進行細分。市場預測以美元計價。
全球光子感測器市場趨勢及洞察
製造工廠對自動化的需求日益成長
在工業設施中,光子感測器正被廣泛應用於對微米級精度和抗電磁雜訊能力要求極高的場合。測量塗層厚度、偵測焊接和振動監測都是光纖感測技術提升生產效率的典型應用。預測性維護程序整合了分散式光子陣列,用於在災難性故障發生前檢測軸承磨損。汽車車身修理廠利用雷射位移感測器來引導機器人並縮短循環時間。隨著工業4.0的普及,對即時分析的需求日益成長,而光子感測器的長使用壽命足以抵消其初始投資成本。隨著工廠數位化程度的不斷提高,光子感測器市場正日益深入地融入需要確定性數據的控制迴路中。
加大光纖通訊基礎設施的投資
通訊業者正在部署分散式光纖感測技術,以監測其數千公里網路中的溫度、應力和入侵情況,從而確保服務運作。資料中心營運商正在機架中整合光子溫度陣列,以識別電子探針無法偵測到的熱點。隨著5G網路密度的不斷提高,基地台之間的鏈路數量正在翻倍成長,這加速了用於報告延遲和功率漂移的線上光學監測器的部署。由北美和歐洲的獎勵策略資助的智慧電網專案採用了光纖故障檢測技術,以減少停電頻率。隨著容量升級的不斷推進,嵌入式感測正成為一項標準功能,光子感測器市場也正在向營運商級硬體領域擴展。
前期實施成本高
一套完整的光子感測器系統的成本在 5 萬至 20 萬美元之間,而電子感測器的成本僅為 1 萬至 3 萬美元,這導致工廠和診所的投資回收期更長。儘管產品生命週期內的維護成本較低,但中小企業仍在推遲升級。實施過程需要專業的安裝人員和培訓,推高了整體擁有成本。在醫療領域,保險報銷機制未能跟上技術進步的步伐,即使臨床益處顯而易見,也限制了生醫光電診斷技術的應用。雖然隨著產量增加和整合設計的成熟,單位成本將會下降,但短期預算限制正在限制光子感測器市場的成長軌跡。
細分市場分析
到2025年,影像感測器將保持37.55%的光子感測器市場佔有率。這主要得益於汽車攝影機、工業線掃描系統和機器視覺工具對可擴展且低成本光電裝置的需求。同時,雷射雷達平台以12.03%的複合年成長率(CAGR)位居榜首,這主要得益於自動駕駛、倉儲機器人和智慧基礎設施等需要即時3D測繪技術的領域的廣泛應用。固態設計顯著降低了單位成本,從2020年的1萬美元降至2024年的1000美元以下,從而消除了其普及應用的主要障礙。光纖感測器在結構完整性監測領域發揮獨特的作用,其抗雷擊和抗電磁干擾性能遠超成本優勢。生醫光電感測器在診斷領域的應用日益廣泛,尤其是在用於慢性病管理的血糖值和乳酸監測方面。
雷射雷達供應商正將光束控制和訊號處理功能整合到矽光子晶片上,這是整個光電產業的關鍵創新,旨在縮小機殼尺寸並降低功耗。這也滿足了汽車產業的認證要求。影像感測器供應商正利用CMOS製造的成本優勢,將高動態範圍元件推向市場,這些元件即使在工廠檢測的極端光照條件下也能使用。兆赫成像器正被用於篩檢和無損檢測,但由於材料吸收特性和監管障礙,短期產量受到限制。量子點檢測器預計在室溫下實現紅外線靈敏度,並引起了夜視技術的關注。隨著各項技術的成熟,它們之間的融合日益加深。例如,3D相機正在整合結構光發射器,而LiDAR單元正在整合用於感測器融合的攝影機。這種融合正在使光子感測器市場的收入來源更加多元化。
到2025年,工業自動化將佔光子感測器市場29.21%的佔有率。這主要是由於預測性維護和品質保證需要連續且無干擾的數據。預計到2031年,汽車領域將以11.71%的複合年成長率成長,這主要得益於雷射雷達、成像和紅外線陣列的加入,以確保高級駕駛輔助系統(ADAS)的安全冗餘。在航太和國防領域,能夠承受振動、輻射和極端溫度環境的堅固型光子感測器正被廣泛採用,以滿足導航和威脅偵測的強勁需求。
在醫療領域,穿戴式生物感測器和機器人手術的應用正在加速發展;在能源和公共產業領域,分散式光纖系統正被用於即時監測管道和電纜線路。消費性電子市場仍然對價格敏感,但擴增實境(AR)頭戴裝置和手勢控制設備正在開闢新的設計應用機會。環境監測機構正在部署光子氣體分析儀,該分析儀能夠檢測十億分之一等級的污染物。這些趨勢共同推動光子感測器產業的業務領域超越了其最初的工業領域。
區域分析
預計到2025年,北美將佔全球收入的38.28%,這主要得益於持續的國防採購、半導體製造以及依賴高性能感測技術的自動駕駛汽車早期示範計畫。研究型大學和創業投資的生態系統正在縮短從概念到商業化的時間,而鼓勵生產回流的獎勵則推動了對半導體和電池工廠的需求。 FDA的監管雖然延長了醫療設備的上市時間,但也提高了進入門檻,並有助於鞏固現有企業在光子感測器市場的地位。
到2031年,亞太地區將以12.09%的複合年成長率成長,這主要得益於中國、日本和韓國為滿足出口品質標準而抵消人事費用並推進工廠自動化。在中國的「一帶一路」計劃下,光纖監測系統正被引入管道和鐵路。在日本老化社會中,光子診斷技術正被應用於居家照護;而在韓國的半導體產業中,皮克級靈敏度的空氣顆粒物檢測器正在安裝應用。地方政府為感測器製造企業提供稅收優惠,從而加強了區域供應鏈。
在歐洲,技術出口與嚴格的安全和永續性要求之間取得了平衡。德國的「工業4.0」計畫正在推動中型企業(Mittelstand)工廠採用智慧感測技術,而歐盟的「綠色交易」則為利用分散式光纖感測技術的智慧電網部署提供資金支持。德國、法國和瑞典的汽車原始設備製造商(OEM)正在採用多感測器冗餘技術以獲得歐洲新車安全評估協會(Euro NCAP)的評級,這推動了對光子感測器的需求。拉丁美洲和非洲仍在發展中,但通訊和能源基礎設施的現代化預計將帶來成長機會。總體而言,區域分散化保護了光子感測器市場免受特定地區衝擊的影響。
其他好處
- Excel格式的市場預測(ME)表
- 3個月的分析師支持
目錄
第1章:引言
- 研究假設和市場定義
- 調查範圍
第2章:調查方法
第3章執行摘要
第4章 市場狀況
- 市場概覽
- 市場促進因素
- 製造工廠對自動化的需求日益成長
- 加大光纖通訊基礎設施的投資
- 智慧城市對安全保障系統的需求日益成長
- 利用生醫光電感測技術拓展醫療診斷領域
- 光子積體電路的出現使得片上感測成為可能。
- 倉儲機器人領域對基於雷射雷達的環境識別技術的需求
- 市場限制因素
- 較高的初始設定成本
- 業界缺乏統一標準
- 特種光纖預型體供應鏈瓶頸
- 光子感測器在惡劣輻射環境下的性能漂移
- 產業價值鏈分析
- 監理情勢
- 技術展望
- 波特五力分析
- 宏觀經濟因素的影響
第5章 市場規模與成長預測
- 依產品類型
- 光纖感測器
- 影像感測器
- 生醫光電感測器
- LiDAR感測器
- 其他
- 按最終用戶行業分類
- 航太/國防
- 車
- 工業自動化
- 醫療保健和生命科學
- 能源和發電
- 家用電子產品
- 環境監測
- 其他
- 透過使用
- 結構完整性監測
- 溫度和壓力感測
- 化學和生物感測
- 位置和位移檢測
- 安全保障
- 影像和掃描
- 其他
- 透過技術
- 光纖布拉格光柵
- 法布里-珀羅干涉測量法
- 拉曼散射和Brillouin散射
- 光電二極體和CMOS
- 量子點和光電
- 兆赫光電
- 其他
- 按地區
- 北美洲
- 美國
- 加拿大
- 墨西哥
- 南美洲
- 巴西
- 阿根廷
- 其他南美國家
- 歐洲
- 德國
- 英國
- 法國
- 義大利
- 西班牙
- 其他歐洲國家
- 亞太地區
- 中國
- 日本
- 韓國
- 印度
- ASEAN
- 其他亞太國家
- 中東和非洲
- 中東
- 沙烏地阿拉伯
- 阿拉伯聯合大公國
- 土耳其
- 其他中東國家
- 非洲
- 南非
- 奈及利亞
- 其他非洲地區
- 中東
- 北美洲
第6章 競爭情勢
- 市場集中度
- 策略趨勢
- 市佔率分析
- 公司簡介
- Banner Engineering Corp.
- Baumer Holding AG
- STMicroelectronics NV
- Hamamatsu Photonics KK
- Omron Corporation
- Sick AG
- Keyence Corporation
- Pepperl+Fuchs SE
- Rockwell Automation, Inc.
- Autonics Corporation
- Teledyne FLIR LLC
- Luna Innovations Incorporated
- Altechna Co. Ltd.
- First Sensor AG
- Micron Technology, Inc.
- Texas Instruments Incorporated
- Excelitas Technologies Corp.
- Thorlabs, Inc.
- Coherent Corp.
- II-VI Incorporated
- Yokogawa Electric Corporation
- Bosch Sensortec GmbH
- TriLumina Corp.
- Leonardo SpA
- Qorvo, Inc.
第7章 市場機會與未來展望
According to Mordor Intelligence, the photonic sensors market size is expected to grow from USD 33.01 billion in 2025 to USD 36.68 billion in 2026 and is forecast to reach USD 62.13 billion by 2031 at 11.12% CAGR over 2026-2031.
This report is Segmented by Product Type (Fiber-Optic Sensors, Image Sensors, and More), End-User Industry (Aerospace and Defense, Automotive, Industrial Automation, and More), Application (Structural Health Monitoring, Temperature and Pressure Sensing, and More), Technology (Fiber Bragg Grating, Fabry-perot Interferometry, and More), and Geography. The Market Forecasts are Provided in Terms of Value (USD).
Global Photonic Sensors Market Trends and Insights
Growing Automation Demand in Manufacturing Environments
Industrial facilities deploy photonic sensors where micron-level accuracy and immunity to electromagnetic noise are mission-critical. Paint-thickness checks, weld inspection, and vibration surveillance demonstrate how fiber-optic sensing raises production yields. Predictive-maintenance programs integrate distributed photonic arrays that identify bearing wear before catastrophic failure. Automotive body shops leverage laser displacement sensors for robotic guidance, reducing cycle times. Industry 4.0 adoption amplifies demand for real-time analytics, and photonic sensor longevity offsets initial capital outlays. As factories digitize, the photonic sensors market embeds deeper in control loops that require deterministic data.
Increasing Investment in Fiber-Optic Communication Infrastructure
Telecom carriers roll out distributed fiber-optic sensing to track temperature, strain, and intrusion along thousands of kilometers of network, safeguarding service uptime. Data-center operators integrate photonic temperature arrays inside racks to pinpoint hotspots that electronic probes miss. 5G densification multiplies base-station links and drives uptake of inline optical monitors that report latency and power drift. Smart-grid programs funded by stimulus bills in North America and Europe include fiber-optic fault-detection to curb outage frequency. As capacity upgrades proceed, embedded sensing becomes a default feature, extending the photonic sensors market into carrier-class hardware.
High Initial Implementation Cost
Comprehensive photonic sensor systems cost USD 50,000-200,000 versus USD 10,000-30,000 for electronic counterparts, stretching payback periods for factories and clinics. Small enterprises delay upgrades despite lower maintenance expenses over the product life cycle. Deployment requires specialist installers and training, inflating total cost of ownership. In healthcare, reimbursement schedules lag technology, limiting adoption of biophotonic diagnostics even when clinical benefits are clear. As volume grows and integrated designs mature, unit prices fall, but near-term budgets restrain the photonic sensors market trajectory.
Other drivers and restraints analyzed in the detailed report include:
- Rising Demand for Safety and Security Systems in Smart Cities
- Expansion of Healthcare Diagnostics Leveraging Biophotonic Sensing
- Supply-Chain Bottlenecks in Specialty Optical-Fiber Preforms
For complete list of drivers and restraints, kindly check the Table Of Contents.
Segment Analysis
Image sensors retained a 37.55% share of the photonic sensors market size in 2025 as automotive cameras, industrial line-scan systems, and machine-vision tools required scalable, low-cost optoelectronics. LiDAR platforms, however, record the fastest 12.03% CAGR due to autonomous mobility, warehouse robotics, and smart-infrastructure deployments that need real-time 3D mapping. Solid-state designs have collapsed unit pricing from USD 10,000 in 2020 to under USD 1,000 by 2024, removing a major adoption barrier. Fiber-optic sensors hold niche roles in structural health monitoring where immunity to lightning and electromagnetic interference outweighs cost. Biophotonic sensors gain ground in diagnostics, especially glucose and lactate monitoring for chronic-disease management.
LiDAR vendors integrate beam steering and signal processing on silicon photonic chips, a key innovation within the broader Photonics industry, to shrink enclosure size and curb power draw, which aligns with automotive qualification demands. Image-sensor suppliers exploit CMOS fabrication economies to release high dynamic-range devices for factory inspection lighting extremes. Terahertz imagers address security screening and non-destructive testing, although material absorption and regulatory hurdles cap near-term volume. Quantum-dot detectors promise infrared sensitivity at room temperature, attracting interest for night vision. As each technology matures, cross-pollination occurs: 3D cameras embed structured-light emitters, and LiDAR units incorporate cameras for sensor fusion. This convergence diversifies revenue streams within the photonic sensors market.
Industrial automation owned 29.21% of photonic sensors market share in 2025 because predictive maintenance and quality assurance require continuous, interference-free data. The automotive category advances at an 11.71% CAGR through 2031 as advanced driver-assistance systems add LiDAR, imaging, and infrared arrays for safety redundancy. Aerospace and defense demand remains steady for navigation and threat detection, with ruggedized photonic sensors specified for vibration, radiation, and temperature extremes.
Healthcare accelerates on wearable biosensors and robotic surgery, while energy utilities adopt distributed fiber-optic systems for real-time pipeline and cable-line monitoring. Consumer electronics remain price-sensitive, yet augmented-reality headsets and gesture-control devices open new design-win opportunities. Environmental monitoring agencies deploy photonic gas analyzers that detect pollutants at parts-per-billion levels. Collectively, these trends broaden the photonic sensors industry footprint beyond early industrial roots.
Complete Report Scope:
- By Product Type
- Fiber-Optic Sensors
- Image Sensors
- Biophotonic Sensors
- LiDAR Sensors
- Other Product Types
- By End-User Industry
- Aerospace and Defense
- Automotive
- Industrial Automation
- Healthcare and Life Sciences
- Energy and Power
- Consumer Electronics
- Environmental Monitoring
- Other End-User Industries
- By Application
- Structural Health Monitoring
- Temperature and Pressure Sensing
- Chemical and Biological Sensing
- Position and Displacement Sensing
- Safety and Security
- Imaging and Scanning
- Others
- By Technology
- Fiber Bragg Grating
- Fabry-Perot Interferometry
- Raman and Brillouin Scattering
- Photodiode and CMOS
- Quantum Dots and Nanophotonics
- Terahertz Photonics
- Others
- By Geography
- North America
- United States
- Canada
- Mexico
- South America
- Brazil
- Argentina
- Rest of South America
- Europe
- Germany
- United Kingdom
- France
- Italy
- Spain
- Rest of Europe
- Asia-Pacific
- China
- Japan
- South Korea
- India
- ASEAN
- Rest of Asia-Pacific
- Middle East and Africa
- Middle East
- Saudi Arabia
- United Arab Emirates
- Turkey
- Rest of Middle East
- Africa
- South Africa
- Nigeria
- Rest of Africa
- Middle East
- North America
Geography Analysis
North America accounted for 38.28% of 2025 revenue due to sustained defense procurement, semiconductor fabs, and early autonomous-vehicle pilots that rely on high-performance sensing. Research universities and venture capital ecosystems shorten concept-to-commercial cycles, while reshoring incentives boost demand in chip and battery plants. FDA regulation lengthens medical-device launch timelines but also elevates entry barriers, shielding incumbents in the photonic sensors market.
Asia-Pacific expands at a 12.09% CAGR through 2031 as China, Japan, and South Korea automate factories to offset labor costs and meet export-quality standards. China's Belt and Road projects embed fiber-optic monitoring in pipelines and railways. Japan's aging society adopts photonic diagnostics for home care, while South Korea's semiconductor industry installs airborne-particle detectors with picogram sensitivity. Local governments provide tax breaks for sensor fabs, strengthening regional supply chains.
Europe balances technology exports with strict safety and sustainability mandates. Germany's Industry 4.0 program disseminates intelligent sensing into Mittelstand factories, and EU Green Deal funds smart-grid rollouts that use distributed fiber-optic sensing. Automotive OEMs in Germany, France, and Sweden incorporate multi-sensor redundancy to achieve Euro NCAP ratings, bolstering photonic sensor demand. Latin America and Africa remain nascent but will unlock growth as telecom and energy infrastructure modernize. Overall, regional diversification protects the photonic sensors market from single-region shocks.
- Banner Engineering Corp.
- Baumer Holding AG
- STMicroelectronics N.V.
- Hamamatsu Photonics K.K.
- Omron Corporation
- Sick AG
- Keyence Corporation
- Pepperl+Fuchs SE
- Rockwell Automation, Inc.
- Autonics Corporation
- Teledyne FLIR LLC
- Luna Innovations Incorporated
- Altechna Co. Ltd.
- First Sensor AG
- Micron Technology, Inc.
- Texas Instruments Incorporated
- Excelitas Technologies Corp.
- Thorlabs, Inc.
- Coherent Corp.
- II-VI Incorporated
- Yokogawa Electric Corporation
- Bosch Sensortec GmbH
- TriLumina Corp.
- Leonardo S.p.A.
- Qorvo, Inc.
Additional Benefits:
- The market estimate (ME) sheet in Excel format
- 3 months of analyst support
TABLE OF CONTENTS
1 INTRODUCTION
- 1.1 Study Assumptions and Market Definition
- 1.2 Scope of the Study
2 RESEARCH METHODOLOGY
3 EXECUTIVE SUMMARY
4 MARKET LANDSCAPE
- 4.1 Market Overview
- 4.2 Market Drivers
- 4.2.1 Growing automation demand in manufacturing environments
- 4.2.2 Increasing investment in fiber-optic communication infrastructure
- 4.2.3 Rising demand for safety and security systems in smart cities
- 4.2.4 Expansion of healthcare diagnostics leveraging biophotonic sensing
- 4.2.5 Emergence of photonic integrated circuits enabling on-chip sensing
- 4.2.6 Demand for LiDAR-based perception in warehouse robotics
- 4.3 Market Restraints
- 4.3.1 High initial implementation cost
- 4.3.2 Lack of universal industry standards
- 4.3.3 Supply-chain bottlenecks in specialty optical-fiber preforms
- 4.3.4 Photonic-sensor performance drift under harsh radiation environments
- 4.4 Industry Value Chain Analysis
- 4.5 Regulatory Landscape
- 4.6 Technological Outlook
- 4.7 Porter's Five Forces Analysis
- 4.7.1 Bargaining Power of Suppliers
- 4.7.2 Bargaining Power of Buyers
- 4.7.3 Threat of New Entrants
- 4.7.4 Threat of Substitutes
- 4.7.5 Intensity of Competitive Rivalry
- 4.8 Impact of Macroeconomic Factors
5 MARKET SIZE AND GROWTH FORECASTS (VALUE)
- 5.1 By Product Type
- 5.1.1 Fiber-Optic Sensors
- 5.1.2 Image Sensors
- 5.1.3 Biophotonic Sensors
- 5.1.4 LiDAR Sensors
- 5.1.5 Other Product Types
- 5.2 By End-User Industry
- 5.2.1 Aerospace and Defense
- 5.2.2 Automotive
- 5.2.3 Industrial Automation
- 5.2.4 Healthcare and Life Sciences
- 5.2.5 Energy and Power
- 5.2.6 Consumer Electronics
- 5.2.7 Environmental Monitoring
- 5.2.8 Other End-User Industries
- 5.3 By Application
- 5.3.1 Structural Health Monitoring
- 5.3.2 Temperature and Pressure Sensing
- 5.3.3 Chemical and Biological Sensing
- 5.3.4 Position and Displacement Sensing
- 5.3.5 Safety and Security
- 5.3.6 Imaging and Scanning
- 5.3.7 Others
- 5.4 By Technology
- 5.4.1 Fiber Bragg Grating
- 5.4.2 Fabry-Perot Interferometry
- 5.4.3 Raman and Brillouin Scattering
- 5.4.4 Photodiode and CMOS
- 5.4.5 Quantum Dots and Nanophotonics
- 5.4.6 Terahertz Photonics
- 5.4.7 Others
- 5.5 By Geography
- 5.5.1 North America
- 5.5.1.1 United States
- 5.5.1.2 Canada
- 5.5.1.3 Mexico
- 5.5.2 South America
- 5.5.2.1 Brazil
- 5.5.2.2 Argentina
- 5.5.2.3 Rest of South America
- 5.5.3 Europe
- 5.5.3.1 Germany
- 5.5.3.2 United Kingdom
- 5.5.3.3 France
- 5.5.3.4 Italy
- 5.5.3.5 Spain
- 5.5.3.6 Rest of Europe
- 5.5.4 Asia-Pacific
- 5.5.4.1 China
- 5.5.4.2 Japan
- 5.5.4.3 South Korea
- 5.5.4.4 India
- 5.5.4.5 ASEAN
- 5.5.4.6 Rest of Asia-Pacific
- 5.5.5 Middle East and Africa
- 5.5.5.1 Middle East
- 5.5.5.1.1 Saudi Arabia
- 5.5.5.1.2 United Arab Emirates
- 5.5.5.1.3 Turkey
- 5.5.5.1.4 Rest of Middle East
- 5.5.5.2 Africa
- 5.5.5.2.1 South Africa
- 5.5.5.2.2 Nigeria
- 5.5.5.2.3 Rest of Africa
- 5.5.5.1 Middle East
- 5.5.1 North America
6 COMPETITIVE LANDSCAPE
- 6.1 Market Concentration
- 6.2 Strategic Moves
- 6.3 Market Share Analysis
- 6.4 Company Profiles (includes Global level Overview, Market level overview, Core Segments, Financials as available, Strategic Information, Market Rank/Share for key companies, Products and Services, and Recent Developments)
- 6.4.1 Banner Engineering Corp.
- 6.4.2 Baumer Holding AG
- 6.4.3 STMicroelectronics N.V.
- 6.4.4 Hamamatsu Photonics K.K.
- 6.4.5 Omron Corporation
- 6.4.6 Sick AG
- 6.4.7 Keyence Corporation
- 6.4.8 Pepperl+Fuchs SE
- 6.4.9 Rockwell Automation, Inc.
- 6.4.10 Autonics Corporation
- 6.4.11 Teledyne FLIR LLC
- 6.4.12 Luna Innovations Incorporated
- 6.4.13 Altechna Co. Ltd.
- 6.4.14 First Sensor AG
- 6.4.15 Micron Technology, Inc.
- 6.4.16 Texas Instruments Incorporated
- 6.4.17 Excelitas Technologies Corp.
- 6.4.18 Thorlabs, Inc.
- 6.4.19 Coherent Corp.
- 6.4.20 II-VI Incorporated
- 6.4.21 Yokogawa Electric Corporation
- 6.4.22 Bosch Sensortec GmbH
- 6.4.23 TriLumina Corp.
- 6.4.24 Leonardo S.p.A.
- 6.4.25 Qorvo, Inc.
7 MARKET OPPORTUNITIES AND FUTURE OUTLOOK
- 7.1 White-space and Unmet-Need Assessment

 光電感測器市場規模、佔有率、成長、全球產業分析、區域趨勢及2026年至2034年預測動態視覺感測器市場規模、佔有率、成長、全球產業分析、區域趨勢及2026年至2034年預測
 全球光子晶體材料市場預測(至2034年):依材料類型、結構、波長、應用、產業及地區分類
 光電感測器市場規模、佔有率、趨勢和預測:按產品類型、最終用途產業和地區分類,2026-2034年光子材料市場預測至2034年-按材料類型、形態、波長、技術、應用、最終用戶和地區分類的全球分析
 按技術、終端用戶產業、應用和輸出訊號分類的槽型感測器市場,全球預測(2026-2032年)
 2026年全球動態視覺感測器市場報告2026年全球槽式光電斷路器市場報告
 光電感測器市場 - 全球產業規模、佔有率、趨勢、機會及預測(按產品類型、產業垂直領域、地區和競爭格局分類,2021-2031年)光電感測器市場-全球產業規模、佔有率、趨勢、機會、預測:按產品、技術、應用、地區和競爭格局分類,2021-2031年